Kubernetes Audit Logs - Best Practices And Configuration
Kubernetes is the de facto leader of container orchestration tools. With the growing popularity of micro-service-based development, Kubernetes emerged as the go-to tool to deploy and manage large-scale enterprise applications. However, with the plethora of features offered by Kubernetes, it is a complex tool to manage and operate. This article will focus on how to configure Kubernetes Audit Logs so that you can have the records of events happening in your cluster.
What is Kubernetes Audit Log?
If you have working experience with Kubernetes, then you must be aware that all the communications between Kubernetes components and the commands executed by the users are REST API calls. Kubernetes API Server is the component that processes all these requests. So whenever you execute a kubectl command, it is basically a wrapper for the API call made to the API Server.
Kubernetes Audit Logs record all these API calls made to the API Server. This includes the API calls by different users and the ones made by different components of Kubernetes itself. These logs provide a lot of information related to the API request, like the time of the request, source IP and the user who made the request, what kind of the request it was, and the response sent by API Server.
Why Should You Configure Kubernetes Audit Logs?
Audit logs provide visibility into the events occurring in a Kubernetes cluster and act as a foundation for security and compliance. With properly configured audit logging, you can quickly identify any abnormal activity going on in your cluster, like failed login attempts or attempts to access sensitive Secrets. Auditing lets you quickly take action on malicious activities instead of operating in silos. Regular auditing of the event log data also assists in implementing cluster hardening and mitigating any misconfiguration.
Kubernetes Audit Policy
Audit Logs are captured based on the Audit Policy configured. Audit policy defines what events should be recorded and what data to be included. Rules configured in the Audit policy are processed in order, and the first matching rule sets the audit level of the event.
Each request can be recorded with an associated stage. Following are the stages for which audit logging can be enabled:
- RequestReceived: The stage for events generated as soon as the audit handler receives the request
- ResponseStarted: Once the response headers are sent, but before the response body is sent.
- ResponseComplete: The response body has been completed
- Panic: Events generated when a panic occurred
The information captured for an event depends upon the audit level configured. You can use the following audit levels:
- None: Don't log events that match this rule
- Metadata: Log request event metadata.Request/Response body is not logged.
- Request: Log event metadata and request body
- RequestResponse: Log event metadata along with request and response body
Configuring Kubernetes Auditing
Now is the time to see Kubernetes Auditing in action. In a self-hosted cluster, auditing is not enabled out of the box. If you are using a managed Kubernetes cluster, you may go through your vendor's documentation to check whether auditing is enabled by default or if you need to enable it. The cluster used here has one control-plane instance and one node instance, and you can use the same steps for a minikube cluster or any other bare-metal Kubernetes cluster.
Step 1: Connect to control-plane
Connect to the control-plane node and create a directory to host the audit policy as well as audit logs.
mkdir /etc/kubernetes/audit
Step 2: Create an audit policy
Create an audit policy file named /etc/kubernetes/audit/policy.yaml with the following data:
apiVersion: audit.k8s.io/v1
kind: Policy
rules:

- level: None
  verbs: ["get", "watch", "list"]

- level: None
  resources:
  - group: "" # core
    resources: ["events"]

- level: None
  users:
  - "system:kube-scheduler"
  - "system:kube-proxy"
  - "system:apiserver"
  - "system:kube-controller-manager"
  - "system:serviceaccount:gatekeeper-system:gatekeeper-admin"

- level: None
  userGroups: ["system:nodes"]

- level: RequestResponse
Step 3: Add required entries
Add following entries in /etc/kubernetes/manifests/kube-apiserver.yaml:
- --audit-policy-file=/etc/kubernetes/audit/policy.yaml
- --audit-log-path=/etc/kubernetes/audit/audit.log
- --audit-log-maxsize=500
- --audit-log-maxbackup=3
Scroll down and add a volume under the volumes section:
- hostPath:
    path: /etc/kubernetes/audit
    type: DirectoryOrCreate
  name: audit
Now mount this volume by adding the following data under the volumeMounts section:
- mountPath: /etc/kubernetes/audit
  name: audit
That’s all you need to do in order to configure audit logging. Since you have modified the kube-apiserver manifest, your kube-apiserver pod will be recreated. Once the pod is up and running, execute the following command to create a service account.
kubectl create sa test
This API request will be logged in the audit log file (/etc/kubernetes/audit/audit.log), and you’ll see a couple of entries like this:
{
	"kind": "Event",
	"apiVersion": "audit.k8s.io/v1",
	"level": "RequestResponse",
	"auditID": "a6029022-4ff0-4c54-97ed-4099d0ca1923",
	"stage": "RequestReceived",
	"requestURI": "/api/v1/namespaces/default/serviceaccounts?fieldManager=kubectl-create",
	"verb": "create",
	"user": {
		"username": "kubernetes-admin",
		"groups": ["system:masters", "system:authenticated"]
	},
	"sourceIPs": ["172.31.22.88"],
	"userAgent": "kubectl/v1.23.6 (linux/amd64) kubernetes/ad33385",
	"objectRef": {
		"resource": "serviceaccounts",
		"namespace": "default",
		"apiVersion": "v1"
	},
	"requestReceivedTimestamp": "2022-07-31T08:36:48.679291Z",
	"stageTimestamp": "2022-07-31T08:36:48.679291Z"
}
and
{
	"kind": "Event",
	"apiVersion": "audit.k8s.io/v1",
	"level": "RequestResponse",
	"auditID": "a6029022-4ff0-4c54-97ed-4099d0ca1923",
	"stage": "ResponseComplete",
	"requestURI": "/api/v1/namespaces/default/serviceaccounts?fieldManager=kubectl-create",
	"verb": "create",
	"user": {
		"username": "kubernetes-admin",
		"groups": ["system:masters", "system:authenticated"]
	},
	"sourceIPs": ["172.31.22.88"],
	"userAgent": "kubectl/v1.23.6 (linux/amd64) kubernetes/ad33385",
	"objectRef": {
		"resource": "serviceaccounts",
		"namespace": "default",
		"name": "test",
		"apiVersion": "v1"
	},
	"responseStatus": {
		"metadata": {},
		"code": 201
	},
	"requestObject": {
		"kind": "ServiceAccount",
		"apiVersion": "v1",
		"metadata": {
			"name": "test",
			"creationTimestamp": null
		}
	},
	"responseObject": {
		"kind": "ServiceAccount",
		"apiVersion": "v1",
		"metadata": {
			"name": "test",
			"namespace": "default",
			"uid": "d6ea858a-206d-4b4a-aca0-499e22f00729",
			"resourceVersion": "1676",
			"creationTimestamp": "2022-07-31T08:36:48Z"
		}
	},
	"requestReceivedTimestamp": "2022-07-31T08:36:48.679291Z",
	"stageTimestamp": "2022-07-31T08:36:48.684377Z",
	"annotations": {
		"authorization.k8s.io/decision": "allow",
		"authorization.k8s.io/reason": ""
	}
}
If you check the auditID, it is the same for both the events(a6029022-4ff0-4c54-97ed-4099d0ca1923) since both the entries belong to the same event. The first entry is for the RequestReceived stage, and the second one is for the ResponseComplete stage. With this data, you can easily figure out what the request was and who made this request by looking at sourceIPs, username, requestURI, responseStatus, and responseObject fields.
In the audit policy, if you change the audit level from RequestResponse to MetaData, you will not see requestObject and responseObject fields, and if the audit level is set to Request, then there will be a requestObject field, but the responseObject field won’t be logged.
Going back to our event data, HTTP Status 201 in the responseStatus field indicates that as a result of the HTTP POST request, one or more new resources have been successfully created on the server, which is a service account in this case. If a user who doesn’t have access to create a service account tries to create a service account, you’ll see an entry like this in the audit log:
{
	"kind": "Event",
	"apiVersion": "audit.k8s.io/v1",
	"level": "RequestResponse",
	"auditID": "605e41ff-394a-4b8d-bd32-86ffa984d55a",
	"stage": "RequestReceived",
	"requestURI": "/api/v1/namespaces/default/serviceaccounts?fieldManager=kubectl-create",
	"verb": "create",
	"user": {
		"username": "myuser",
		"groups": ["Dev", "system:authenticated"]
	},
	"sourceIPs": ["172.31.22.88"],
	"userAgent": "kubectl/v1.23.6 (linux/amd64) kubernetes/ad33385",
	"objectRef": {
		"resource": "serviceaccounts",
		"namespace": "default",
		"apiVersion": "v1"
	},
	"requestReceivedTimestamp": "2022-07-31T09:00:44.262246Z",
	"stageTimestamp": "2022-07-31T09:00:44.262246Z"
}
and
{
	"kind": "Event",
	"apiVersion": "audit.k8s.io/v1",
	"level": "RequestResponse",
	"auditID": "605e41ff-394a-4b8d-bd32-86ffa984d55a",
	"stage": "ResponseComplete",
	"requestURI": "/api/v1/namespaces/default/serviceaccounts?fieldManager=kubectl-create",
	"verb": "create",
	"user": {
		"username": "myuser",
		"groups": ["Dev", "system:authenticated"]
	},
	"sourceIPs": ["172.31.22.88"],
	"userAgent": "kubectl/v1.23.6 (linux/amd64) kubernetes/ad33385",
	"objectRef": {
		"resource": "serviceaccounts",
		"namespace": "default",
		"apiVersion": "v1"
	},
	"responseStatus": {
		"metadata": {},
		"status": "Failure",
		"reason": "Forbidden",
		"code": 403
	},
	"responseObject": {
		"kind": "Status",
		"apiVersion": "v1",
		"metadata": {},
		"status": "Failure",
		"message": "serviceaccounts is forbidden: User \"myuser\" cannot create resource \"serviceaccounts\" in API group \"\" in the namespace \"default\"",
		"reason": "Forbidden",
		"details": {
			"kind": "serviceaccounts"
		},
		"code": 403
	},
	"requestReceivedTimestamp": "2022-07-31T09:00:44.262246Z",
	"stageTimestamp": "2022-07-31T09:00:44.274511Z",
	"annotations": {
		"authorization.k8s.io/decision": "forbid",
		"authorization.k8s.io/reason": ""
	}
}
This event tells you that a user named myuser tried to create a service account and the request was denied due to insufficient permission.
Since these records are JSON formatted, you can use the jq tool to search the log entries with commands like these:
tail -f  /etc/kubernetes/audit/audit.log   | jq '.| select(.responseStatus.code | contains(403) )'
tail -f  /etc/kubernetes/audit/audit.log   | jq '.| select(.user.username | contains("myuser") )'
Best Practices For Kubernetes Auditing
In a production environment, you need to consider some best practices for Kubernetes Auditing. This includes:
- Create a comprehensive auditing policy based on your logging requirements
- Use webhook backends to send audit data to remote endpoints instead of storing logs on disk
- Control access to audit data so that it can’t be tampered with
- Configure alerts and visualization based on the audit logs so that you get informed about important events, like deletion of secrets etcetera
Final Thoughts
Auditing is a very important part of Kubernetes cluster security which gives you visibility about the events happening in your cluster and helps run a properly configured and secure cluster. In this article, you've learned about what Kubernetes Auditing is, why it is important, and how to configure it.
Security is a never-ending process, and there is always scope for further optimization and improvement. The information presented in this article sets you out on a journey towards securing your Kubernetes Cluster for you to explore it further.
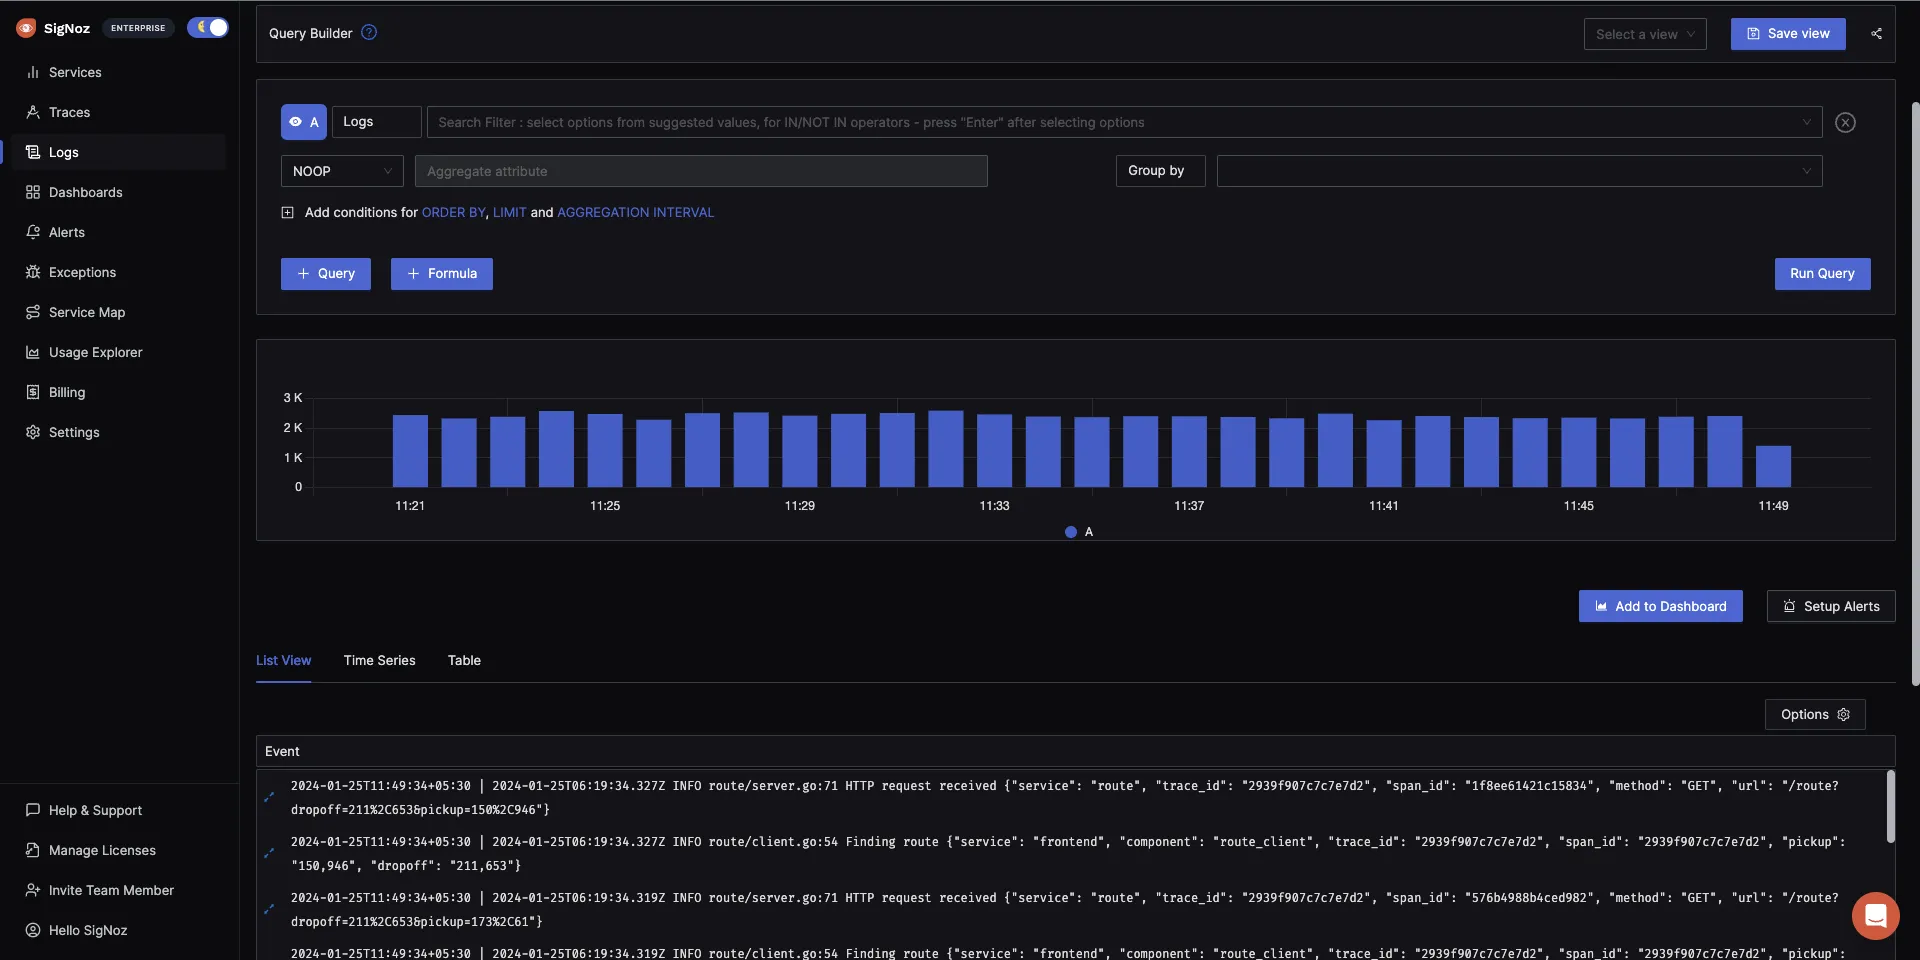
If you're using Kubernetes in production, you need an effective log management tool to monitor your system's health and performance. Kubernetes provides us with a smarter way to manage our resources for scaling cloud-native applications on demand. You need to monitor your Kubernetes resources effectively. If you want to dive deeper into Kubernetes monitoring, you can check out SigNoz - an open source APM and observability tool.
SigNoz uses a columnar database - ClickHouse, for storing logs efficiently. Big companies like Uber and Cloudflare have shifted from Elasticsearch to ClickHouse for storing their log data.
Getting started with SigNoz
SigNoz Cloud is the easiest way to run SigNoz. Sign up for a free account and get 30 days of unlimited access to all features.

You can also install and self-host SigNoz yourself since it is open-source. With 24,000+ GitHub stars, open-source SigNoz is loved by developers. Find the instructions to self-host SigNoz.
You can also check out the documentation for logs here.
But logs are just one aspect of getting insights from your software systems. Modern applications are complex distributed systems. For debugging performance issues, you need to make your systems observable. Logs, when combined with metrics and traces form an observability dataset that can help you debug performance issues quickly.
SigNoz can help you monitor your application by collecting all types of telemetry data. It correlates all your telemetry data(logs, metrics, and traces) into a single suite of monitoring. It is built to support OpenTelemetry natively. OpenTelemetry is becoming the world standard for instrumenting cloud-native applications.
You can check out SigNoz GitHub repo:
Read the following blog to learn how to monitor your Kubernetes cluster with SigNoz:
