Kubernetes Events Monitoring with OpenTelemetry | Complete Tutorial
Events in Kubernetes are objects that provide insights into the state changes within the Kubernetes cluster. Kubernetes events monitoring is critical to provide real-time insights into the operational state of a Kubernetes cluster. It enables administrators to quickly identify and respond to issues, optimize resource allocation, and ensure the smooth and efficient functioning of their containerized applications.
In this tutorial, we cover:
- What Are Kubernetes Events?
- Why Is Kubernetes Events Monitoring Important?
- Collecting Kubernetes Events with OpenTelemetry
- Events
- Objects
- Prerequisites
- Setting up the OpenTelemetry Collector
- Monitoring with Signoz Dashboard
- Conclusion
If you want to jump straight into implementation, start with this Prerequisites section.
Analyzing specific events in your Kubernetes cluster is a key component of observability, offering deep insights into correlations between cluster events for faster issue resolution.
This tutorial will demonstrate using the OpenTelemetry Collector to gather Kubernetes events and forward them to SigNoz.
But before that, let’s learn more about Kubernetes events and why monitoring them is important.
What Are Kubernetes Events?
Kubernetes events are notifications that provide updates on activities within your cluster, such as a pod starting or crashing. They offer a historical view of changes and actions, aiding in tracking and troubleshooting.
These events are the system's means of communicating about important actions or issues, essential for maintaining the health and efficiency of your Kubernetes setup.
Types of Kubernetes Events:
- Failed Events: Indicate an unexpected issue in Kubernetes.
- Evicted Events: Refers to situations where pods are forcibly removed from a node.
- Failed Scheduling Events: Occurs when Kubernetes is unable to schedule a task.
- Volume Events: Related to storage issues within Kubernetes.
- Node Events: Refers to notifications or alerts related to the nodes. For example, node readiness, node failures, etc.
Why Is Kubernetes Events Monitoring Important?
Kubernetes events monitoring is crucial for maintaining real-time awareness of your cluster’s activities. These events serve as a detailed log, flagging changes, pod lifecycle events, and errors. By monitoring these events, you stay informed about the state and activities within your cluster.
Monitoring Kubernetes events is essential for several key reasons:
- Operational Reliability: It provides real-time insights into the health and performance of containerized applications, ensuring smooth operations.
- Detects failed deployments and resource allocation issues.
- Reduces downtime through proactive issue resolution.
- Security and Compliance: Event monitoring is crucial for identifying security breaches and maintaining compliance with regulatory standards.
- Offers real-time detection of suspicious activities.
- Generates audit trails for regulatory compliance.
- Strategic Decision Making: Analyzing event patterns over time aids in resource optimization and scaling decisions.
- Improves user experience by preempting performance bottlenecks.
- Facilitates informed decisions about resource management and scaling.
Collecting Kubernetes Events with OpenTelemetry
OpenTelemetry is a set of APIs, SDKs, libraries, and integrations aiming to standardize the generation, collection, and management of telemetry data(logs, metrics, and traces). It is backed by the Cloud Native Computing Foundation and is the leading open-source project in the observability domain.
The data you collect with OpenTelemetry is vendor-agnostic and can be sent to any backend of your choice. In this tutorial, we will send Kubernetes events to SigNoz, an OpenTelemetry-native APM.
OpenTelemetry acts like a middleman gathering data on pod activities, errors, and resource use. This collected information helps you understand what's happening inside your cluster, making it easier to troubleshoot problems and keep your system running smoothly.
OpenTelemetry provides an OpenTelemetry Collector that can be used as a telemetry-processing system with a lot of flexible configurations to collect and manage telemetry data. We will use an OpenTelemetry Collector to collect Kubernetes events and send them to SigNoz.
How does OpenTelemetry Collector collect data?
A receiver is how data gets into the OpenTelemetry Collector. Receivers are configured via YAML under the top-level receivers tag. There must be at least one enabled receiver for a configuration to be considered valid.
Here’s an example of an otlp receiver:
receivers:
  otlp:
    protocols:
      grpc:
      http:
An OTLP receiver can receive data via gRPC or HTTP using the OTLP format. There are advanced configurations that you can enable via the YAML file.
Here’s a sample configuration for an otlp receiver.
receivers:
  otlp:
    protocols:
      http:
        endpoint: "localhost:4318"
        cors:
          allowed_origins:
            - http://test.com
            # Origins can have wildcards with *, use * by itself to match any origin.
            - https://*.example.com
          allowed_headers:
            - Example-Header
          max_age: 7200
You can find more details on advanced configurations here.
After configuring a receiver, you must enable it. Receivers are enabled via pipelines within the service section. A pipeline consists of a set of receivers, processors, and exporters.
The following is an example pipeline configuration:
service:
  pipelines:
    metrics:
      receivers: [otlp, prometheus]
      exporters: [otlp, prometheus]
    traces:
      receivers: [otlp, jaeger]
      processors: [batch]
      exporters: [otlp, zipkin]
For the purpose of collecting Kubernetes events, OpenTelemetry Collector provides the k8seventsreceiver.
Each OpenTelemetry receiver collects its subset of metrics, logs and/or traces. In this case, Kubernetes Events Receiver only collects logs. Here are the logs collected by Kubernetes Events Receiver that are split into 2 groups: events and objects.
Events
The event data collected by the receiver:
| Metric | Description | Metric Name |
|---|---|---|
| Event Reason | The reason for the event | k8s.event.reason |
| Event Action | The given event action | k8s.event.action |
| Event Start Time | The start time of an event | k8s.event.start_time |
| Event Name | The name of the event | k8s.event.name |
| Event Unique Identifier | The event’s unique identifier | k8s.event.uid |
| Event Count | The total count of events | k8s.event.count |
Objects
The object data collected by the receiver:
| Metric Name | Description | Metric |
|---|---|---|
| Object Kind | The kind (type) of an K8s object | k8s.object.kind |
| Object Name | The name of the object | k8s.object.name |
| Object Unique Identifier | The object’s unique identifier | k8s.object.uid |
| Object Fieldpath | The object’s fieldpath | k8s.object.fieldpath |
| Object API Version | The object’s API version | k8s.object.api_version |
| Object Resource Version | The object’s resource version | k8s.object.resource_version |
Prerequisites
Before getting started, you need to have:
- A SigNoz Cloud account.
- kubectl installed locally.
- A deployed Kubernetes cluster.
Setting up the OpenTelemetry Collector
You will now set up an OpenTelemetry Collector using the k8seventsreceiver and an OTLP Exporter.
Learn more about Kubernetes & OpenTelemetry Collectors on SigNoz.
Step 1: Create a Configuration Map with OTEL Options
Create a ConfigMap with the config for otelcontribcol. Replace the <YOUR SIGNOZ REGION> with your SigNoz’s cloud region, as well as the <YOUR SIGNOZ INGESTION KEY with the token found in the dashboard.
apiVersion: v1
kind: ConfigMap
metadata:
  name: otelcontribcol
  labels:
    app: otelcontribcol
data:
  config.yaml: |
    receivers:
      k8s_events:
        namespaces: [default, my_namespace, platform]
    exporters:
      otlp:
        endpoint: https://ingest.<YOUR SIGNOZ REGION>.signoz.cloud:443
        tls:
          insecure: false
        timeout: 20s # Adjust the timeout value as needed
        headers:
          "signoz-ingestion-key": <YOUR SIGNOZ INGESTION KEY>

    service:
      pipelines:
        logs:
          receivers: [k8s_events]
          exporters: [otlp]
Apply the configuration map by running the following command:
kubectl apply -f configuration-map.yamlStep 2: Create a Service Account
Create a service account that the collector should use.
apiVersion: v1
kind: ServiceAccount
metadata:
  labels:
    app: otelcontribcol
  name: otelcontribcol
Apply the service account to the cluster by running the following command:
kubectl apply -f serivce-account.yamlStep 3: Create a Cluster Role for Role-Based Access Control (RBAC)
Use the below commands to create a ClusterRole with the required permissions and a ClusterRoleBinding to grant the role to the service account created above.
apiVersion: rbac.authorization.k8s.io/v1
kind: ClusterRole
metadata:
  name: otelcontribcol
  labels:
    app: otelcontribcol
rules:
  - apiGroups:
      - ""
    resources:
      - events
      - namespaces
      - namespaces/status
      - nodes
      - nodes/spec
      - pods
      - pods/status
      - replicationcontrollers
      - replicationcontrollers/status
      - resourcequotas
      - services
    verbs:
      - get
      - list
      - watch
  - apiGroups:
      - apps
    resources:
      - daemonsets
      - deployments
      - replicasets
      - statefulsets
    verbs:
      - get
      - list
      - watch
  - apiGroups:
      - extensions
    resources:
      - daemonsets
      - deployments
      - replicasets
    verbs:
      - get
      - list
      - watch
  - apiGroups:
      - batch
    resources:
      - jobs
      - cronjobs
    verbs:
      - get
      - list
      - watch
  - apiGroups:
      - autoscaling
    resources:
      - horizontalpodautoscalers
    verbs:
      - get
      - list
      - watch
Apply the cluster role to the cluster by running the following command:
kubectl apply -f cluster-role.yamlStep 4: Create a Deployment Manifest
Create a Deployment to deploy the collector.
apiVersion: apps/v1
kind: Deployment
metadata:
  name: otelcontribcol
  labels:
    app: otelcontribcol
spec:
  replicas: 1
  selector:
    matchLabels:
      app: otelcontribcol
  template:
    metadata:
      labels:
        app: otelcontribcol
    spec:
      serviceAccountName: otelcontribcol
      containers:
        - name: otelcontribcol
          image: signoz/otelcontribcol:latest
          args: ["--config", "/etc/config/config.yaml"]
          volumeMounts:
            - name: config
              mountPath: /etc/config
          imagePullPolicy: IfNotPresent
      volumes:
        - name: config
          configMap:
            name: otelcontribcol
Apply the manifest on the cluster by running the following command:
kubectl apply -f deployment.yamlMonitoring with Signoz Dashboard
After deploying the OpenTelemetry Collector, you can access the logs tab in SigNoz to access logs of your Kubernets events.
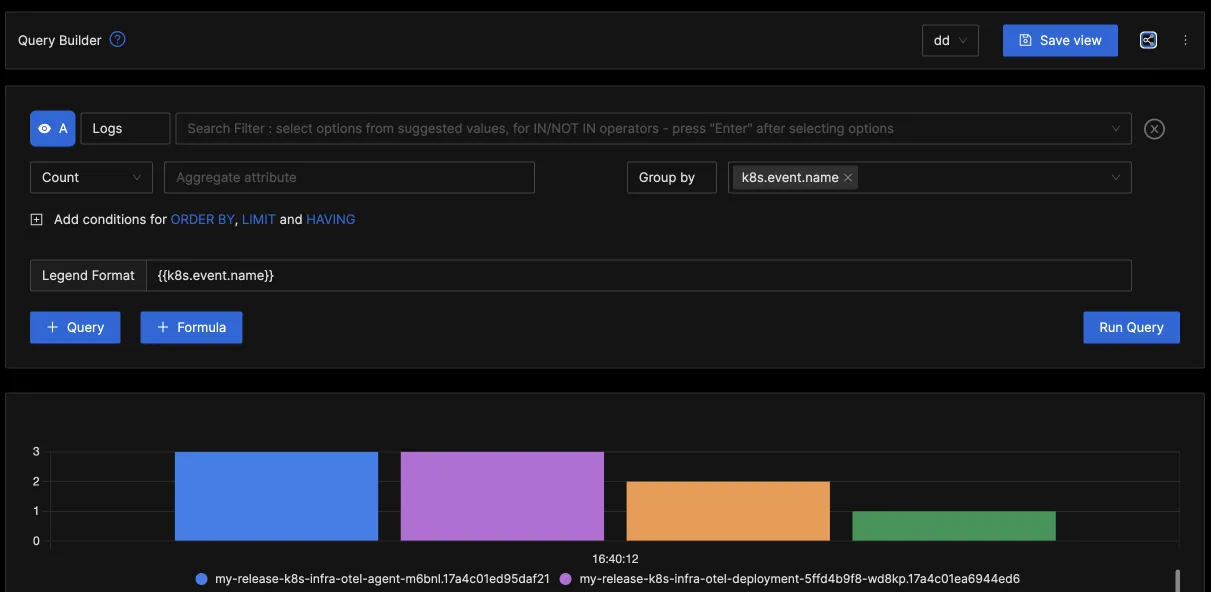
You can also create dashboards from your logs by following the below steps:
- Navigate to the SigNoz Cloud.
- On the left side panel, select
Dashboards. - Press
+ New Dashboard. - Press
Import JSON. - Paste the JSON from the following github repo. The JSON contains all the panels and their layout order.
- Press
Load JSON.
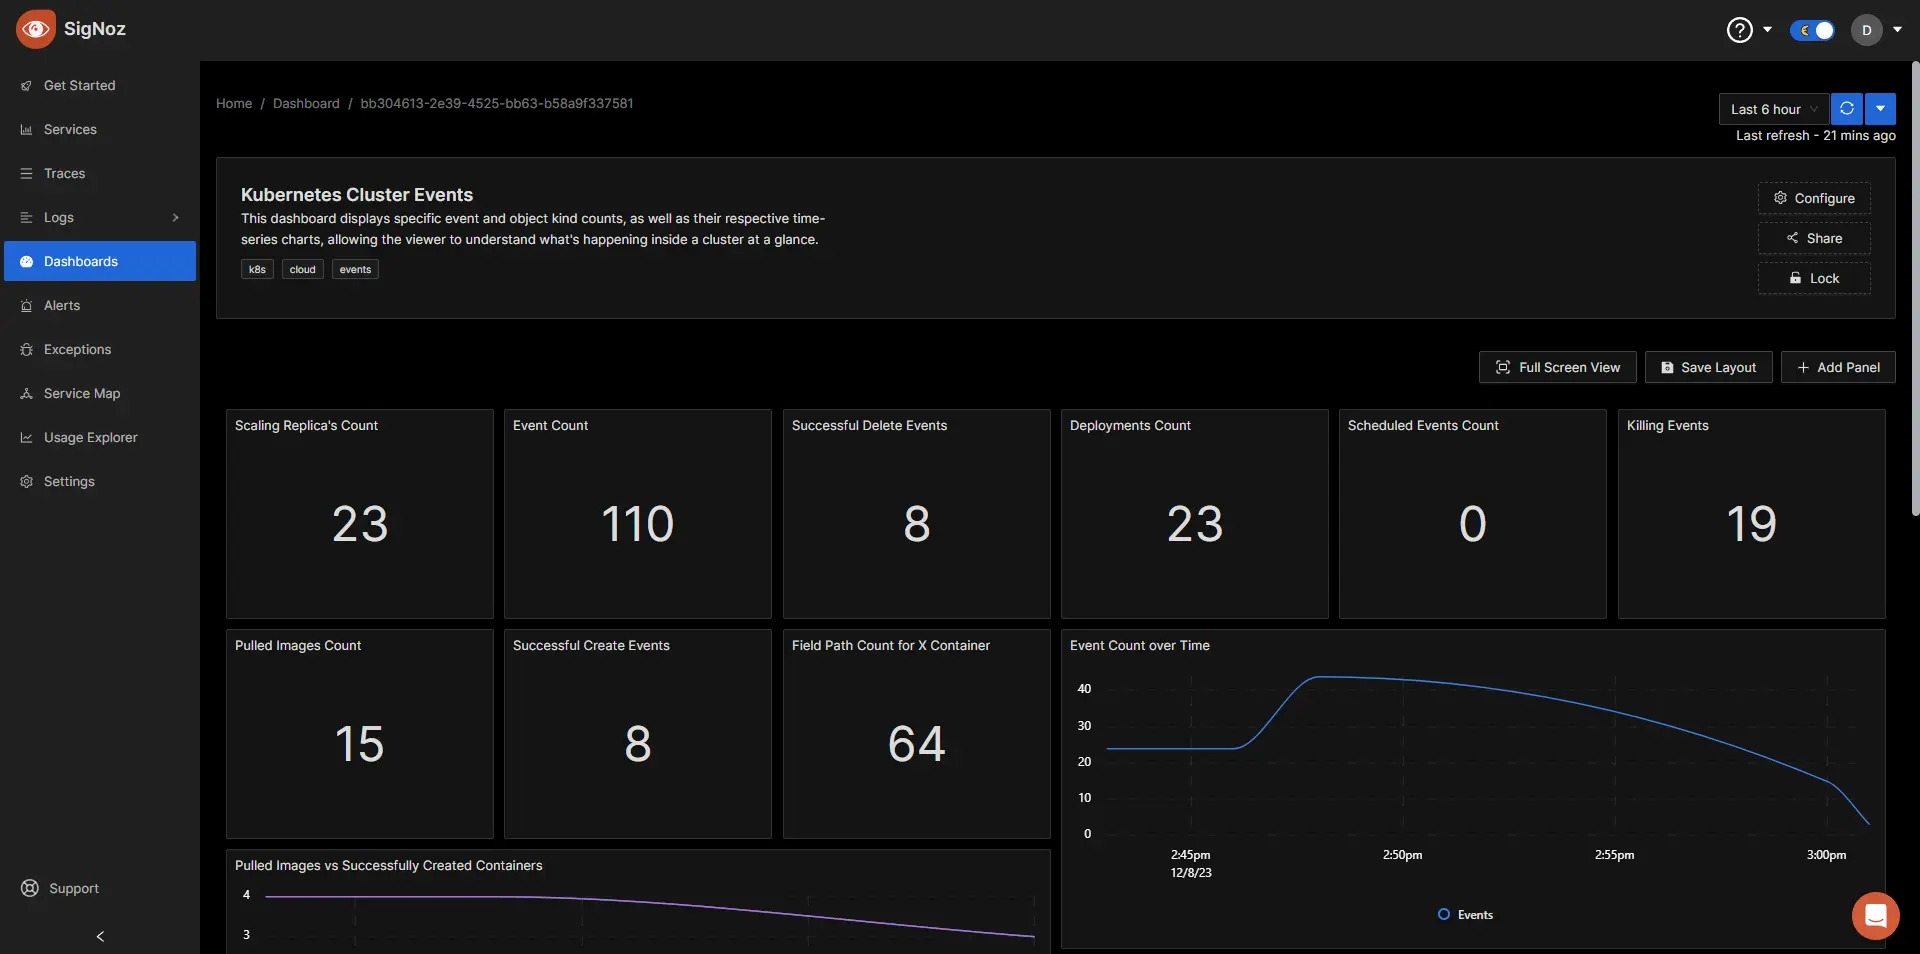
Now, you have a dashboard with most of the metrics sent by the receiver, with some time-series charts to ehance the visual experience.
Conclusion
In this tutorial, you installed an OpenTelemetry Collector to collect Kubernetes events and sent the collected data to SigNoz for monitoring and alerts.
Visit our complete guide on OpenTelemetry Collector to learn more about it. OpenTelemetry is quietly becoming the world standard for open-source observability, and by using it, you can have advantages like a single standard for all telemetry signals, no vendor lock-in, etc.
SigNoz is an open-source OpenTelemetry-native APM that can be used as a single backend for all your observability needs.
Further Reading
