Understanding LLM Observability - Key Insights, Best Practices, & Tools
In the rapidly evolving world of Large Language Models (LLMs), ensuring peak performance and reliability is more critical than ever. This is where the concept of 'LLM Observability' comes into play. It's not just about monitoring outputs; it's about gaining deep insights into the internal workings of these complex systems.
This comprehensive guide delves into the core concepts, best practices, and tools that define LLM Observability. You'll learn how to gain deep insights into your LLM applications, address common issues, and implement effective monitoring strategies to elevate your AI projects.
For those eager to dive into practical implementation, you can jump directly to the section on implementing LLM Observability with SigNoz and OpenTelemetry.
What is LLM Observability and Why It Matters
LLM Observability refers to the end-to-end visibility into the performance and behavior of Large Language Model applications. It extends beyond traditional machine learning monitoring by focusing on the unique aspects of LLMs, such as prompt engineering, retrieval-augmented generation, and fine-tuning processes.
Why does LLM Observability matter?
LLMs are intricate systems where countless processes occur simultaneously. Without proper observability, understanding these internal dynamics becomes a guessing game, leading to inefficiencies and potential errors.
Consider these key points:
- Complexity Management: LLMs involve intricate chains of operations; observability helps you understand and optimize each step.
- Quality Assurance: It enables you to detect and mitigate issues like hallucinations or inaccuracies in LLM outputs.
- Performance Optimization: By monitoring key metrics, you can identify bottlenecks and improve response times.
- Cost Control: Observability allows you to track and optimize token usage, directly impacting operational costs.
- Resource Utilization and Efficiency: Identifies computational demands and inefficiencies, optimizing resource allocation to enhance cost-effectiveness and system throughput.
- Model Performance and Accuracy Insights: Provides critical data on LLM accuracy and processing capabilities, guiding refinements for superior model reliability and performance.
- Real-time Performance Tracking: Enables instantaneous feedback on LLM operations, ensuring peak system efficiency and adaptation to varying performance requirements.
- Issue Detection and Troubleshooting: Facilitates quick identification and resolution of complex issues within LLM infrastructures, reducing downtime and improving user experience.

The Five Pillars of LLM Observability
To implement effective LLM Observability, focus on these five crucial pillars:
1. LLM Evaluation
LLM evaluation involves assessing the quality and accuracy of the model's outputs. Key aspects include:
- Automated Metrics: Implement automated scoring systems using metrics like BLEU or ROUGE for text quality assessment.
- Human-in-the-Loop Feedback: Incorporate mechanisms for human evaluators to rate and provide feedback on LLM responses.
- Consistency Checks: Monitor the consistency of LLM outputs across similar inputs to detect potential issues.
Example evaluation workflow:
- Generate responses to a set of test prompts.
- Apply automated metrics to score outputs.
- Route low-scoring responses for human review.
- Aggregate feedback to identify patterns and areas for improvement.
2. Traces and Spans
Tracing in LLM applications provides visibility into the entire request-response cycle. Key benefits include:
- Performance Insights: Identify bottlenecks in your LLM pipeline by tracking latency across different stages.
- Error Detection: Pinpoint where errors occur in complex LLM chains.
- Resource Utilization: Monitor token usage and compute resources for cost optimization.
Implement tracing by:
- Instrumenting your code to create spans for each significant operation.
- Collecting relevant metadata such as prompt details and token counts.
- Visualizing traces to understand the flow and performance of your LLM application.
3. Retrieval Augmented Generation (RAG)
RAG systems enhance LLM outputs by incorporating external knowledge. Observability for RAG focuses on:
- Retrieval Quality: Monitor the relevance of retrieved information to the given query.
- Integration Efficiency: Assess how well the retrieved information is incorporated into the LLM's response.
- Source Tracking: Keep track of the sources used in generating responses for transparency and fact-checking.
Implement RAG observability by:
- Logging retrieved documents and their relevance scores.
- Comparing LLM outputs with and without RAG to measure impact.
- Tracking the frequency and utility of different knowledge sources.
4. Fine-tuning Observability
When fine-tuning LLMs for specific tasks, observability becomes crucial. Key areas to monitor include:
- Training Metrics: Track loss, accuracy, and other relevant metrics during the fine-tuning process.
- Model Drift: Compare the performance of fine-tuned models against the base model over time.
- Task-Specific Evaluation: Develop and monitor metrics tailored to your specific use case.
Implement fine-tuning observability by:
- Setting up logging for training metrics and model checkpoints.
- Creating a benchmark dataset to evaluate models consistently.
- Implementing A/B testing between different model versions in production.
5. Prompt Engineering Insights
Effective prompt engineering is critical for LLM performance. Observability in this area includes:
- Prompt Effectiveness: Measure how different prompts affect the quality and relevance of LLM outputs.
- Prompt Optimization: Use data-driven approaches to refine and improve prompts over time.
- Version Control: Track changes in prompts and their impact on model performance.
Implement prompt engineering observability by:
- Creating a system to version and track different prompts.
- Measuring the performance of each prompt variant against defined metrics.
- Implementing A/B testing for prompt optimization in live environments.
Common Issues in LLM Applications and How Observability Helps
LLM applications face several challenges that observability can help address:
- Hallucinations and Inaccuracies
- Problem: LLMs may generate false or misleading information.
- Solution: Implement fact-checking mechanisms and track the frequency of detected hallucinations.
- Performance Bottlenecks
- Problem: Slow response times due to inefficient processing.
- Solution: Use tracing to identify time-consuming operations and optimize accordingly.
- Cost Management
- Problem: High operational costs due to excessive token usage.
- Solution: Monitor token consumption patterns and implement usage limits or optimizations.
- Security and Privacy Concerns
- Problem: Potential exposure of sensitive information in LLM outputs.
- Solution: Implement content filtering and track instances of potential data leakage.
Best Practices for Implementing LLM Observability
To maximize the benefits of LLM Observability, follow these best practices:
- Define Clear Metrics: Establish key performance indicators (KPIs) specific to your LLM application, such as response quality, latency, and cost per query.
- Implement Comprehensive Logging: Capture detailed logs of LLM interactions, including prompts, raw outputs, and post-processing steps.
- Set Up Real-time Monitoring: Use dashboards and alerting systems to track critical metrics and detect issues promptly.
- Conduct Regular Audits: Perform periodic reviews of your LLM application's performance, security, and compliance with relevant standards.
- Establish Feedback Loops: Create mechanisms for continuous improvement based on observability data and user feedback.
- Integrate with Development Workflow: Incorporate observability checks into your CI/CD pipeline to catch issues early.
- Practice Data-Driven Optimization: Use insights from observability to guide improvements in prompts, model selection, and system architecture.
Tools and Frameworks for LLM Observability
Several tools can help you implement effective LLM Observability:

- SigNoz: A comprehensive open-source APM tool that offers robust LLM monitoring capabilities. It provides end-to-end tracing, metrics, and logs in a single platform, making it an excellent choice for teams looking for a unified observability solution.
- Datadog: Offers comprehensive monitoring solutions with specific features for LLM applications. However, its pricing can be steep for smaller teams or projects.
- Arize AI: Provides specialized tools for ML observability, including LLM-specific metrics. While powerful, it may have a steeper learning curve for those new to ML observability.
- Weights & Biases: Offers experiment tracking and model monitoring capabilities. It's great for research and development, but may lack some production-focused features.
- MLflow: An open-source platform for the complete machine learning lifecycle, including model tracking and evaluation. While versatile, it may require more setup and configuration compared to managed solutions.
When choosing a tool, consider factors such as integration capabilities, scalability, and support for LLM-specific metrics. SigNoz stands out for its balance of features, ease of use, and cost-effectiveness, especially for teams already working with open-source technologies.
Framework and provider guides
SigNoz has step-by-step docs for common LLM stacks. Pick the one that matches your app:
- Providers: OpenAI, Azure OpenAI API, Anthropic API, Amazon Bedrock, Google Gemini, Grok, DeepSeek API, Claude Code.
- Frameworks and SDKs: LangChain/LangGraph, LlamaIndex, LiteLLM, Vercel AI SDK, Pydantic AI, AutoGen, Crew AI, Semantic Kernel, Temporal, LiveKit, Pipecat, Mastra, Agno, Inkeep.
Let's see how we can implement LLM Observability with SigNoz and OpenTelemetry →
Implementing LLM Observability with SigNoz and OpenTelemetry
SigNoz together with OpenTelemetry stands out as a powerful, open-source observability platform that's well-suited for LLM applications.
What is OpenTelemetry?
OpenTelemetry is an open-source, vendor-neutral set of tools, APIs, and SDKs used to create and manage telemetry data (logs, metrics, and traces). Backed by the Cloud Native Computing Foundation, it's the leading project in the observability domain.
Key Benefits for LLM Observability:
- Unified Instrumentation: Simplifies collection of metrics, logs, and traces.
- Vendor Neutrality: Works with various monitoring platforms, allowing easy backend switches.
- Community-Driven: Benefits from wide-ranging contributions, ensuring continuous improvement.
- Customization: Extensible to meet specific needs.
- Future-Proof: Stays current with evolving technology and standards.
OpenTelemetry is well-suited for LLM applications due to its comprehensive approach to telemetry data collection. While the collected data is vendor-agnostic, choosing the right backend for OpenTelemetry is crucial for effective observability.
The data you collect with OpenTelemetry is vendor-agnostic and can be exported to any backend, but which backend is best suited for OpenTelemetry?
OpenTelemetry & SigNoz - The Perfect Combo for LLM Observability
OpenTelemetry does not provide any backend. After generating telemetry data, it needs to be sent to a backend for storage and visualization. SigNoz is an OpenTelemetry-native APM built to support OpenTelemetry from day 1.
SigNoz supports OpenTelemetry semantic conventions and provides visualization for all three distinct types of signals supported by OpenTelemetry. Most popular observability vendors claim that they support OpenTelemetry data, but reality is different in many cases.
SigNoz is also open-source, and if you’re using OpenTelemetry and SigNoz, your entire observability stack will be open-source.
Enough context, now let’s get started with the demo.
Prerequisites
- Langchain App: If you just want to play around to understand SigNoz's capabilities, here’s a sample Langchain application.
- SigNoz Cloud Account
Setting up SigNoz
You need a backend to which you can send the collected data for monitoring and visualization. SigNoz is an OpenTelemetry-native APM that is well-suited for visualizing OpenTelemetry data.
SigNoz Cloud is the easiest way to run SigNoz. Sign up for a free account and get 30 days of unlimited access to all features.

You can also install and self-host SigNoz yourself since it is open-source. With 24,000+ GitHub stars, open-source SigNoz is loved by developers. Find the instructions to self-host SigNoz.
Approaches to Instrumenting a LangChain LLM App
- Manual Instrumentation using OpenTelemetry SDK: Allows for granular control and insights but is time-consuming to implement.
- Automated Instrumentation using OpenLLMetry SDK: In addition to automatic instrumentation of API and DB calls, this version of the SDK instruments Langchain App, like OpenAI calls and Vector DB retrievals. A big shoutout to our friends at Traceloop for building OpenLLMetry.
Manual Instrumentation Using OpenTelemetry SDK
OpenTelemetry is an open-source observability framework for cloud-native software. It provides tools for capturing traces, metrics, and logs, which are essential for understanding the behavior of your application. Below is a guide to manually integrate OpenTelemetry into an LLM application.
Installation: To integrate OpenTelemetry into your LLM app, start by installing the necessary SDK. You can do this with the following command:
pip install opentelemetry-sdk
Setup: Environment Variables to set to send data to SigNoz:
export OTEL_EXPORTER_OTLP_PROTOCOL=grpc
export OTEL_EXPORTER_OTLP_ENDPOINT="ingest.{region}.signoz.cloud"
export OTEL_EXPORTER_OTLP_HEADERS="signoz-ingestion-key=<SIGNOZ_INGESTION_KEY>"
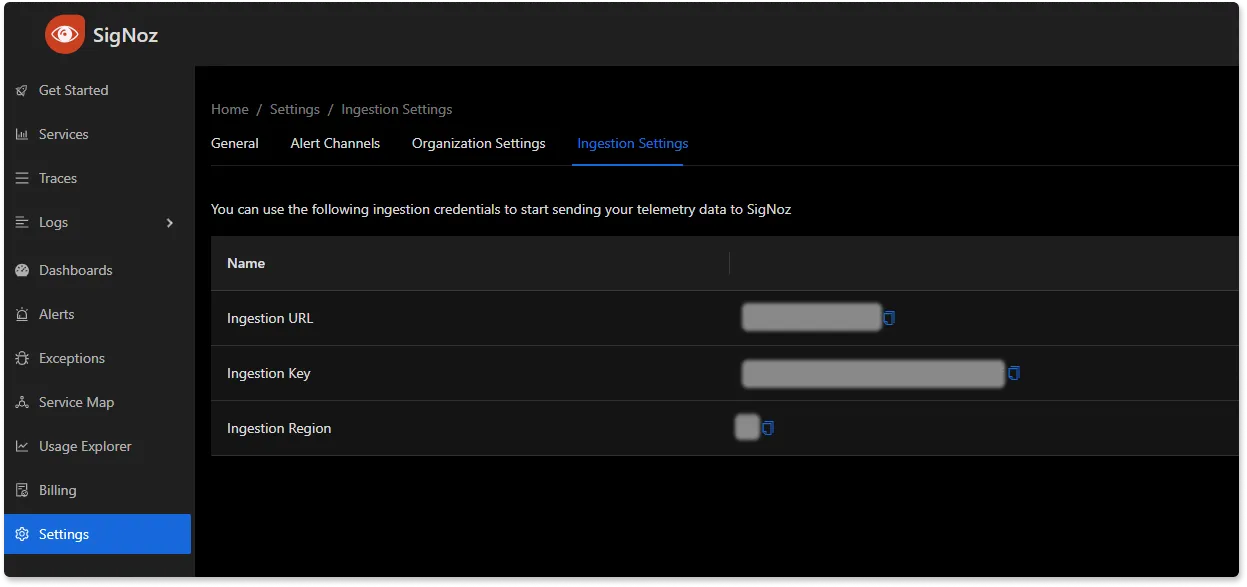
You can get the ingestion details for your SigNoz cloud account under settings —> ingestion settings.
Integration: Once you have the SDK, you'll need to incorporate the OpenTelemetry libraries into your app's codebase. This involves creating traces and spans that represent the operations your app performs. Here's a snippet demonstrating how to create a span around an API request to the OpenAI service:
from opentelemetry import trace
from opentelemetry.trace import SpanKind

tracer = trace.get_tracer(__name__)

with tracer.start_span("OpenAI_API_Request", kind=SpanKind.CLIENT) as span:
    # Code to perform the API request goes here
    response = perform_api_request()
    span.set_attribute("response.status_code", response.status_code)
In this code block, we're creating a new span with the start_span method. The span is named "OpenAI_API_Request", indicating the action it represents. Within the span's context, we make the API request and then record the response status code as an attribute of the span. This level of granularity allows for in-depth monitoring and troubleshooting.
Automatic Instrumentation using OpenLLMetry
While manual instrumentation provides fine-grained control, it can be time-consuming. That's where automatic instrumentation steps in. Our friends at Traceloop have built OpenLLMetry, an OpenTelemetry library to instrument Langchain applications quickly. For our purposes, let's imagine that OpenLLMetry is OpenTelemetry with inbuilt capabilities to instrument components from the LLM ecosystem.
Installation: To get started with OpenLLMetry, install the SDK and initialize it within your application:
pip install traceloop-sdk
Setup: Set the following environment variables or add them to a dotenv file.
export TRACELOOP_BASE_URL=ingest.{region}.signoz.cloud
export TRACELOOP_HEADERS="signoz-ingestion-key=<SIGNOZ_INGESTION_KEY>"
Initialize the SDK at the start of your application entry point.
from traceloop import Traceloop

Traceloop.init(app_name="Signoz PDF Chat")
Setting Up Properties: With OpenLLMetry, you can set association properties that help in correlating traces with specific users or sessions. Here's how you might do it:
import uuid
from traceloop import Traceloop

@app.post('/chat')
async def ask(question: str, user: User):
	Traceloop.set_association_properties({
	    "user_id": user.username,
	    "chat_id": str(uuid.uuid4()),
	})
  chain = load_qa_chain(ChatOpenAI(temperature=0), chain_type="stuff")
	return chain.run(input_documents=docs, question=query)
This code associates the current tracing context with a user ID and a unique chat session ID. This kind of metadata is invaluable for debugging issues that are user or session-specific.
Sample Code
import uuid
from langchain.document_loaders import PyPDFLoader
from langchain.vectorstores import Chroma
from langchain.embeddings.openai import OpenAIEmbeddings
from langchain.document_loaders import UnstructuredPDFLoader

from langchain.chat_models import ChatOpenAI
from langchain.chains.question_answering import load_qa_chain
from traceloop.sdk import Traceloop
from dotenv import load_dotenv
load_dotenv()

Traceloop.init(app_name="Signoz PDF Chat")

loader = UnstructuredPDFLoader("book.pdf")
pages = loader.load_and_split()
embeddings = OpenAIEmbeddings()
docsearch = Chroma.from_documents(pages, embeddings).as_retriever()

queries = [
    "What is the name of the author?",
    "What is the name of the book?",
    "Who is Rich Dad?",
    "Who is Poor Dad?",
    "Give me a summary of the book?"
    "What is the 3 key takeaways from the book?"
]
for queryroot in queries:
    for querysuffix in enumerate([' Concise Answer', 'Answer in (~250 words)', 'Long Answer (~750 words)']):
        # Sets Properties to be used in the dashboard
				Traceloop.set_association_properties({ "user_id": "John McClane", "chat_id": str(uuid.uuid4()) })
        query = queryroot + querysuffix
        docs = docsearch.get_relevant_documents(query)
        chain = load_qa_chain(ChatOpenAI(temperature=0), chain_type="stuff")
        output = chain.run(input_documents=docs, question=query)
        print(output)
For more information and to enrich the workflow with names other than the function name, refer to OpenLLMetry documentation.
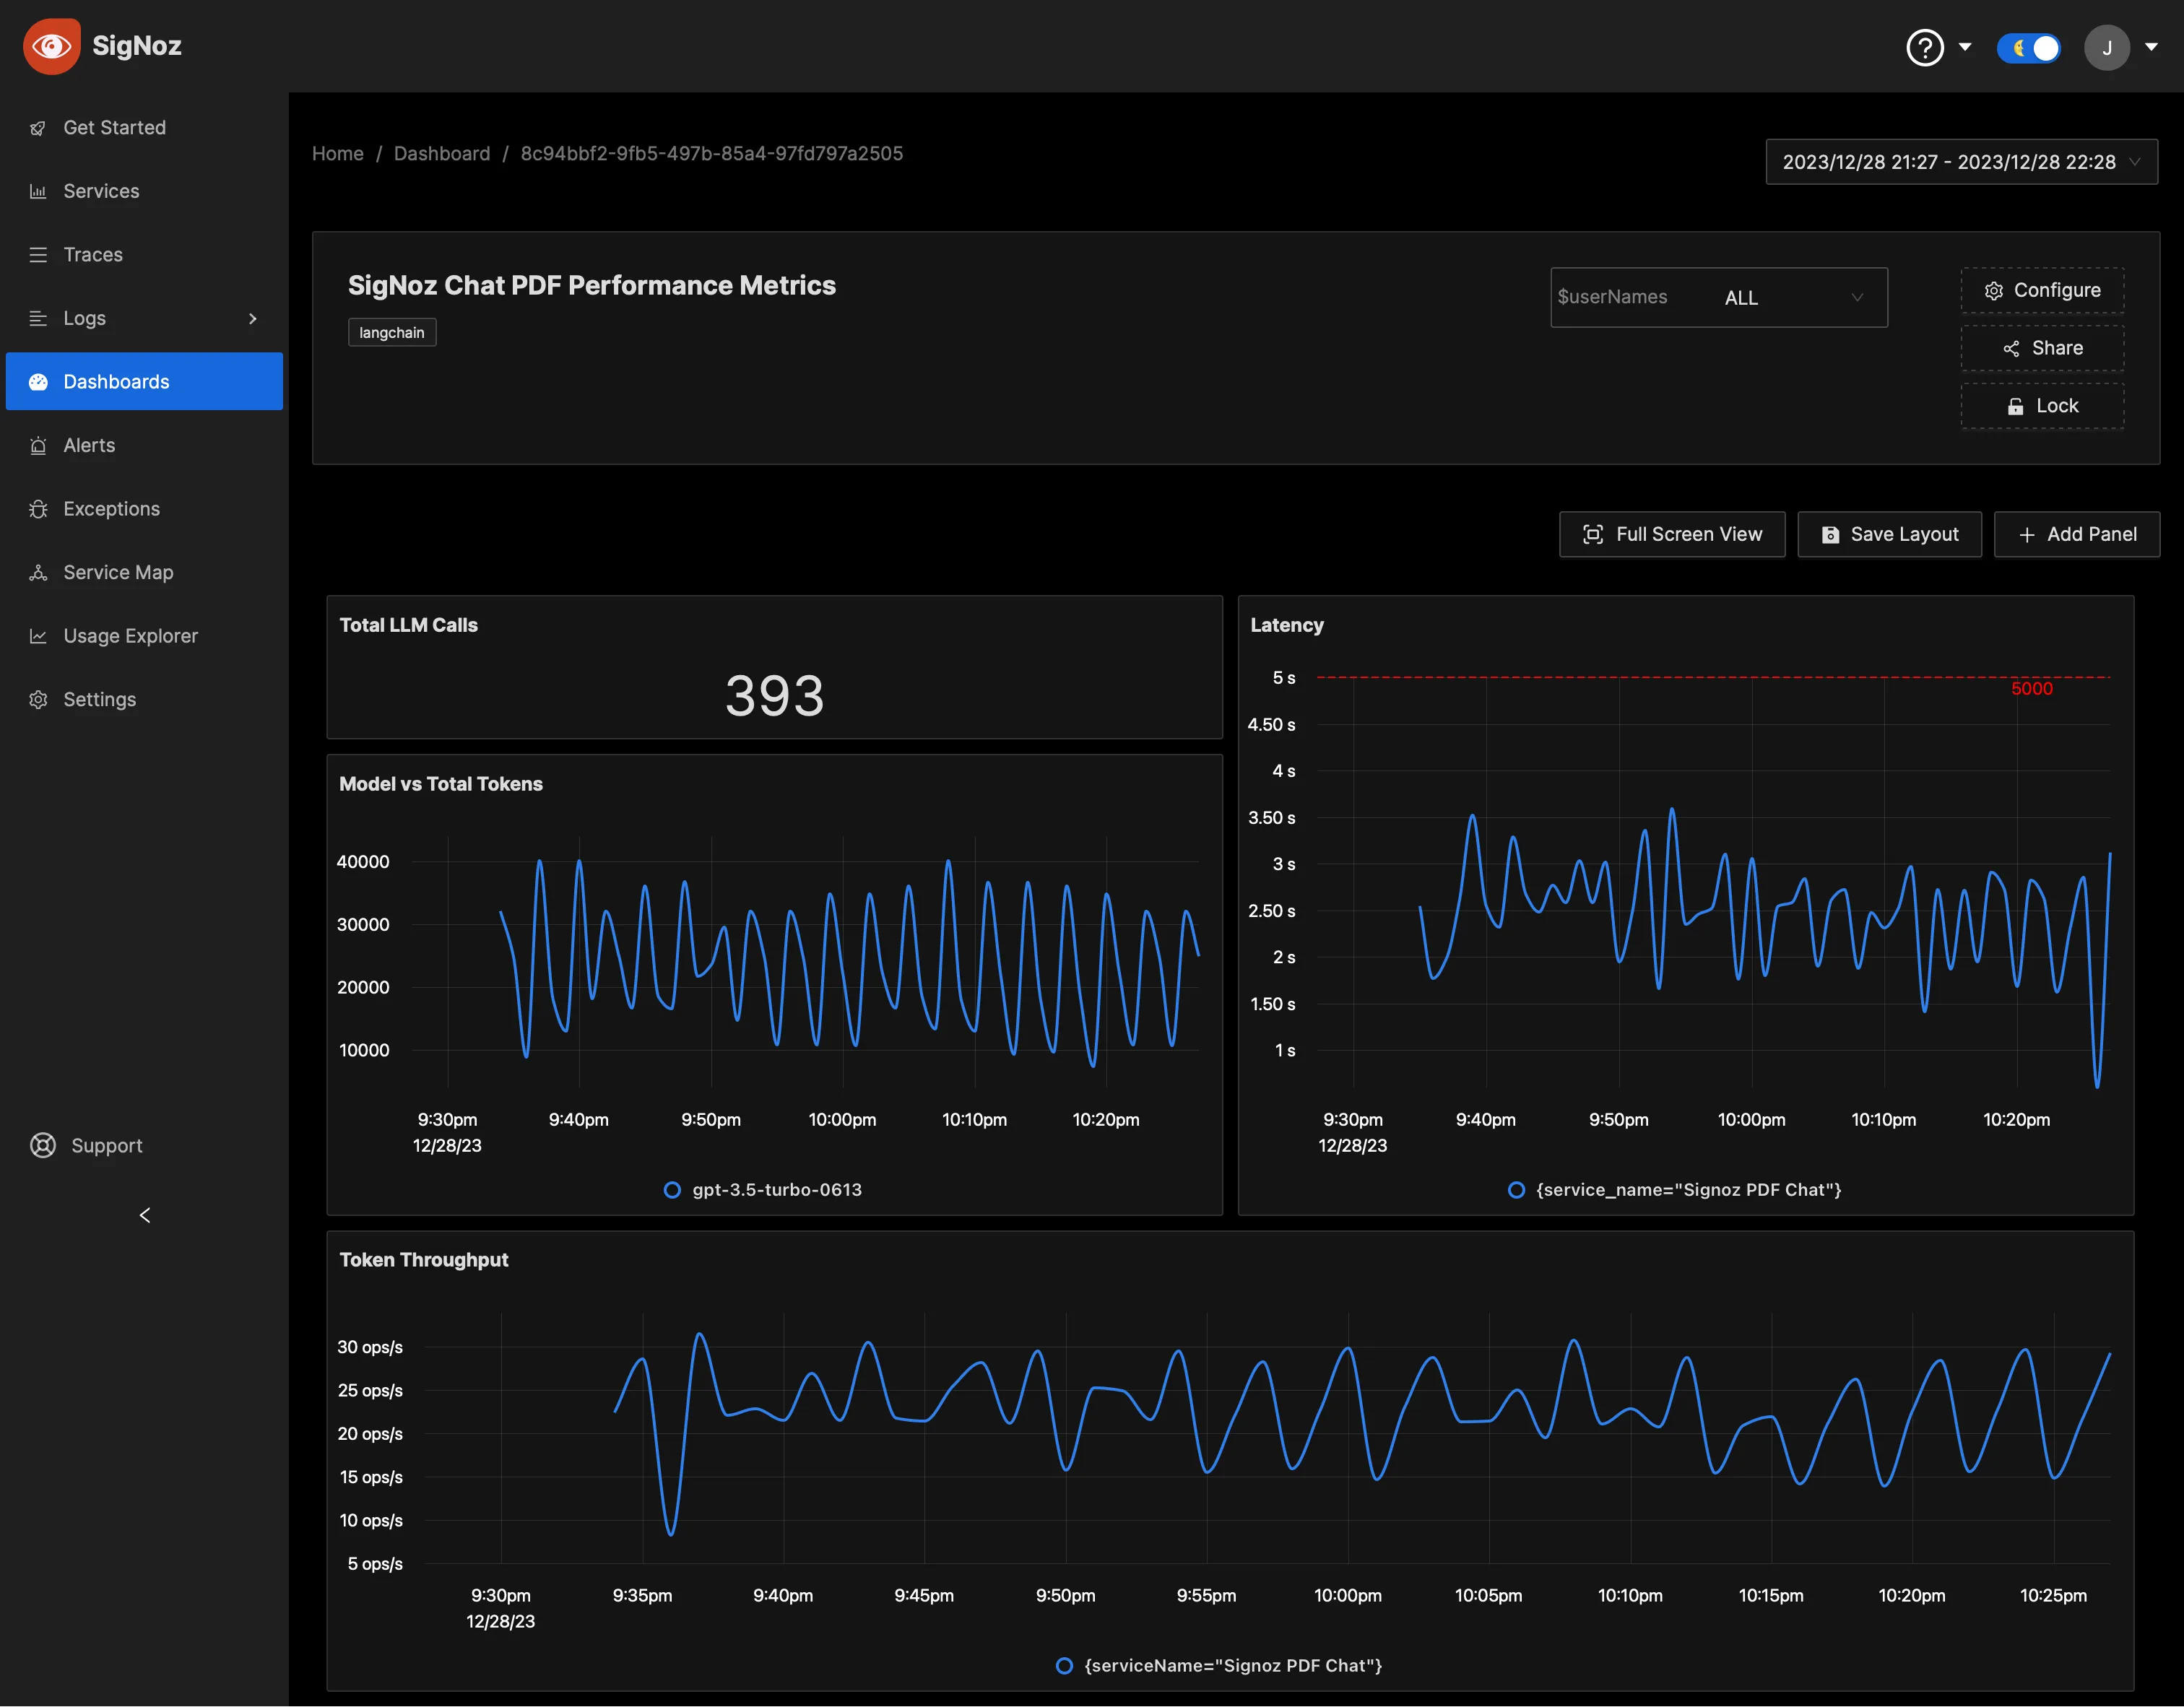
Monitoring with SigNoz Dashboard
Once the above setup is done, you will be able to access the metrics in the SigNoz dashboard. You can go to the Dashboards tab and try adding a new panel. You can learn how to create dashboards in SigNoz here.
You can easily create charts with query builder in SigNoz. Here are the steps to add a new panel to the dashboard.
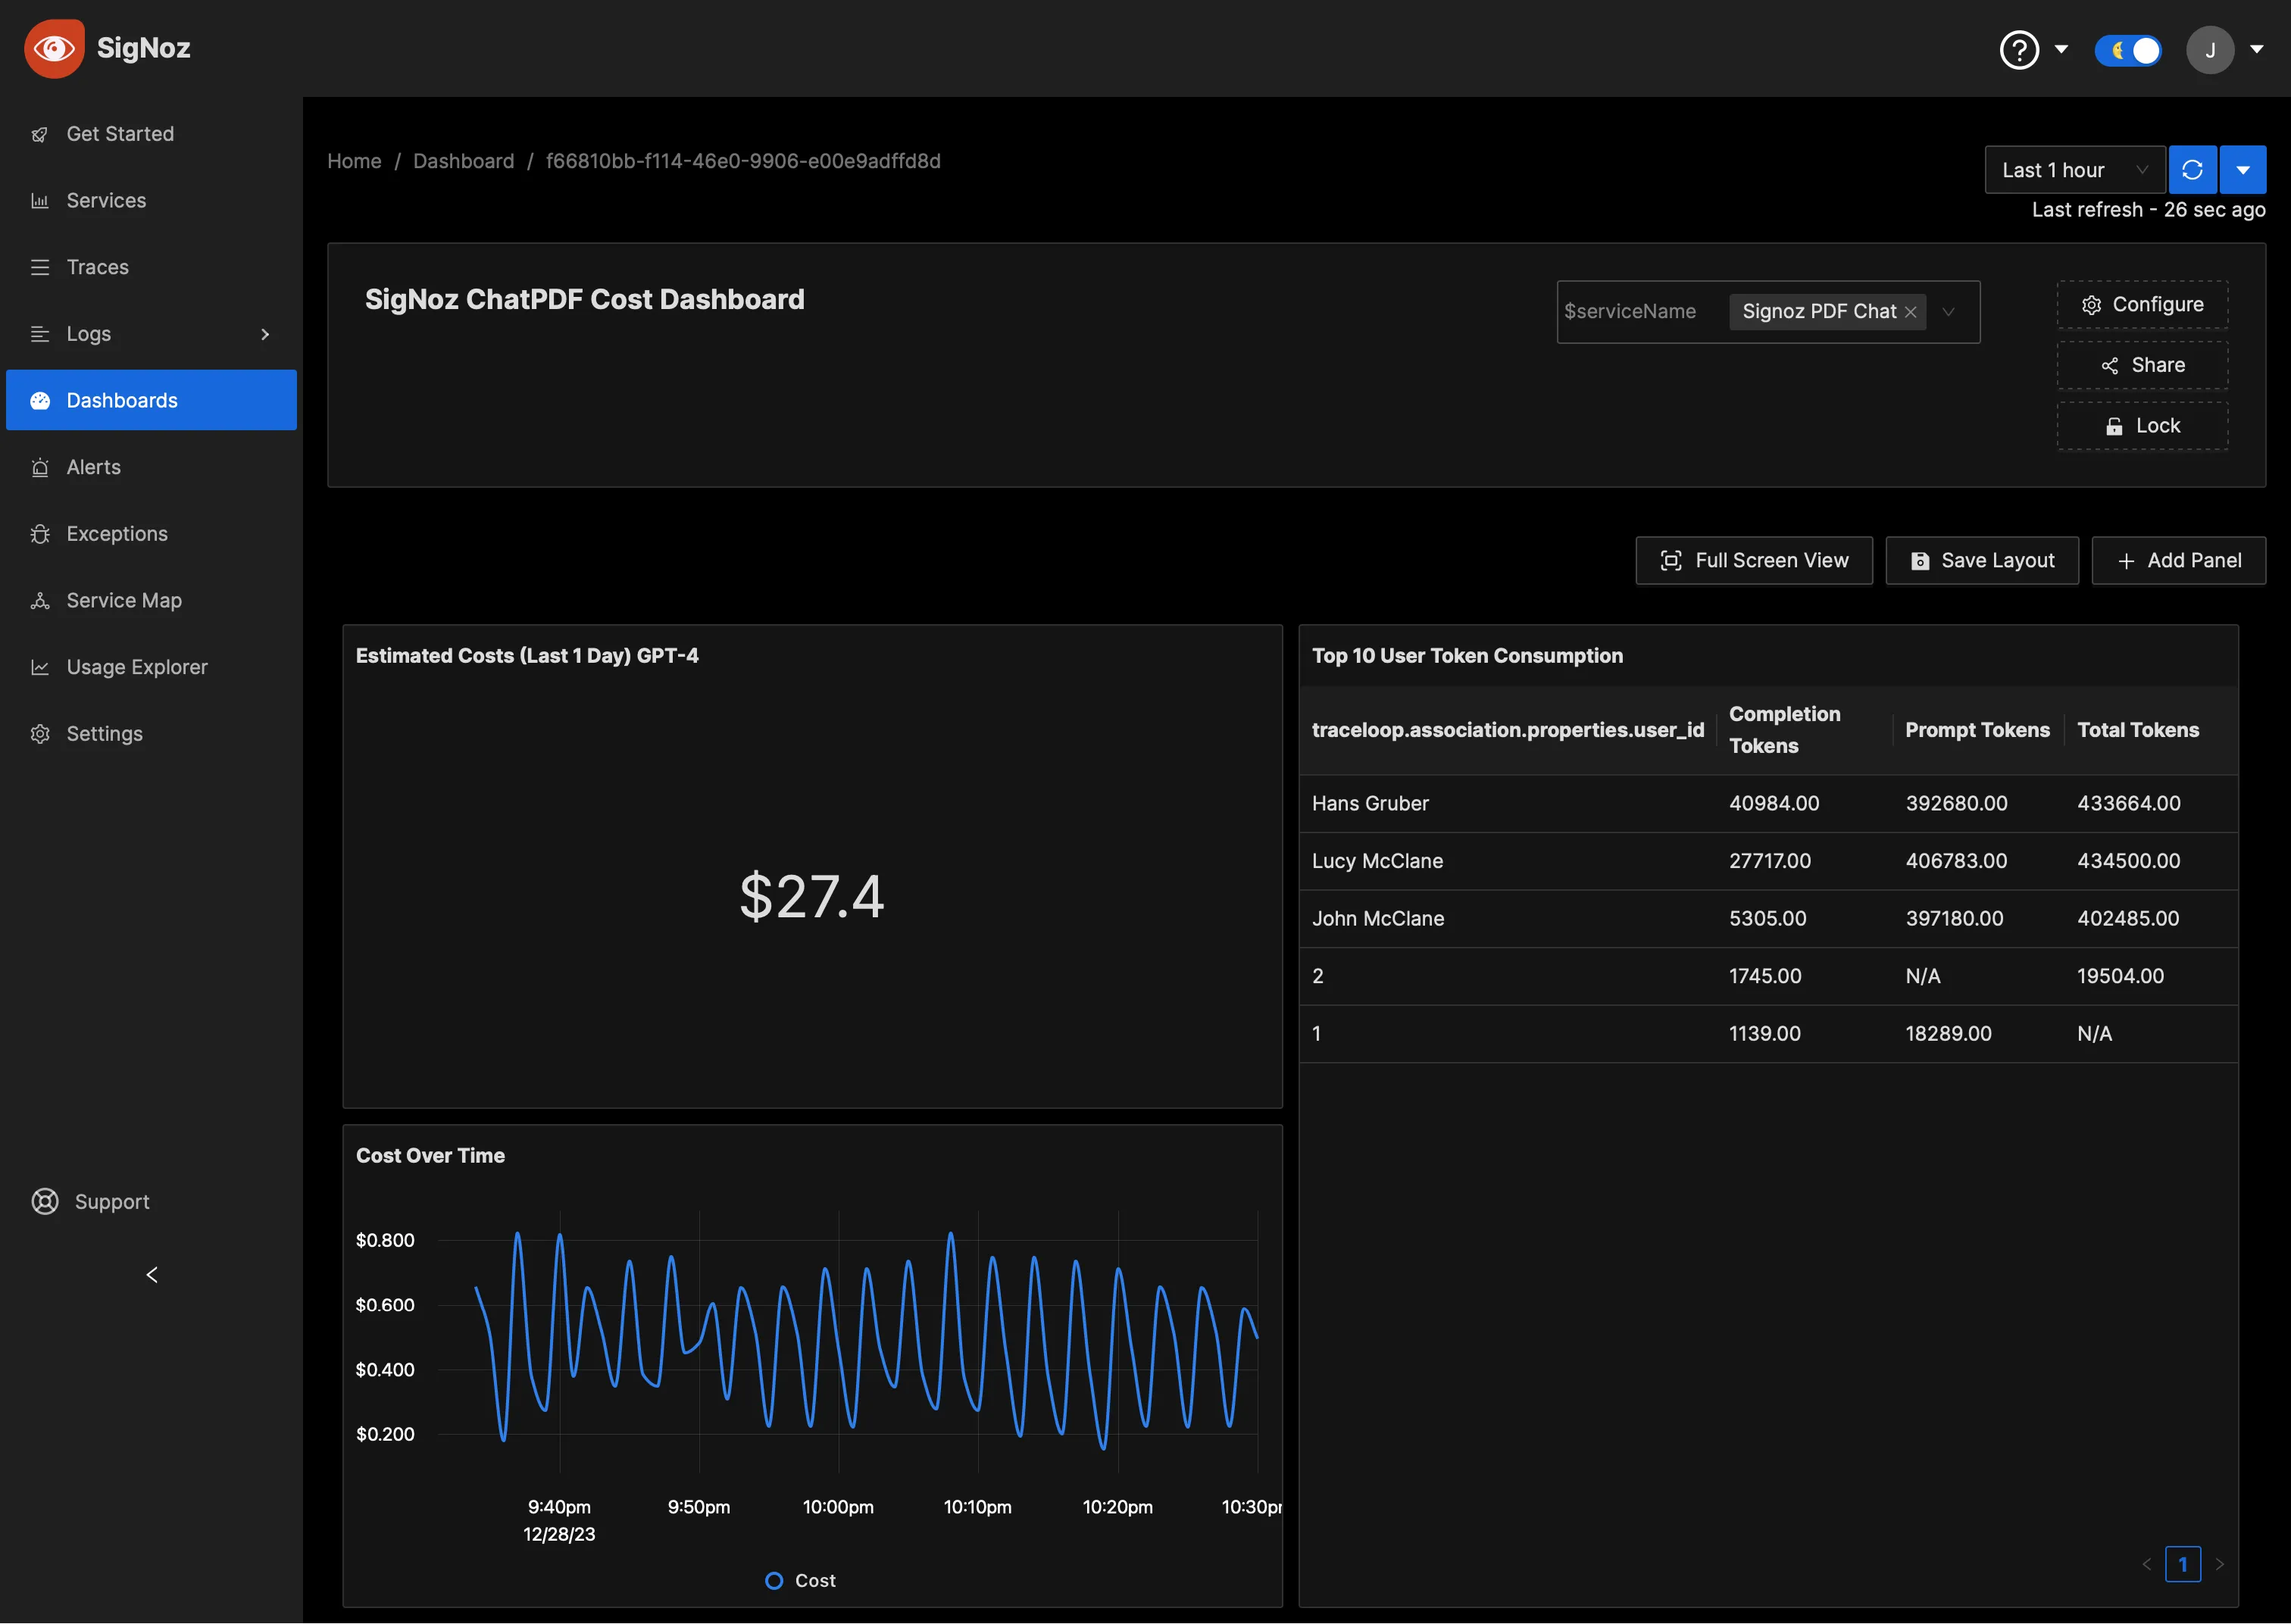
You can also create dashboards to monitor the cost of running the Langchain application.
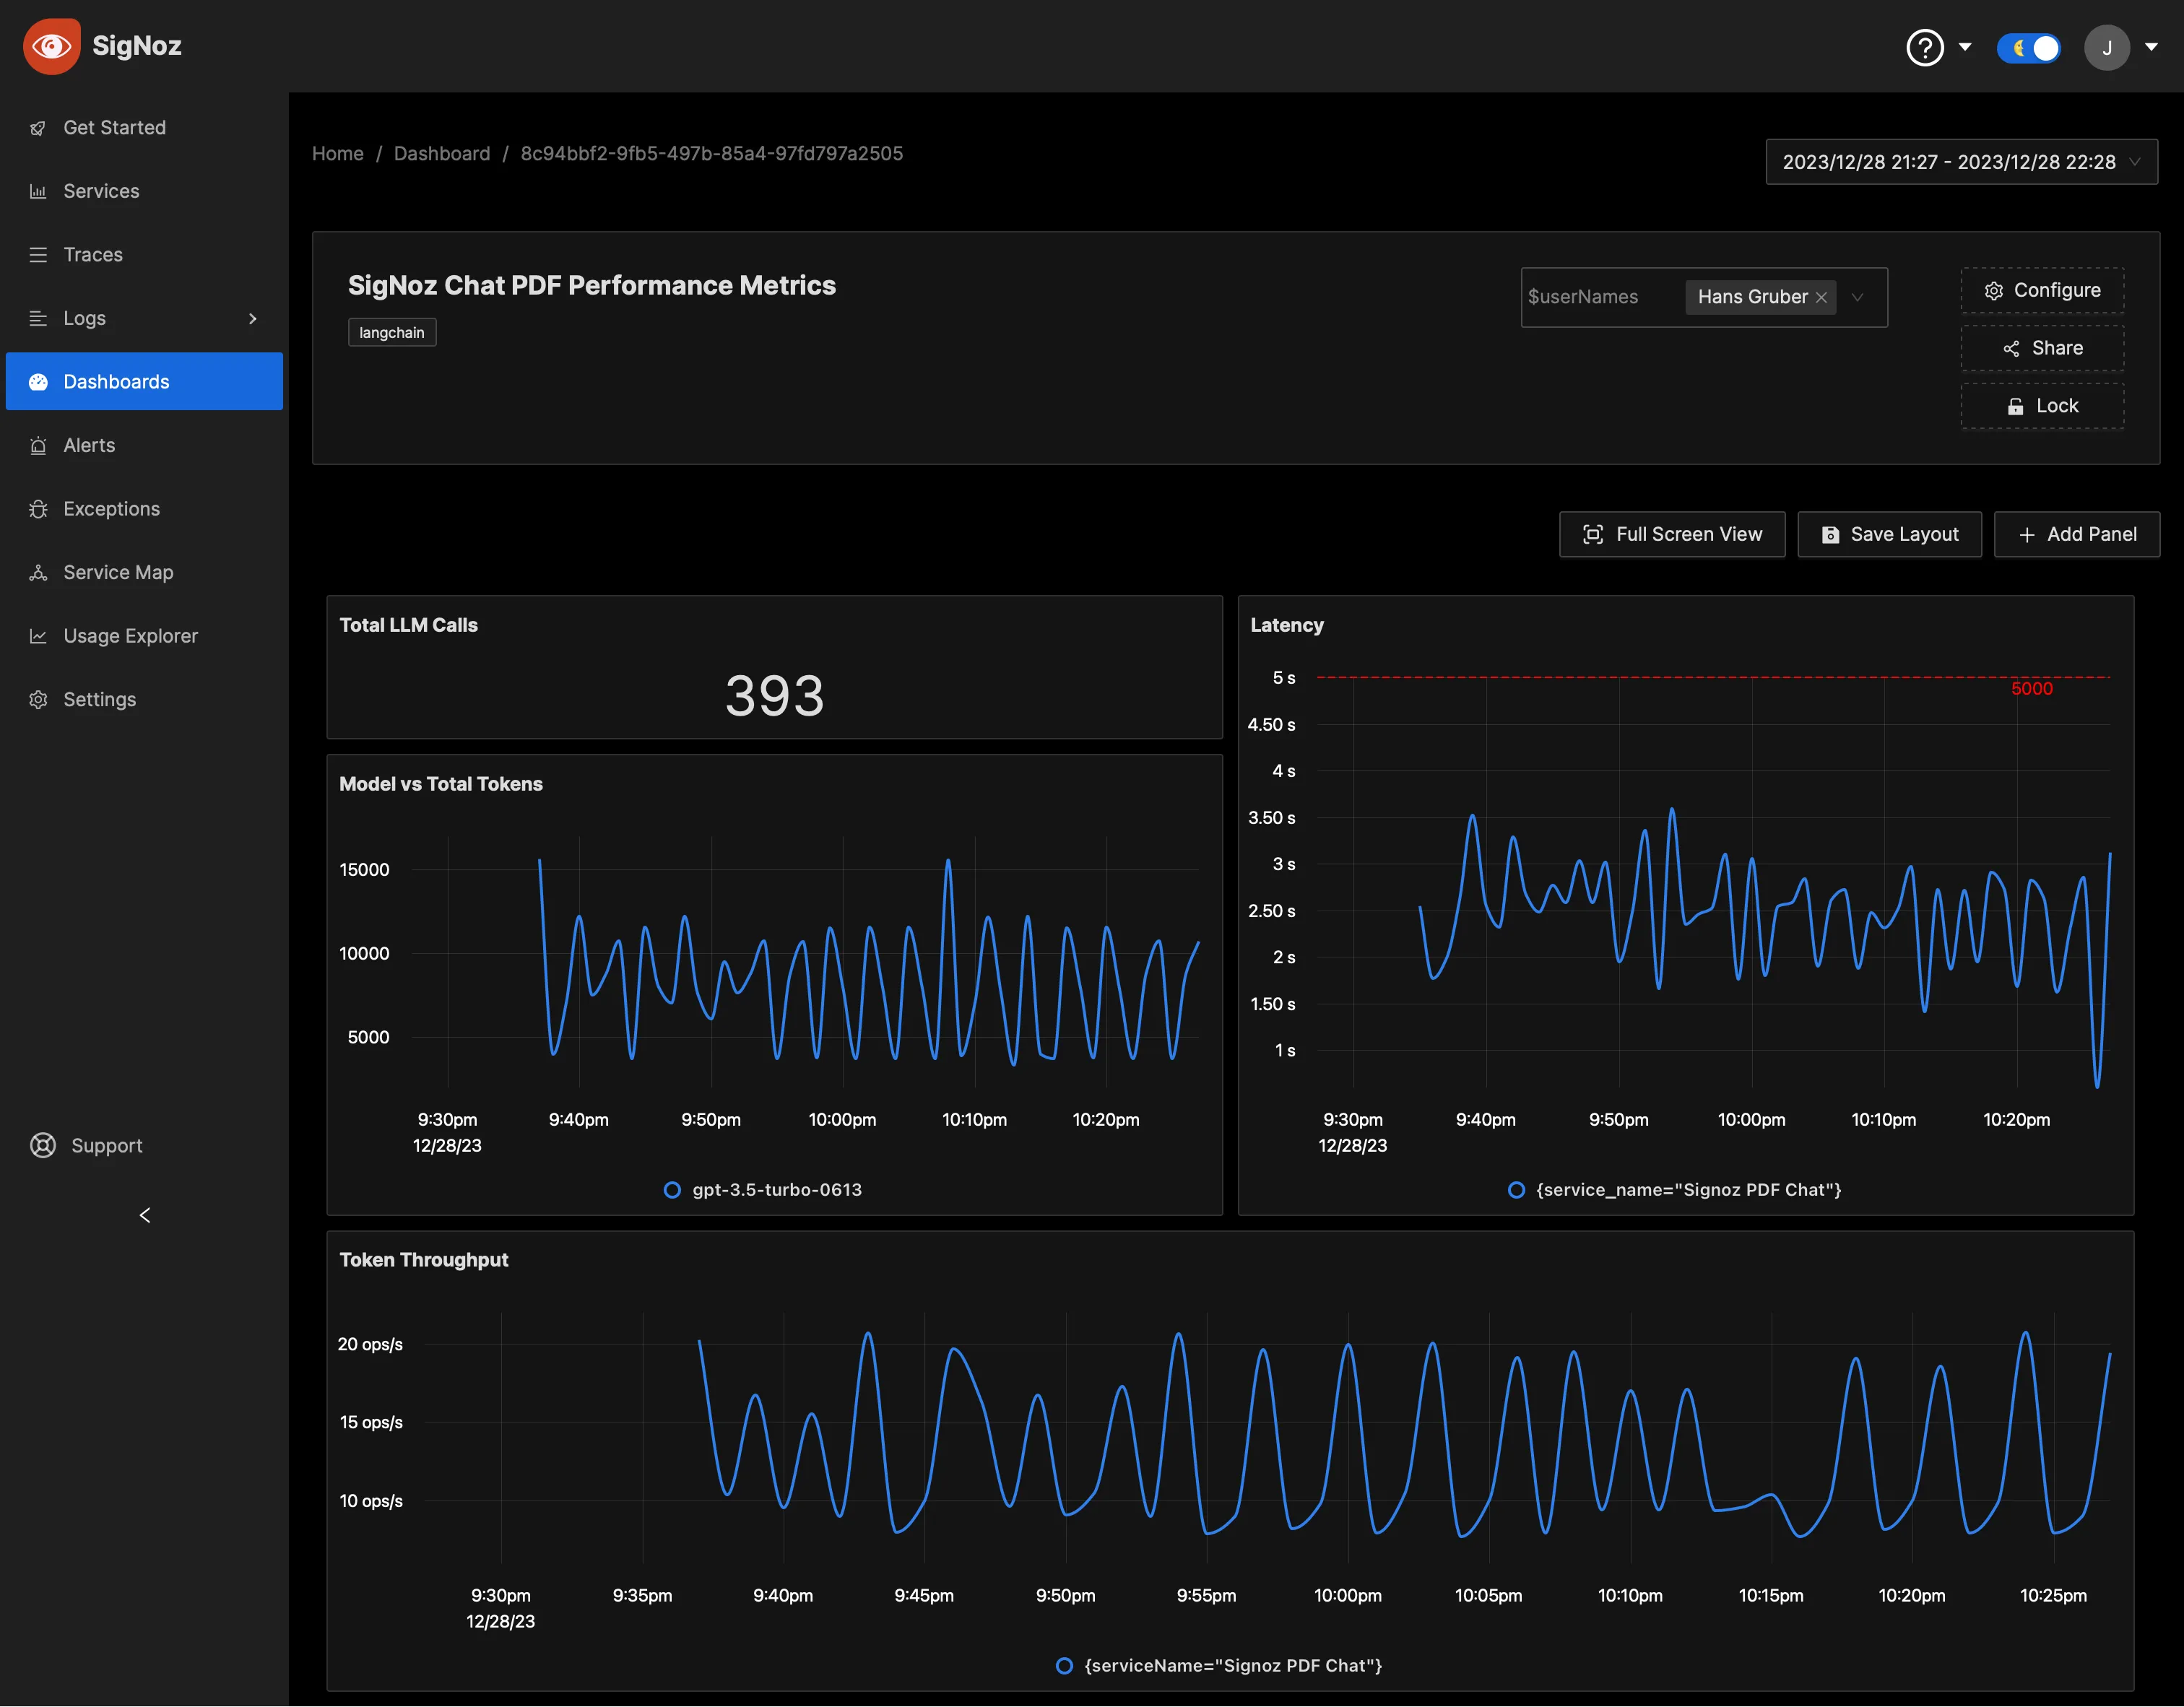
Dynamic Dashboard Views with Variables
To accommodate the needs of diverse teams, SigNoz supports dynamic dashboard views through the use of dashboard variables. For instance, the application team might need to see metrics specific to a 'service' or ‘user’.
To utilize this feature, you can create variables and corresponding options (see Manage Variables). The sample Dashboard JSONs attached to this article have good examples as well.
Learn how to create variables in Dashboards here
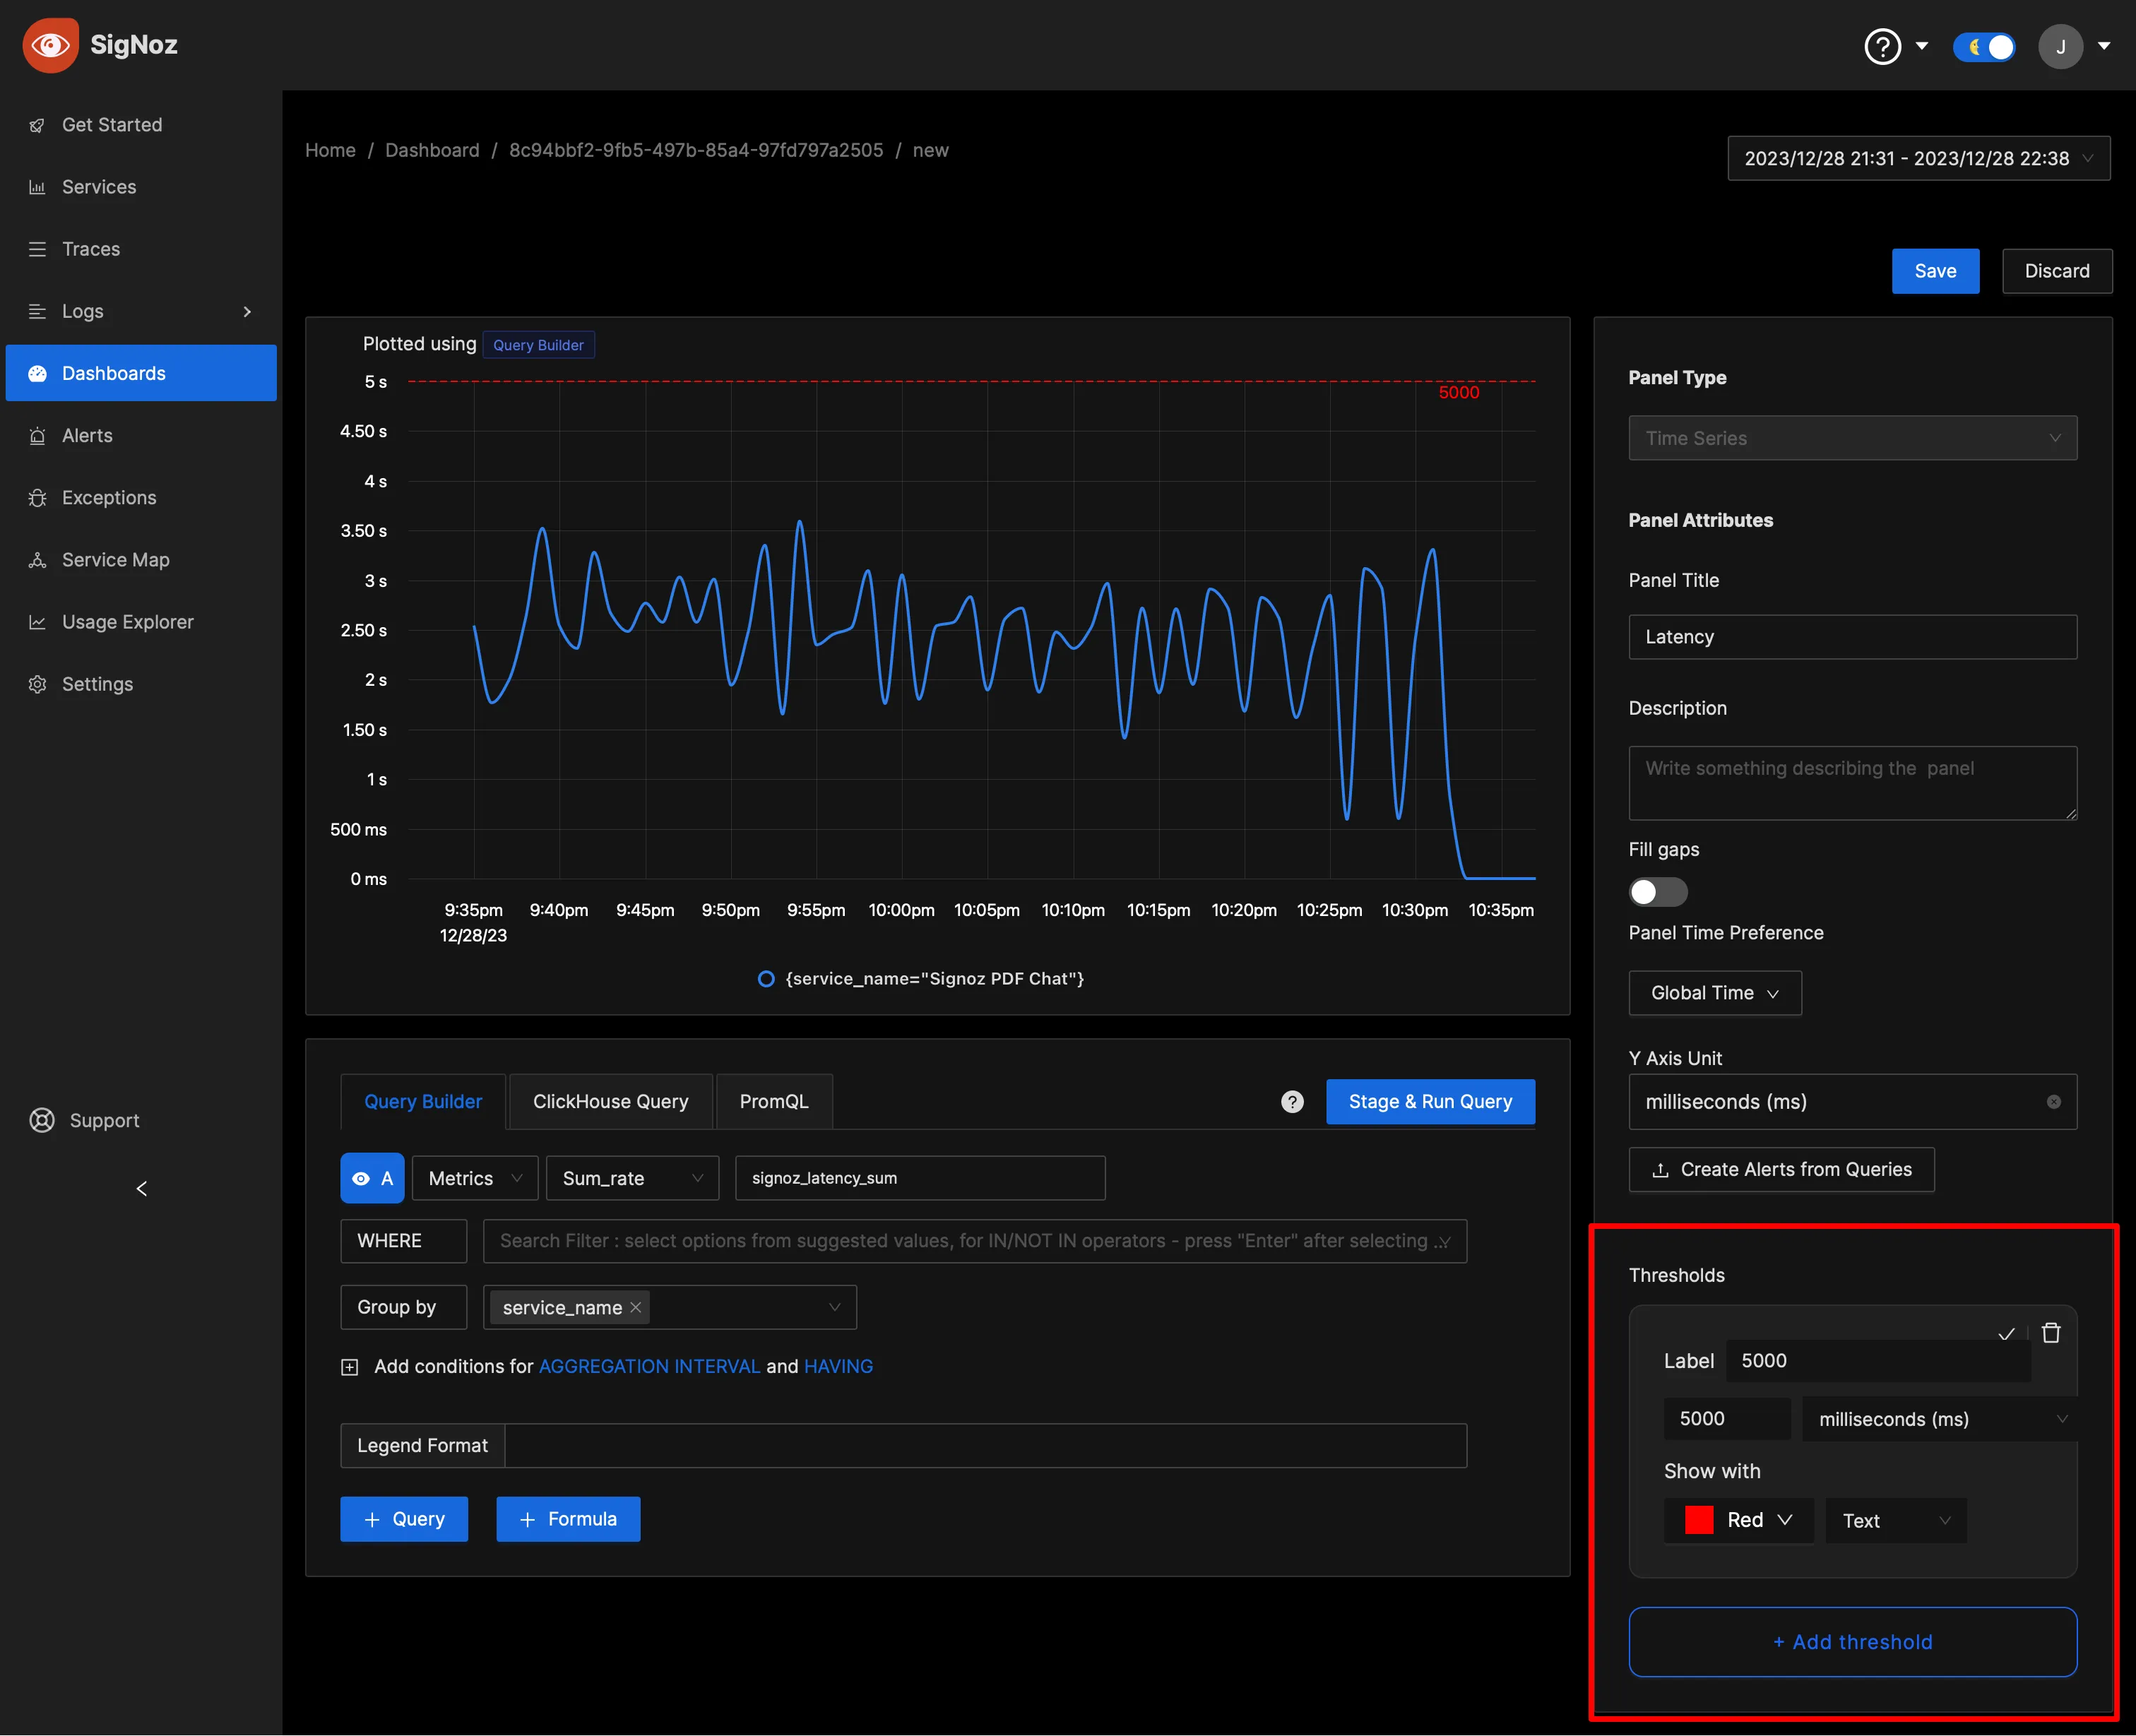
Thresholds
To help operators quickly identify critical points, you can set threshold values on your visualizations within the SigNoz dashboard. These thresholds can serve as benchmarks for acceptable performance levels or as warnings for potential issues.
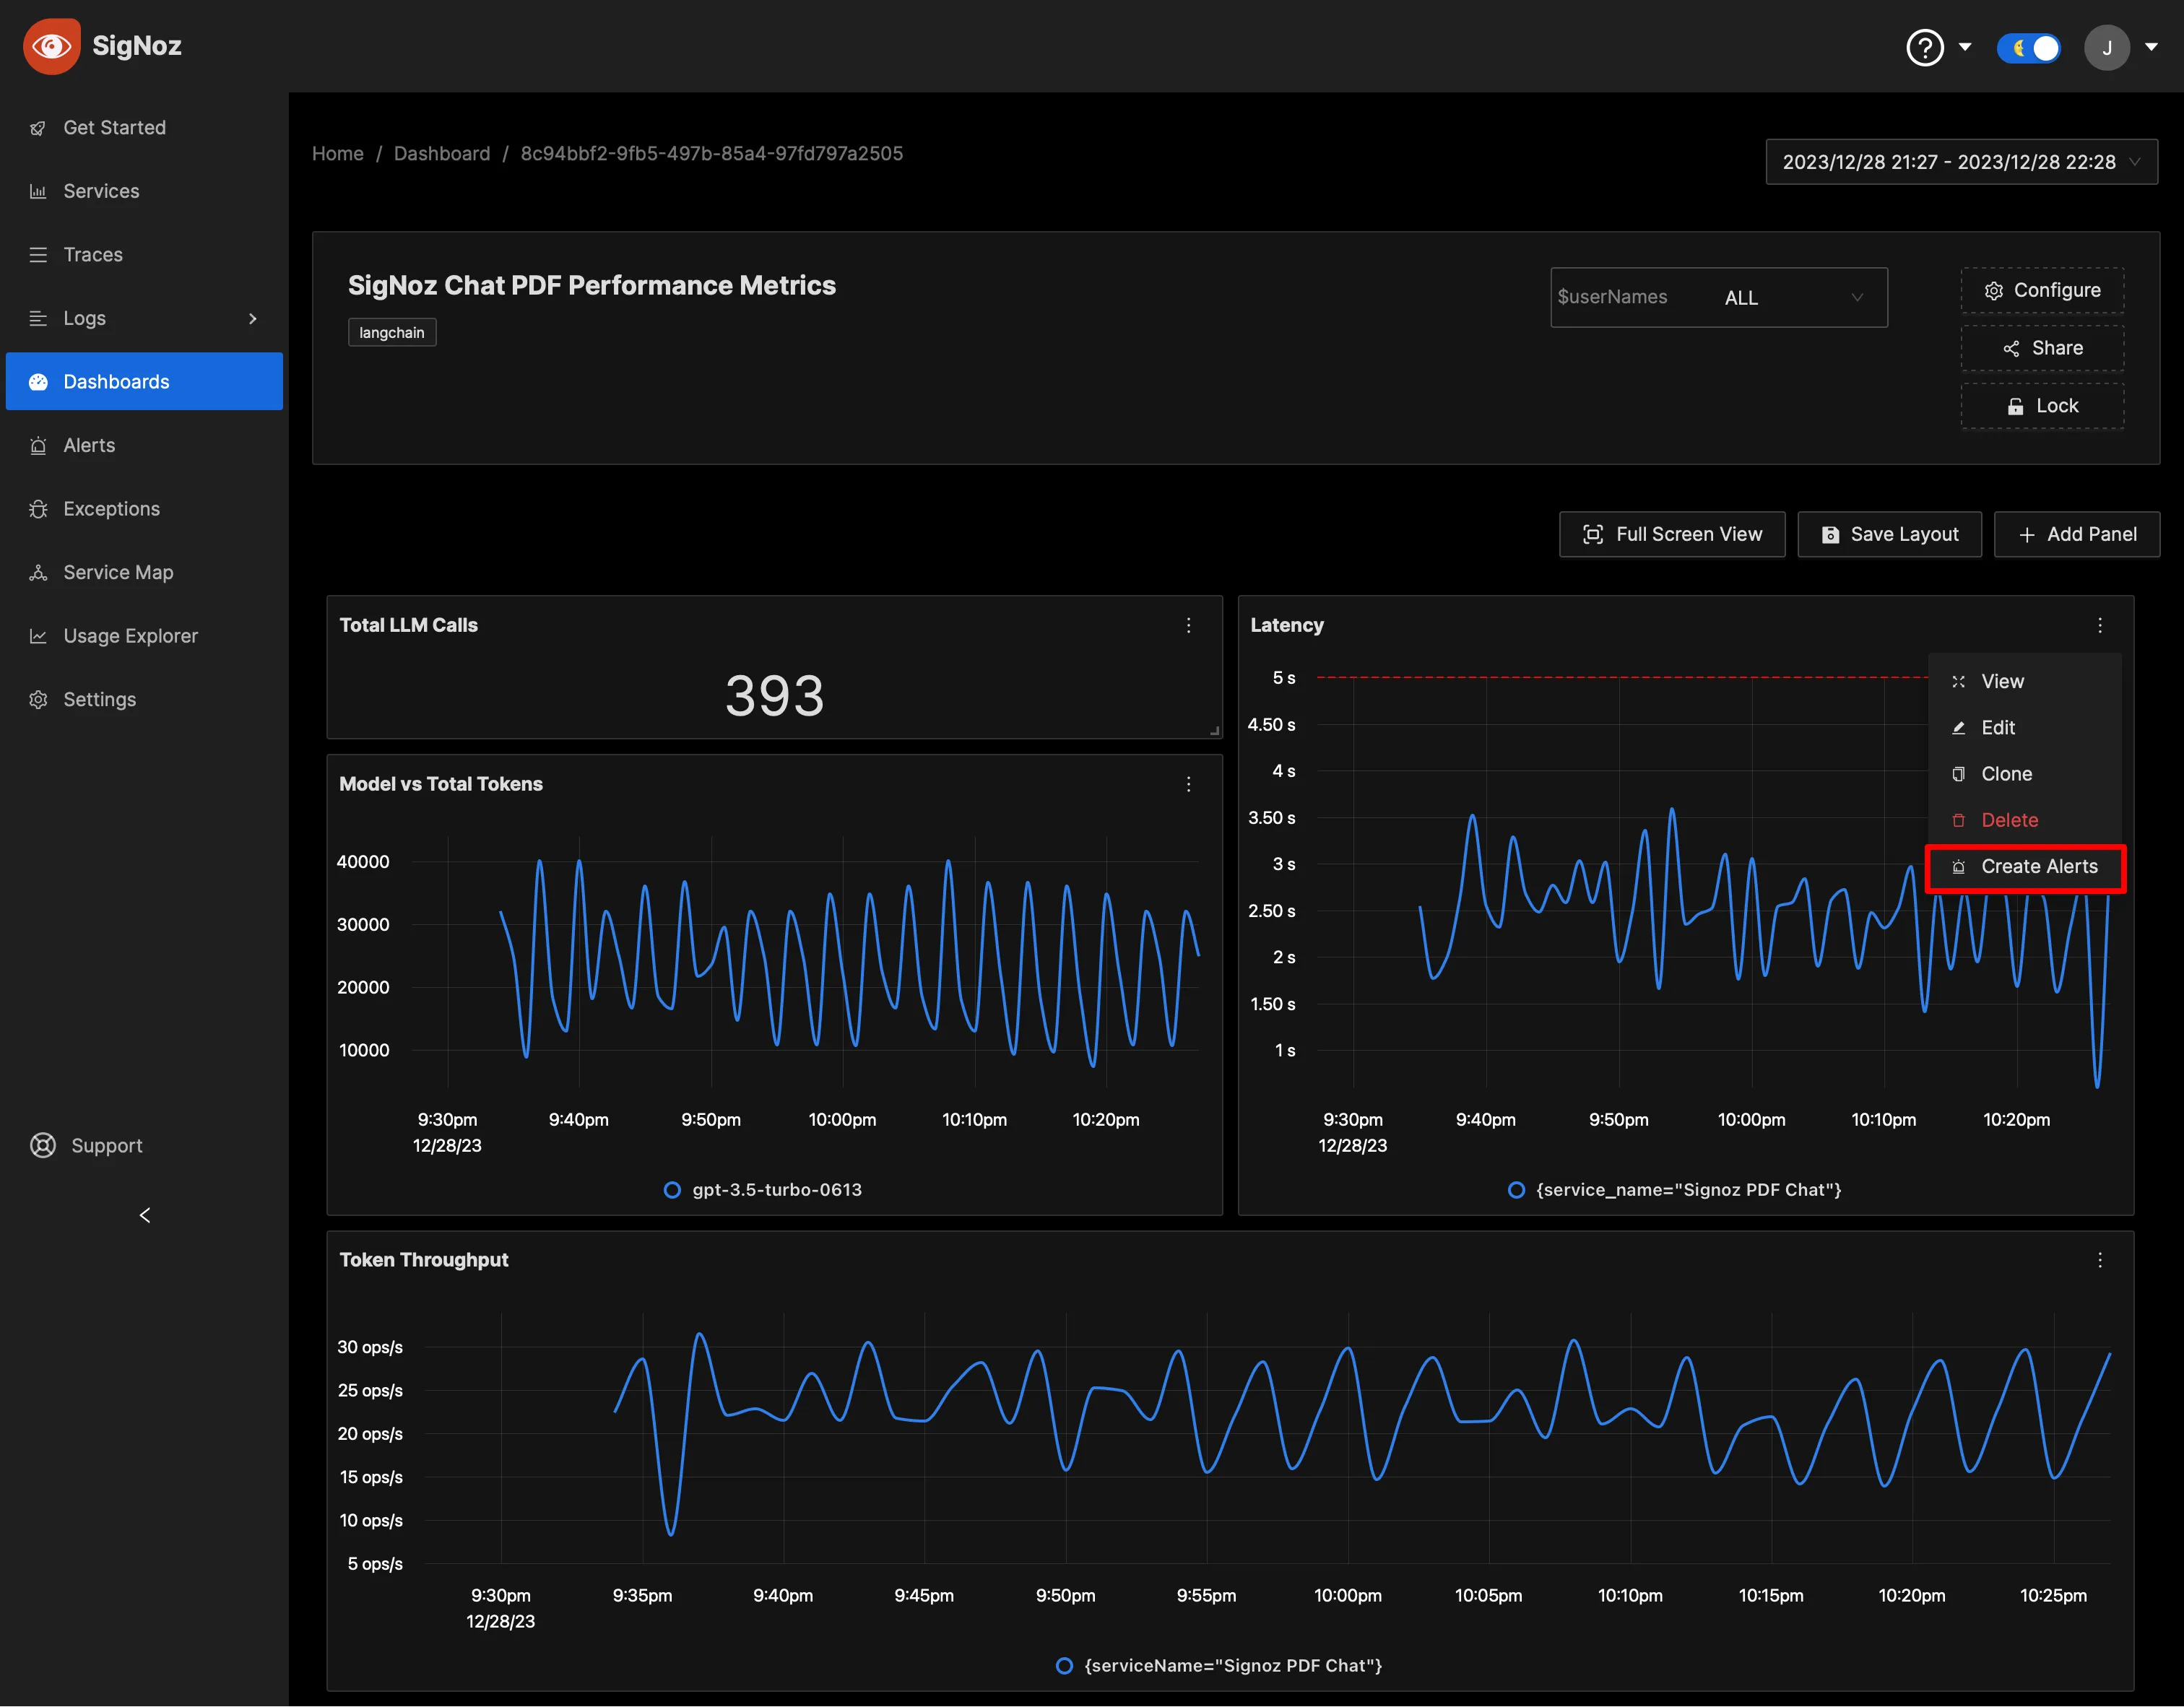
Alerting
Enhance your monitoring by creating alerts for any metric. SigNoz enables you to send notifications through various channels like Slack, Teams, or PagerDuty, ensuring rapid response times to critical conditions. Learn the process of setting up alerts in the comprehensive guide here.
Pre-built Dashboards
If you want to get started quickly with monitoring your Langchain app, you can use SigNoz's two pre-built dashboards: Performance Dashboard and Cost Dashboard. You can load SigNoz dashboard using the Import JSON button and get started.
JSON for Langchain App Performance Dashboard
JSON for Langchain App Cost Dashboard
Performance dashboard works with any Langchain App. The Cost dashboard’s 'Cost by User' panel works only when the user_id property is transmitted. For more details, refer to the example app or sample code on how to set associated properties.
Future Trends in LLM Observability
As LLM technology evolves, observability practices will adapt. Keep an eye on these emerging trends:
- Advanced Evaluation Techniques: Expect more sophisticated methods for assessing LLM outputs, potentially leveraging other AI models for evaluation.
- Explainable AI Integration: Tools that provide insights into LLM decision-making processes will become more prevalent.
- Automated Prompt Optimization: Systems that can automatically refine and test prompts based on observability data will emerge.
- Regulatory Compliance Tools: As AI regulations develop, observability solutions will incorporate features to ensure compliance and auditability.
- Real-time Adaptation: Future systems may use observability data to dynamically adjust LLM behavior in real-time.
Key Takeaways
- LLM Observability is essential for maintaining reliable, accurate, and efficient AI applications.
- Focus on the five pillars: evaluation, tracing, RAG, fine-tuning, and prompt engineering.
- Address common issues like inaccuracies and performance bottlenecks through comprehensive monitoring.
- Implement best practices and choose the right tools to establish effective LLM observability.
- Stay informed about emerging trends to future-proof your observability strategy.
FAQs
What's the difference between LLM Observability and traditional ML monitoring?
LLM Observability focuses on language model-specific aspects like prompt engineering and text generation quality, while traditional ML monitoring typically deals with model accuracy and data drift for structured data models.
How can LLM Observability help reduce costs in AI applications?
By monitoring token usage, response times, and resource utilization, LLM Observability helps identify opportunities for optimization, such as prompt refinement or model downsizing, leading to reduced operational costs.
What are the key metrics to monitor in an LLM application?
Key metrics include response quality, latency, token consumption, retrieval relevance (for RAG systems), and task-specific performance indicators relevant to your application's goals.
How does LLM Observability address privacy and security concerns?
LLM Observability helps detect potential data leaks, monitor for unauthorized information disclosure, and ensure compliance with data protection regulations by tracking and analyzing LLM inputs and outputs.
Further Reading
