OpenMetrics vs OpenTelemetry - A guide on understanding these two specifications
OpenMetrics and OpenTelemetry are popular standards for instrumenting cloud-native applications. Both projects are part of the Cloud Native Computing Foundation (CNCF) and aim to simplify how we generate, collect and monitor services in a modern cloud-native distributed application environment.
Let's have a look at how both the standards are aiming to help solve the observability conundrum.
What is OpenMetrics?
OpenMetrics improves on the Prometheus exposition format with some cleanups and new features. Under the hood, the OpenMetrics standard is basically Prometheus exposition format. Just like Prometheus, OpenMetrics specifies that clients expose metrics to the /metrics endpoint.
While all the underlying specifications are the same as Prometheus, including the usage of PromQL, OpenMetrics provides some notable improvements in the new specification:
- Units as new metadata.
_createdevents for metric creation & resets.- Support for Push metrics (Prometheus format only supported pull metrics).
- Exemplars allow information about traces to your logs and metrics.
- Usage of seconds as default time format rather than milliseconds.
The current state of OpenMetrics
OpenMetrics reached General Availability (GA) in 2023.. Let's look at the current state of the standard:
- Prometheus python client is the reference implementation and uses the OpenMetrics data model internally.
- OpenTelemetry supports OpenMetrics as a first-class wire format (although in experimental stages)
- OpenMetrics is a part of the Prometheus Conformance Program, which means that any client which needs the “Prometheus Compatible” mark, needs to be compatible with OpenMetrics as well. You can read more about Prometheus-OpenMetrics compliance on their GitHub page, Prometheus - OpenMetrics Compliance tester.
What is OpenTelemetry?
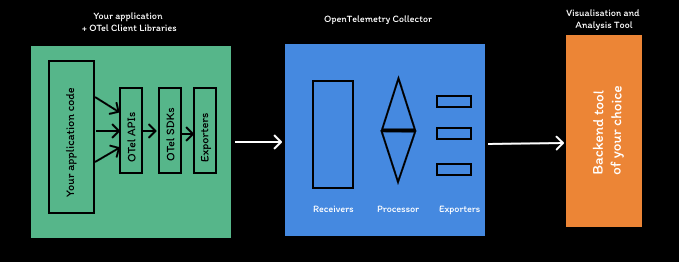
OpenTelemetry is a set of standards, API, SDKs, and libraries that aim to standardize the generation, collection, and management of telemetry data (logs, metrics, and traces). Founded in 2019, OpenTelemetry is a Cloud Native Computing Foundation project created after the merger of OpenCensus(from Google) and OpenTracing(from Uber).
The collected data from OpenTelemetry API is vendor-agnostic, so it can be exported in different formats. OpenTelemetry does not provide a storage and visualization layer for the collected telemetry data.
But as data can be exported in multiple formats, OpenTelemetry users have the freedom to choose a backend analysis tool. This way, users never get locked in with a specific observability vendor.

OpenTelemetry provides its own set of client libraries which makes it easier for you to integrate it into your application code. OpenTelemetry follows a specification-driven development. The client libraries follow the specification for their implementation.
Monitoring apps have become a crucial component in a modern microservices architecture. A well setup observability stack with OpenTelemetry will help you answer questions like:
- Why is my application slow?
- Why do we've so many errors?
- Where are user requests spending time?
The above questions can be answered on basis of these 3 key pieces of information: logs, metrics, and traces.
The OpenTelemetry project calls the above data points signals. It is currently working on four signals, namely, logs, metrics, traces, and baggage.
OpenTelemetry is a collaborative effort between 185 organizations around the world, involving thousands of individuals. Companies around the world have started adopting OpenTelemetry as a core engineering practice.
Take the example of GitHub, which wrote about its usage of OpenTelemetry. Considering its wide and increasing contributor ratio, OpenTelemetry is a safe choice for your application.
The current state of OpenTelemetry
The status of open-telemetry can be measured by how the signals (tracing, metrics and logging) have matured in 4 different components, namely API, SDKs, the OTLP Protocol, and the collector.
You can read a more in-depth and updated status on OpenTelemetry status. A more detailed status of each SDK can be found on OpenTelemetry - Compliance of implementation with the specification.
Key differences between OpenMetrics and OpenTelemetry
OpenMetrics and OpenTelemetry are not the same kind of thing, and they are largely complementary. OpenMetrics is a metrics exposition format (it grew out of the Prometheus text format), while OpenTelemetry is a full instrumentation framework spanning traces, metrics, and logs. OpenTelemetry can consume and emit OpenMetrics-style data, and the OpenMetrics project itself has been wound down, with its work folding back into Prometheus. So the practical question is usually how OpenMetrics fits inside an OpenTelemetry-and-Prometheus setup, not which one to pick.
From the above description, you might have a good idea about the differences between OpenMetrics and OpenTelemetry. Let us summarize the key differences between OpenMetrics and OpenTelemetry below:
- OpenTelemetry aims to provide a framework for an end-to-end observability stack with specifications for handling logs, traces, and metrics, whereas OpenMetrics is more focused on the metrics side.
- OpenMetrics just standardizes the exposition format through which metrics data must be communicated over a network, whereas OpenTelemetry aims to provide compatibility with OpenMetrics by using this standardized format to export metrics data.
- OpenTelemetry is mainly designed for push, whereas OpenMetrics is designed for pull, although the OpenMetrics specification has consideration for both push and pull mechanisms.
- The OpenMetrics format only captures metrics. For creating a robust monitoring framework, you will need to track metrics, logs, and traces.
Choosing between OpenMetrics and OpenTelemetry
If you are choosing between OpenMetrics and OpenTelemetry, go for Opentelemetry. It provides a more holistic solution to set up observability for your entire application stack. While OpenMetrics can be a good solution for metrics, OpenTelemetry is a one-stop solution for logs, metrics, and traces.
For related reading, see OpenTelemetry vs Prometheus, Traces vs Metrics, and the OpenTelemetry alternatives overview.
OpenTelemetry and SigNoz - the right combo for all your observability needs
OpenTelemetry is becoming the world standard for instrumenting application code due to its multi-language support and ease of use. But OpenTelemetry helps only to generate and collect telemetry data. You need to export the telemetry data to a backend analysis tool so that your teams can store, query, and visualize the collected data.
And that's where SigNoz comes into the picture. SigNoz uses OpenTelemetry natively to instrument application codes. OpenTelemetry collector then sends the data to the SigNoz backend, where users can query and visualize their data with ease.
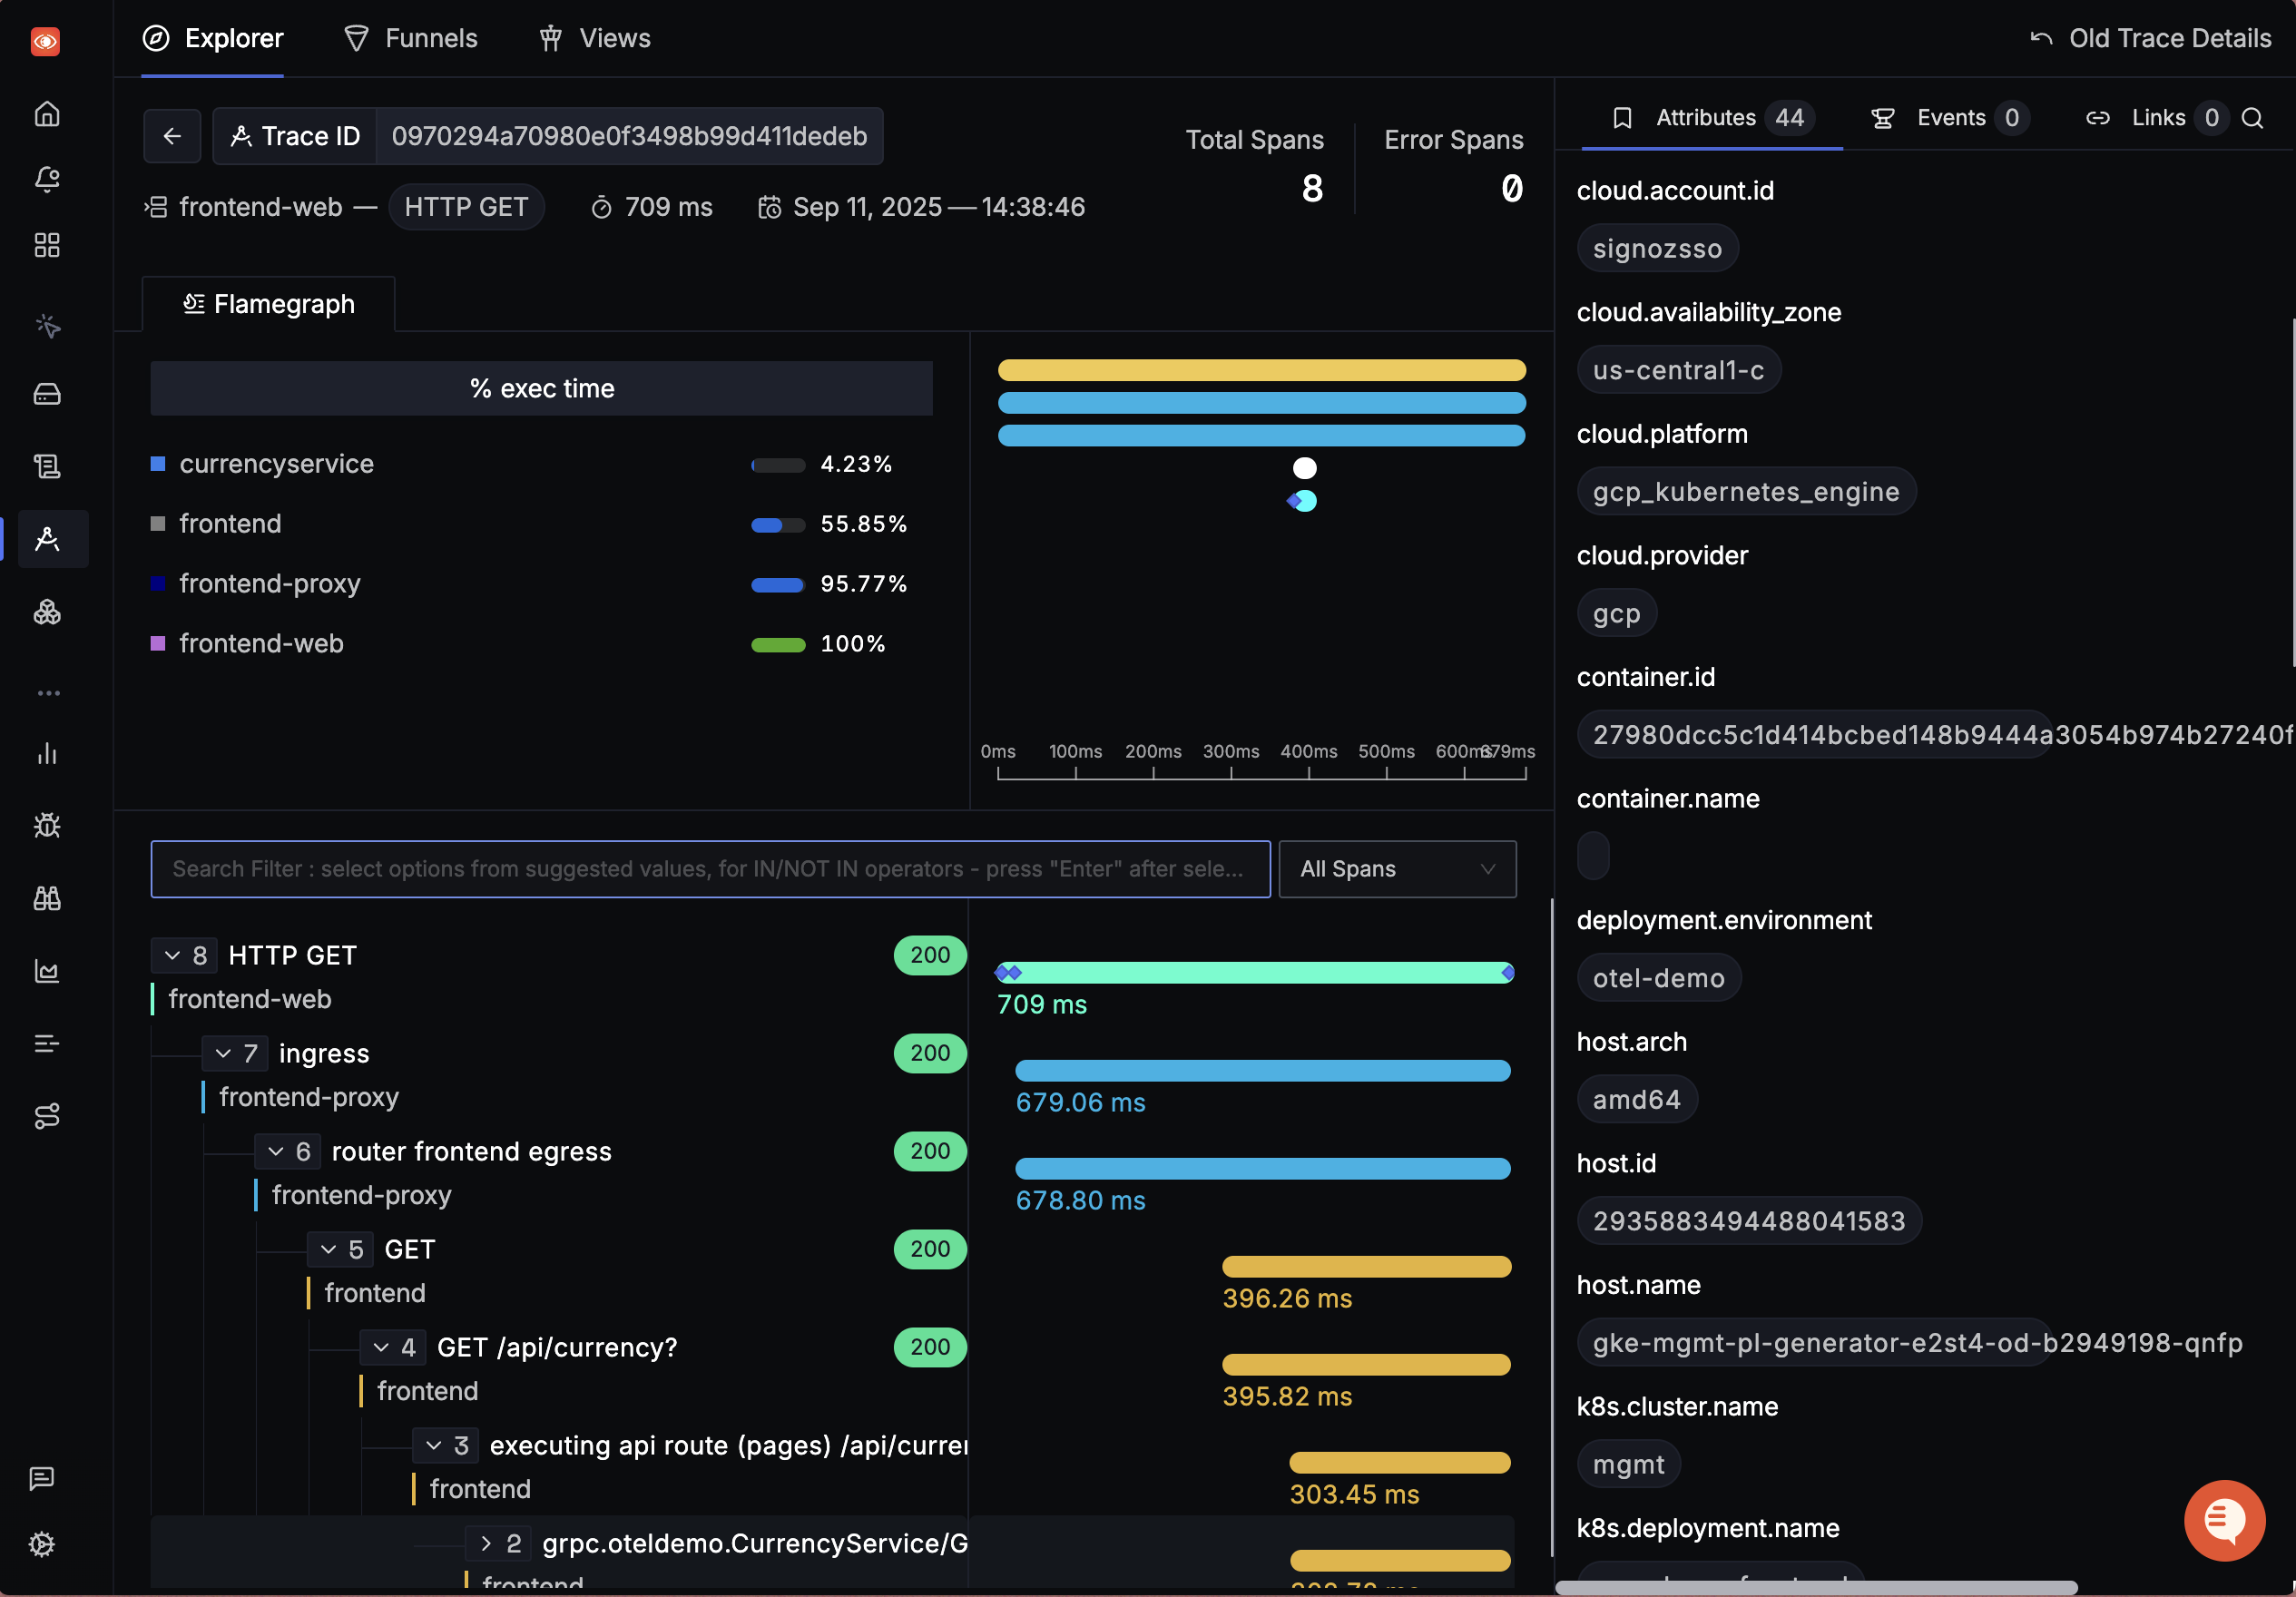
SigNoz comes with out of box visualization of things like RED metrics. There is a unified UI of metrics and traces so that you can easily identify the root cause of issues causing things like latency in your apps.
Getting started with SigNoz
SigNoz Cloud is the easiest way to run SigNoz. Sign up for a free account and get 30 days of unlimited access to all features.

You can also install and self-host SigNoz yourself since it is open-source. With 24,000+ GitHub stars, open-source SigNoz is loved by developers. Find the instructions to self-host SigNoz.
Further Reading
