How to export Azure Monitor Metrics using OpenTelemetry to SigNoz
Using OpenTelemetry Collector, you can collect metrics from Azure monitor and export them to any backend of your choice. Azure Monitor is a powerful service within the Microsoft Azure ecosystem that provides extensive metrics and logging capabilities. Yet the siloed nature of data in such tools can obscure the bigger picture, hindering a holistic view of system health.
In this tutorial, we cover:
- Understanding Azure Monitor Metrics
- Extending Observability by exporting Azure Monitor Metrics
- A Brief Overview of OpenTelemetry
- Prerequisites
- Setting up SigNoz
- Setting Up the OpenTelemetry Collector
- Monitoring with SigNoz Dashboard
- Conclusion
If you want to jump straight into implementation, start with this Prerequisites section.
This is where SigNoz enters the scene, equipped with an OpenTelemetry-native approach to break down data silos and amplify your observability capabilities. By marrying Azure Monitor's meticulous metrics with SigNoz's insightful analytics, you're set to unlock a new level of operability.
Understanding Azure Monitor Metrics
Azure Monitor can monitor these types of resources in Azure, other clouds, or on-premises:
- Applications
- Virtual machines
- Guest operating systems
- Containers, including Prometheus metrics
- Databases
- Security events in combination with Azure Sentinel
- Networking events and health in combination with Network Watcher
- Custom sources that use the APIs to get data into Azure Monitor
Please refer to Microsoft Learn on Azure Monitor to learn more about it.
Extending Observability by exporting Azure Monitor Metrics
Exporting Azure Monitor metrics is pivotal for achieving extended observability, providing a comprehensive view beyond native tools to analyze performance issues and system health in-depth.
Azure Monitor excels in capturing a diverse array of metrics across applications, virtual machines, containers, and more, regardless of their environment. Whether it's performance data, security insights, or network health, these metrics enriched through exportation to platforms like SigNoz can drive nuanced understanding and proactive management of your systems across any scale.
OpenTelemetry is quietly becoming the open-source standard for generating telemetry data for cloud-native applications.
A Brief Overview of OpenTelemetry
OpenTelemetry is a set of APIs, SDKs, libraries, and integrations aiming to standardize the generation, collection, and management of telemetry data(logs, metrics, and traces). It is backed by the Cloud Native Computing Foundation and is the leading open-source project in the observability domain.
The data you collect with OpenTelemetry is vendor-agnostic and can be exported in many formats. Telemetry data has become critical in observing the state of distributed systems. With microservices and polyglot architectures, there was a need to have a global standard. OpenTelemetry aims to fill that space and is doing a great job at it thus far.
Teams weighing the platforms themselves often read the OpenTelemetry vs Azure Monitor comparison.
In this tutorial, you will use OpenTelemetry Collector to collect Azure Monitor metrics.
What is OpenTelemetry Collector?
OpenTelemetry Collector is a stand-alone service provided by OpenTelemetry. It can be used as a telemetry-processing system with a lot of flexible configurations to collect and manage telemetry data.
It can understand different data formats and send it to different backends, making it a versatile tool for building observability solutions.
Read our complete guide on OpenTelemetry Collector
How does OpenTelemetry Collector collect data?
A receiver is how data gets into the OpenTelemetry Collector. Receivers are configured via YAML under the top-level receivers tag. There must be at least one enabled receiver for a configuration to be considered valid.
Here’s an example of an otlp receiver:
receivers:
  otlp:
    protocols:
      grpc:
      http:
An OTLP receiver can receive data via gRPC or HTTP using the OTLP (OpenTelemetry Protocol) format. There are advanced configurations that you can enable via the YAML file.
Here’s a sample configuration for an OTLP receiver.
receivers:
  otlp:
    protocols:
      http:
        endpoint: "localhost:4318"
        cors:
          allowed_origins:
            - http://test.com
            # Origins can have wildcards with *, use * by itself to match any origin.
            - https://*.example.com
          allowed_headers:
            - Example-Header
          max_age: 7200
Now that you understand how OpenTelemetry collector collects data let’s see how to use it to collect Azure Monitor metrics.
Prerequisites
-
This tutorial you have a AKS cluster created. If you haven’t follow this user guide
-
kubectlinstalled and logged in with helm -
Azure Service Principal / Managed Identity with Read access to Subscription
Setting up SigNoz
You need a backend to which you can send the collected data for monitoring and visualization. SigNoz is an OpenTelemetry-native APM that is well-suited for visualizing OpenTelemetry data.
SigNoz cloud is the easiest way to run SigNoz. You can sign up here for a free account and get 30 days of unlimited access to all features.
You can also install and self-host SigNoz yourself. Check out the docs for installing self-host SigNoz.
Setting Up the OpenTelemetry Collector
Deploying the OpenTelemetry Collector can be approached in two distinct ways, depending on your infrastructure:
- Utilizing OpenTelemetry Helm Charts: Ideal for those with an existing Kubernetes infrastructure.
- Running the Collector on a Virtual Machine: For users not using Kubernetes and relying on serverless environments for their workloads.
Installing with OpenTelemetry Helm Charts
Prior to installation, you must ensure your Kubernetes cluster is ready and that you have the necessary permissions to deploy applications. Follow these steps to use Helm for setting up the Collector:
Step 1. Add the OpenTelemetry Helm repository:
helm repo add open-telemetry https://open-telemetry.github.io/opentelemetry-helm-chartsStep 2. Prepare the otel-collector-values.yaml Configuration
Your configuration file should include the necessary details for your setup. This includes updating placeholders such as <ingestion-key>, <region>, and connection-specific credentials for your observability backend.
Make sure to replace the placeholders with actual data corresponding to your setup. For Azure Monitor, set up a service principal or utilize a pod-managed identity with Read permissions to your Azure subscription.
Below is an example targeting the SigNoz backend with Azure Monitor receivers configured:
service:
  pipelines:
    metrics:
      receivers: [azuremonitor]
      exporters: [otlp]
receivers:
  azuremonitor:
    subscription_id: "<Subscription ID>"
    tenant_id: "<AD Tenant ID>"
    client_id: "<Client ID>"
    client_secret: "<Client Secret>"
    resource_groups: ["<rg-1>"]
    collection_interval: 60s
exporters:
  otlp:
    endpoint: "ingest.<region>.signoz.cloud:443"
    tls:
      insecure: false
    headers:
      "signoz-ingestion-key": "<ingestion-key>"
Step 3. Deploy the OpenTelemetry Collector to your Kubernetes cluster:
You'll need to prepare a custom configuration file, say otel-collector-values.yaml, that matches your environment's specific needs. Replace <namespace> with the Kubernetes namespace where you wish to install the Collector.
helm install -n <namespace> --create-namespace otel-collector open-telemetry/opentelemetry-collector -f otel-collector-values.yamlFor more details, refer to the official OpenTelemetry Helm Chart documentation, which offers comprehensive installation instructions and configuration options tailored to your environment's requirements.
Running the Collector on a Virtual Machine
If you're not using Kubernetes, setting up the OpenTelemetry Collectoron a Virtual Machine (VM) is a straightforward alternative. This setup is compatible with cloud VM instances, your own data center, or even a local VM on your development machine. Here's how to do it:
Step 1. Download and Install the OpenTelemetry Collector Binary:
Please visit Documentation For VM which provides further guidance on a VM installation.
It's prudent to check available resources to ensure you're following the latest practices and utilizing updated features offered by OpenTelemetry. Follow the documentation to set up your collector and test the setup.
Step 2. Configure the OpenTelemetry Collector:
The Collector requires configuration before it can start receiving Azure Monitor data. Create a file named otel-collector-config.yaml and populate it with the necessary configuration details. This file should be configured to fit your specific environment's requirements. For instance, you may want to setup receivers for the telemetry data you expect to collect and processors to handle that data appropriately, as well as exporters to send the data to your desired backend, like SigNoz, Jaeger, or Prometheus.
Below is a basic configuration example:
service:
  pipelines:
    metrics:
      receivers: [azuremonitor]
      exporters: [otlp]
receivers:
  azuremonitor:
    subscription_id: "<Subscription ID>"
    tenant_id: "<AD Tenant ID>"
    client_id: "<Client ID>"
    client_secret: "<Client Secret>"
    resource_groups: ["<rg-1>"]
    collection_interval: 60s
exporters:
  otlp:
    endpoint: "ingest.<region>.signoz.cloud:443"
    tls:
      insecure: false
    headers:
      "signoz-ingestion-key": "<ingestion-key>"
Ensure you replace the placeholders <region> and <ingestion-key> with the appropriate values for your observability backend.
Step 3. Run the Collector:
With your configuration file ready, you can now start the Collector using the following command:
# Runs in background with the configuration we just created
./otelcol-contrib --config ./otel-collector-config.yaml &> otelcol-output.log & echo "$!" > otel-pid
Step 4. Validating the Deployment:
Once the Collector is running, ensure that telemetry data is being successfully sent and received. Use the logging exporter as defined in your configuration file, or check the logs for any startup errors.
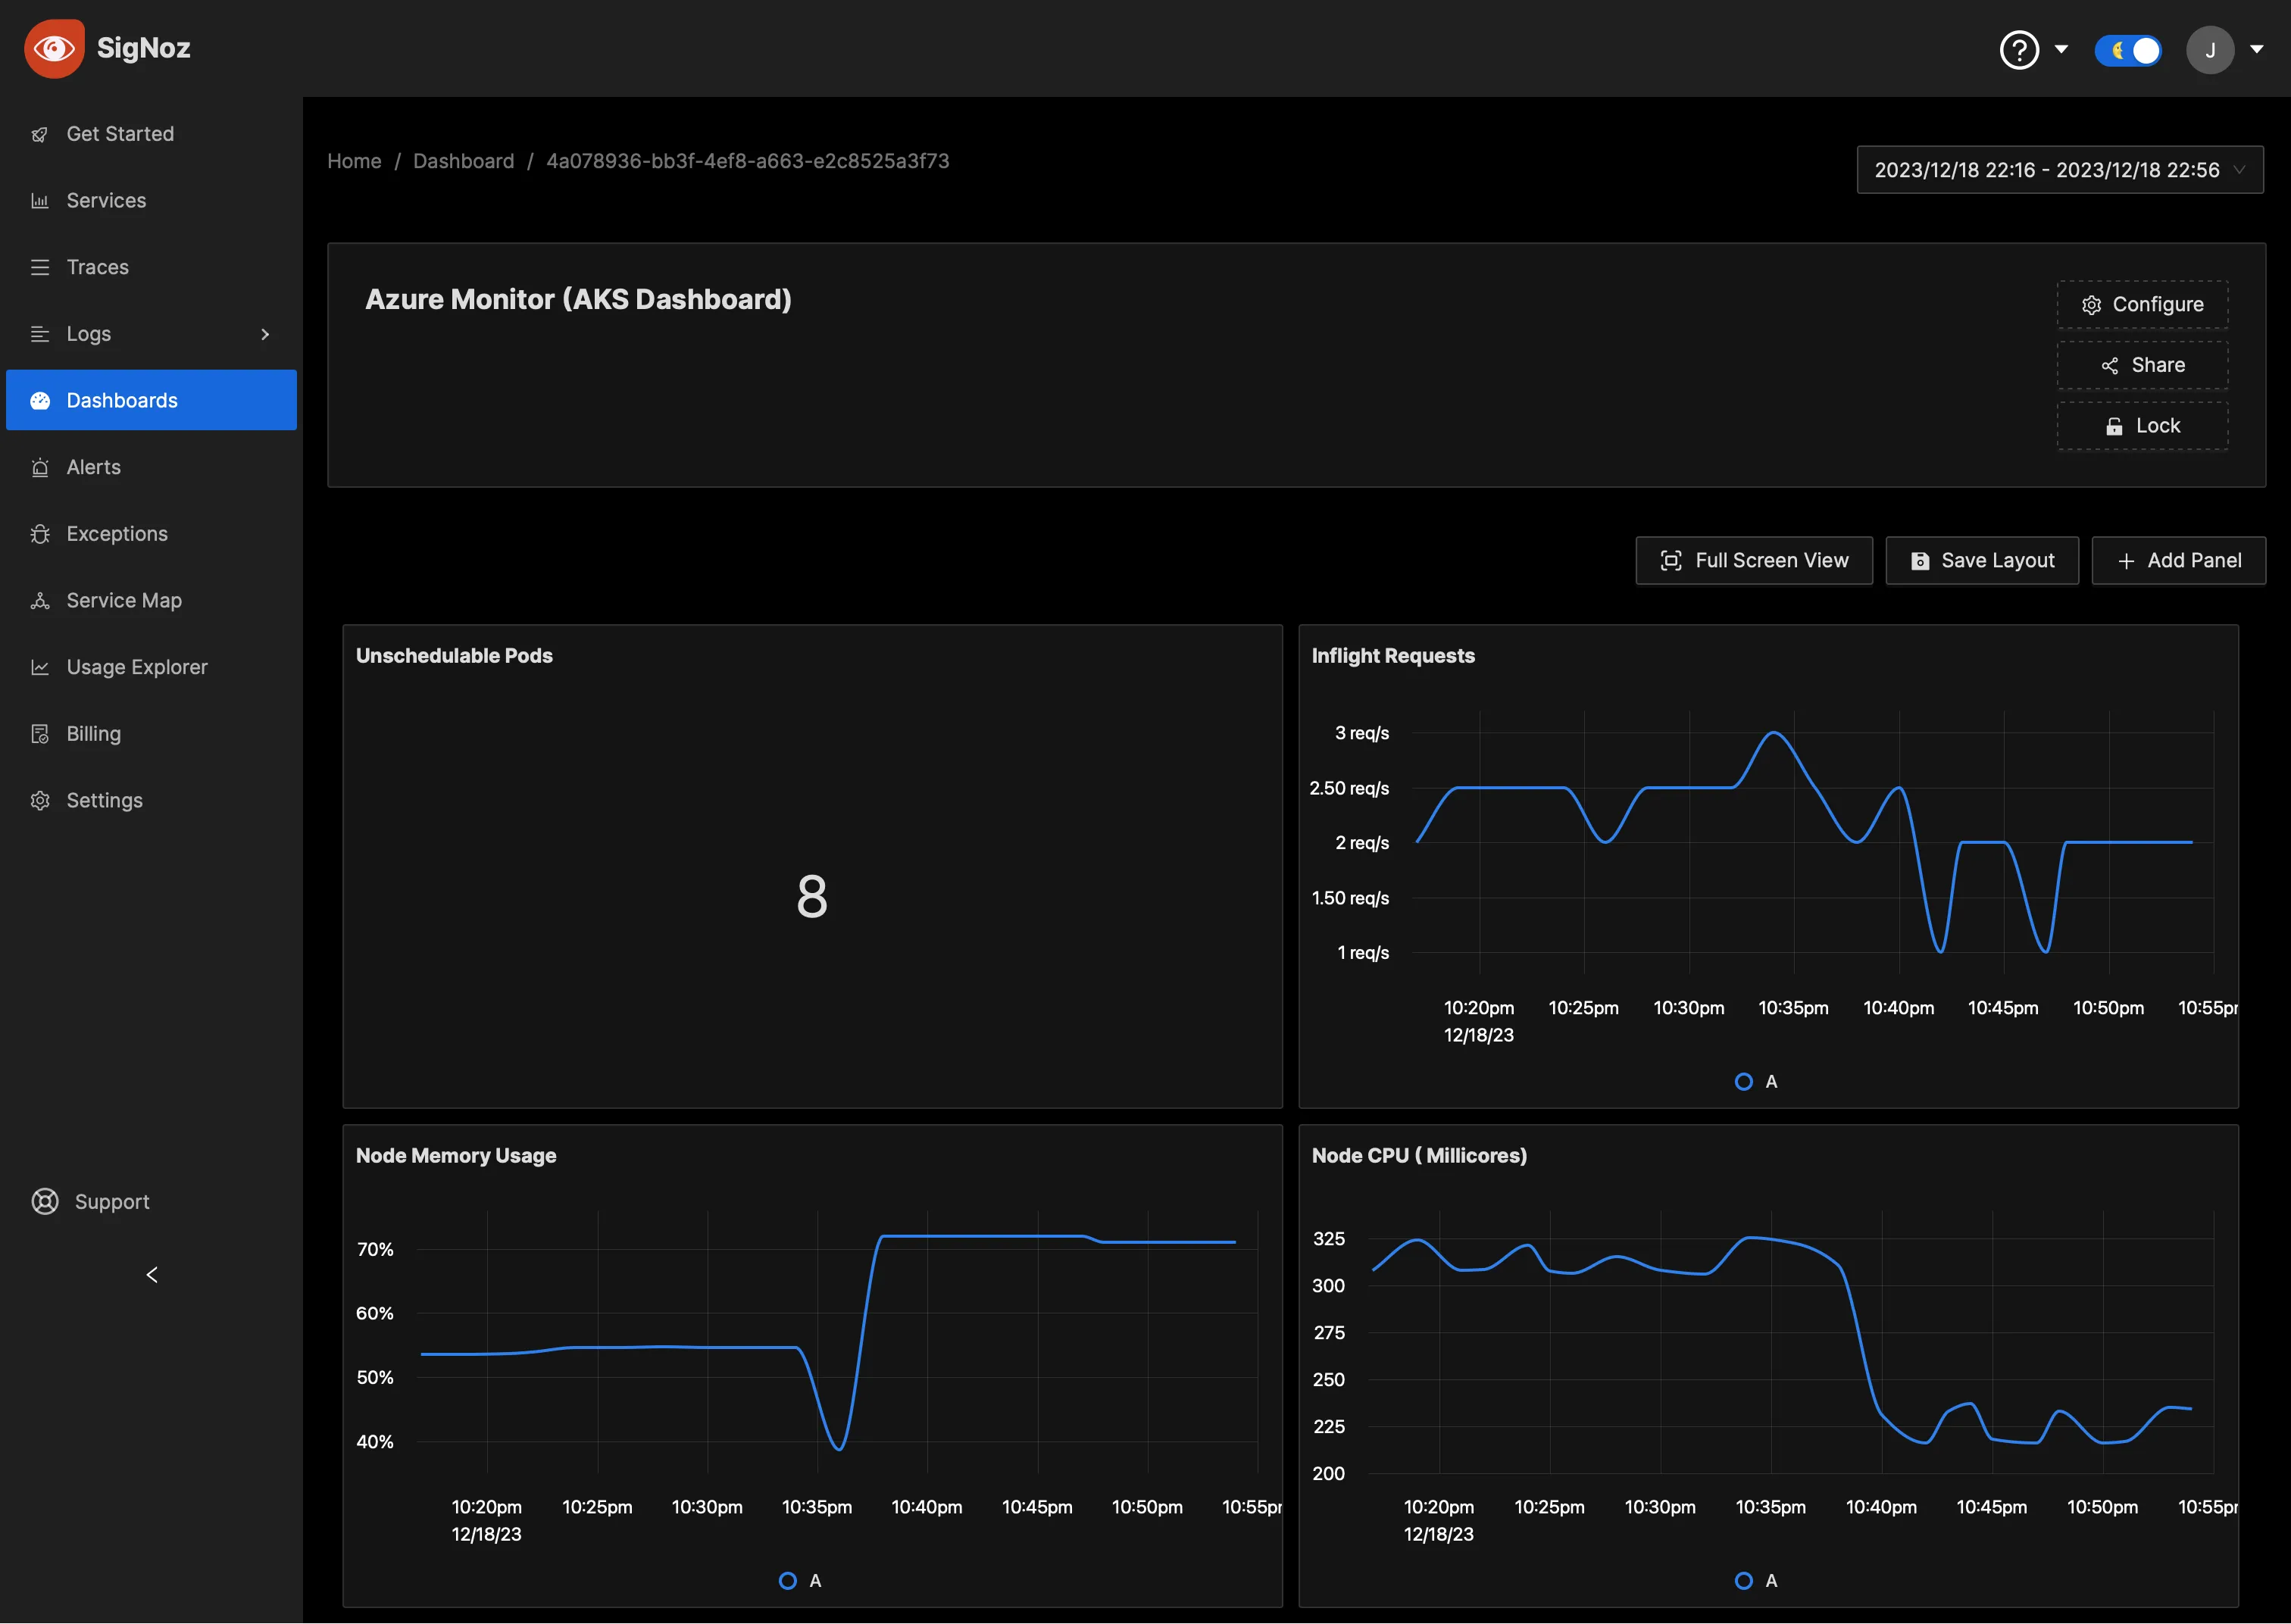
Monitoring with SigNoz Dashboard
Once the above setup is done, you will be able to access the metrics in the SigNoz dashboard. You can go to the Dashboards tab and try adding a new panel. You can learn how to create dashboards in SigNoz here.
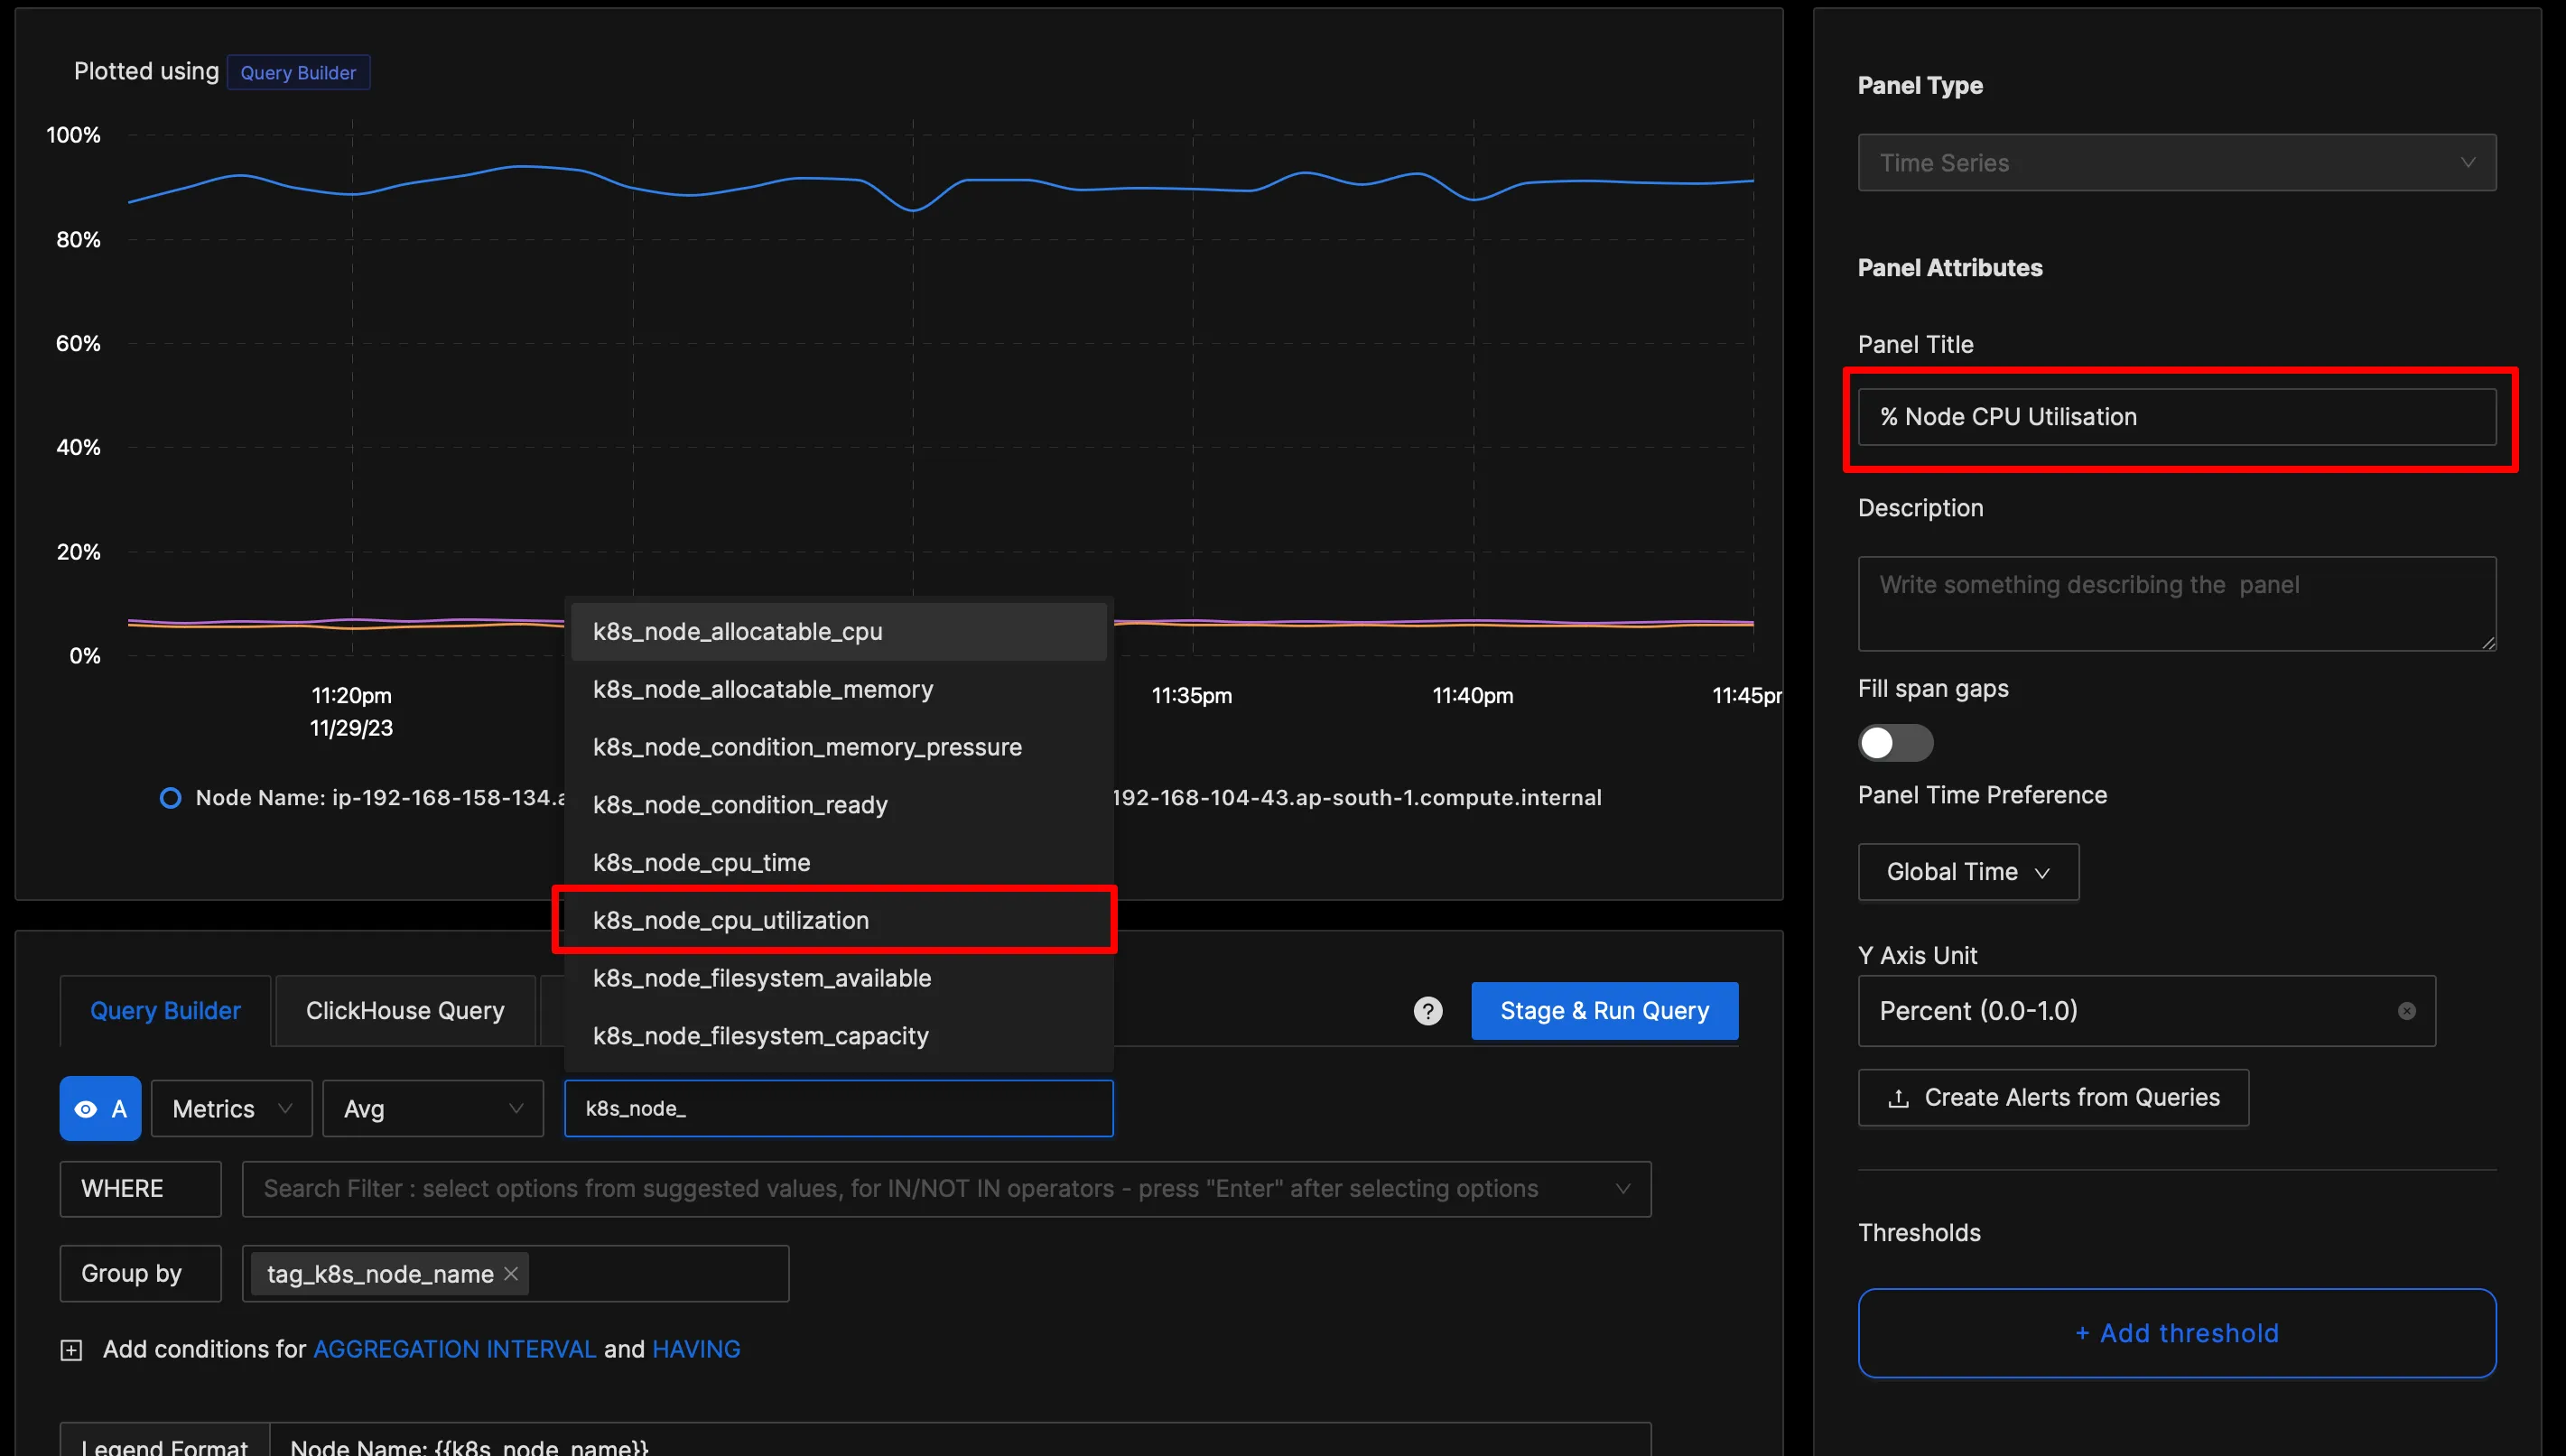
You can easily create charts with query builder in SigNoz. Here are the steps to add a new panel to the dashboard.
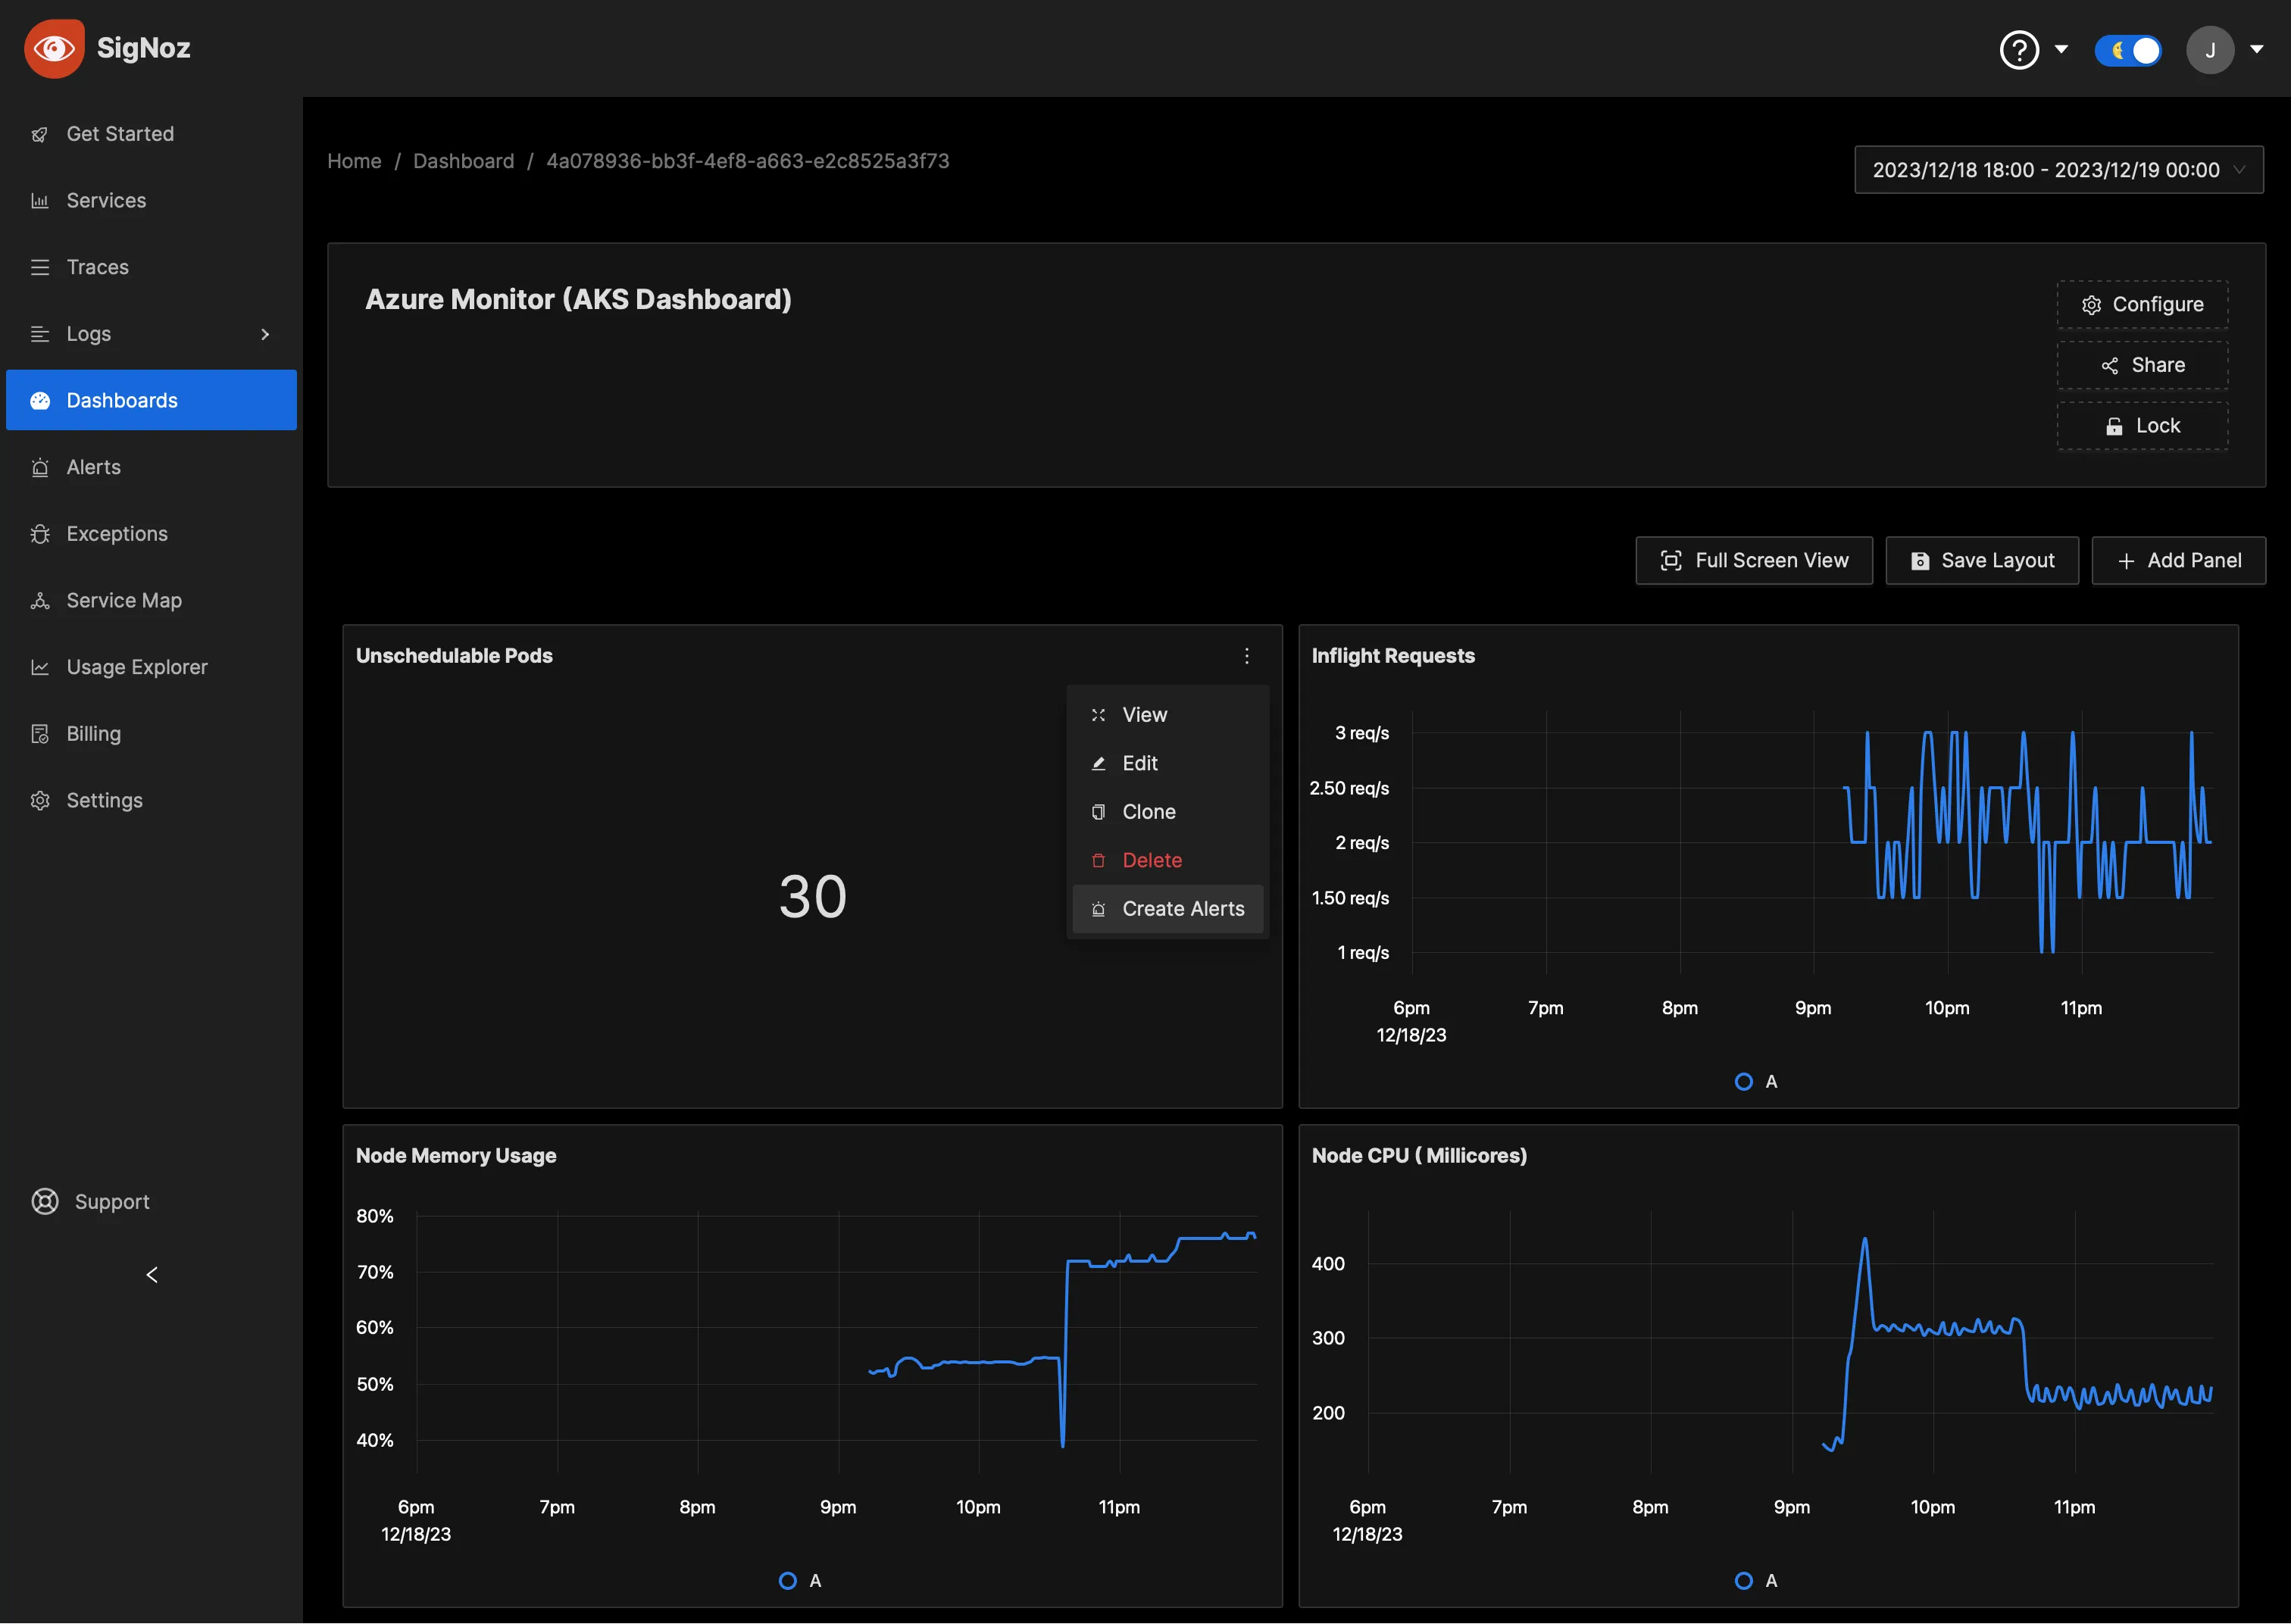
Adding Alerts to Critical Metrics
You have the ability to set up customized alerts based on various metrics, with options to receive notifications via Slack, Microsoft Teams, or PagerDuty. To learn how to configure these alerts, visit our detailed guide here.
Consider, for instance, a scenario relevant to your Azure Kubernetes Service (AKS) operations team or Site Reliability Engineers (SREs): It’s crucial that they receive immediate notifications if the number of pods that cannot be scheduled on a node persists above zero for a duration exceeding 10 minutes. This alert ensures that your team can quickly address any issues that may prevent pods from running properly on your cluster.
Conclusion
In this step-by-step tutorial aimed at software developers and DevOps engineers, we've detailed the process of collecting and exporting performance metrics from Azure Monitor to SigNoz by utilizing the OpenTelemetry framework. By integrating the comprehensive telemetry data available from Azure with SigNoz's user-friendly dashboard, we facilitate enhanced observability for cloud-native applications. This integration enables impactful insights for real-time monitoring and improved alerting capabilities.
Visit our complete guide on OpenTelemetry Collector to learn more about it. OpenTelemetry is quietly becoming the world standard for open-source observability, and by using it, you can have advantages like a single standard for all telemetry signals, no vendor lock-in, etc.
SigNoz is an open-source OpenTelemetry-native APM that can be used as a single backend for all your observability needs.
Further Reading
