Monitoring Docker Container Metrics with OpenTelemetry [Tutorial]
Monitoring Docker container metrics is essential for understanding the performance and health of your containers. The OpenTelemetry Collector can collect Docker container metrics and send them to a backend of your choice. In this tutorial, you will install an OpenTelemetry Collector to collect Docker container metrics and send them to SigNoz, an OpenTelemetry-native APM for monitoring and visualization.
In this tutorial, we cover:
- Why monitor Docker container metrics?
- A Brief Overview of OpenTelemetry
- How does OpenTelemetry Collector collect data?
- Pre-requisites
- Setting up OpenTelemetry Collector
- Monitoring Docker Metrics in the SigNoz Dashboard
- Reference: Docker container metrics and labels collected by OpenTelemetry Collector
- Conclusion
If you want to jump straight into implementation, start with this Prerequisites section.
Dockerization has become quite popular in making application workloads portable. They help developers get rid of server-level dependencies and simplify testing and deployment of the applications themselves. With the adoption of Cloud native technologies, the adoption of Docker has naturally grown. This brought in the need for monitoring the Docker-based containers running on various types of computing.
Why monitor Docker container metrics?
Monitoring Docker container metrics can be crucial in various scenarios to avoid performance issues and assist developers in troubleshooting. container may start consuming an excessive amount of resources (CPU or memory), impacting other containers or the host system.
By monitoring CPU and memory usage, you can detect resource saturation early. This allows you to adjust resource allocation, optimize the application, or scale out your environment before users experience significant slowdowns or outages.
Some of the key factors why monitoring Docker containers is important are as follows:
- Resource Optimization: It helps in allocating resources efficiently and scaling the containers as per the demand.
- Performance Management: By understanding the resource utilization and demand, you can tune the performance of applications running inside the containers.
- Troubleshooting: It enables quick identification and resolution of issues, reducing downtime and improving reliability.
- Cost Management: In cloud environments, efficient resource usage can lead to significant cost savings.
We can use OpenTelemetry and a backend that supports OpenTelemetry-based data to monitor Docker containers efficiently. OpenTelemetry is quietly becoming the open-source standard for generating and collecting telemetry data.
A Brief Overview of OpenTelemetry
OpenTelemetry is a set of APIs, SDKs, libraries, and integrations aiming to standardize the generation, collection, and management of telemetry data(logs, metrics, and traces). It is backed by the Cloud Native Computing Foundation and is the leading open-source project in the observability domain.
The data you collect with OpenTelemetry is vendor-agnostic and can be exported in many formats. OpenTelemetry provides a tool called OpenTelemetry collector that we will use to collect Docker container metrics.
What is OpenTelemetry Collector?
OpenTelemetry Collector is a stand-alone service provided by OpenTelemetry. It can be used as a telemetry-processing system with a lot of flexible configurations to collect and manage telemetry data.
It can understand different data formats and send it to different backends, making it a versatile tool for building observability solutions.
Read our complete guide on OpenTelemetry Collector
How does OpenTelemetry Collector collect data?
A receiver is how data gets into the OpenTelemetry Collector. Receivers are configured via YAML under the top-level receivers tag. There must be at least one enabled receiver for a configuration to be considered valid.
Here’s an example of an otlp receiver:
receivers:
  otlp:
    protocols:
      grpc:
      http:
An OTLP receiver can receive data via gRPC or HTTP using the OTLP format. There are advanced configurations that you can enable via the YAML file.
Here’s a sample configuration for an otlp receiver.
receivers:
  otlp:
    protocols:
      http:
        endpoint: "localhost:4318"
        cors:
          allowed_origins:
            - http://test.com
            # Origins can have wildcards with *, use * by itself to match any origin.
            - https://*.example.com
          allowed_headers:
            - Example-Header
          max_age: 7200
You can find more details on advanced configurations for the OTLP receiver.
After configuring a receiver, you must enable it. Receivers are enabled via pipelines within the service section. A pipeline consists of a set of receivers, processors, and exporters.
The following is an example pipeline configuration:
service:
  pipelines:
    metrics:
      receivers: [otlp, prometheus]
      exporters: [otlp, prometheus]
    traces:
      receivers: [otlp, jaeger]
      processors: [batch]
      exporters: [otlp, zipkin]
Pre-requisites
In order to gather metrics from Docker containers, we would first require a Docker client to be installed. Once done, we can run a few simple containers and try to gather metrics related to them. This section guides you through quick database setup using Docker and Docker-Compose. You can skip the setup if you already have Docker running on your system and have a few containers started.
The below links can help you with the Docker installation:
Once the Docker container is installed, start a few containers using the below commands:
docker run nginx:latest -p 8080:80 -d
docker run httpd:latest -p 8081:80 -d
docker run mysql:latest -e MYSQL_ROOT_PASSWORD=mysecretpassword -p 3306:3306 -d
The above commands will start 3 containers on your system to allow us to gather some metrics when we start the OpenTelemetry collector. Next, let us start with the setup of OpenTelemetry Collector. It is assumed that you are setting up the OpenTelemetry collector on the same machine where you are running the Docker containers.
Setting up OpenTelemetry Collector
The OpenTelemetry Collector offers various deployment options to suit different environments and preferences. It can be deployed using Docker, Kubernetes, Nomad, or directly on Linux systems. You can find all the installation options.
We are going to discuss the manual installation here and resolve any hiccups that come in the way.
Step 1 - Downloading OpenTelemetry Collector
Download the appropriate binary package for your Linux or macOS distribution from the OpenTelemetry Collector releases page. We are using the latest version available at the time of writing this tutorial.
For MACOS (arm64):
curl --proto '=https' --tlsv1.2 -fOL https://github.com/open-telemetry/opentelemetry-collector-releases/releases/download/v0.116.0/otelcol-contrib_0.116.0_darwin_arm64.tar.gz
Step 2 - Extracting the package
Create a new directory named otelcol-contrib and then extract the contents of the otelcol-contrib_0.116.0_darwin_arm64.tar.gz archive into this newly created directory with the following command:
mkdir otelcol-contrib && tar xvzf otelcol-contrib_0.116.0_darwin_arm64.tar.gz -C otelcol-contrib
Step 3 - Setting up the configuration file
Create a config.yaml file in the otelcol-contrib folder. This configuration file will enable the collector to connect with the Docker socket and have other settings like at what frequency you want to monitor the containers. The docker stats receiver communicates directly with the docker socket that provides the metrics and other relevant details for monitoring.
The configuration file should be created in the same directory where you unpack the otel-collector-contrib binary. In case you have globally installed the binary, it is ok to create on any path.
receivers:
  otlp:
    protocols:
      grpc:
      http:
  docker_stats:
    endpoint: unix:///var/run/docker.sock
    collection_interval: 30s
    timeout: 10s
    api_version: 1.24
    metrics:
      container.uptime:
        enabled: true
      container.restarts:
        enabled: true
      container.network.io.usage.rx_errors:
        enabled: true
      container.network.io.usage.tx_errors:
        enabled: true
      container.network.io.usage.rx_packets:
        enabled: true
      container.network.io.usage.tx_packets:
        enabled: true
processors:
  batch:
    send_batch_size: 1000
    timeout: 10s
  resourcedetection/env:
    detectors: [env]
    timeout: 2s
    override: false
  resourcedetection/system:
    detectors: ["system"]
    system:
      hostname_sources: ["dns", "os"]
  resourcedetection/docker:
    detectors: [env, docker]
    timeout: 2s
    override: false
exporters:
  otlp:
    endpoint: "ingest.{region}.signoz.cloud:443"
    tls:
      insecure: false
    headers:
      signoz-ingestion-key: "{signoz-token}"
  debug:
    verbosity: normal

service:
  pipelines:
    metrics:
      receivers: [otlp, docker_stats]
      processors: [resourcedetection/docker, batch]
      exporters: [otlp]
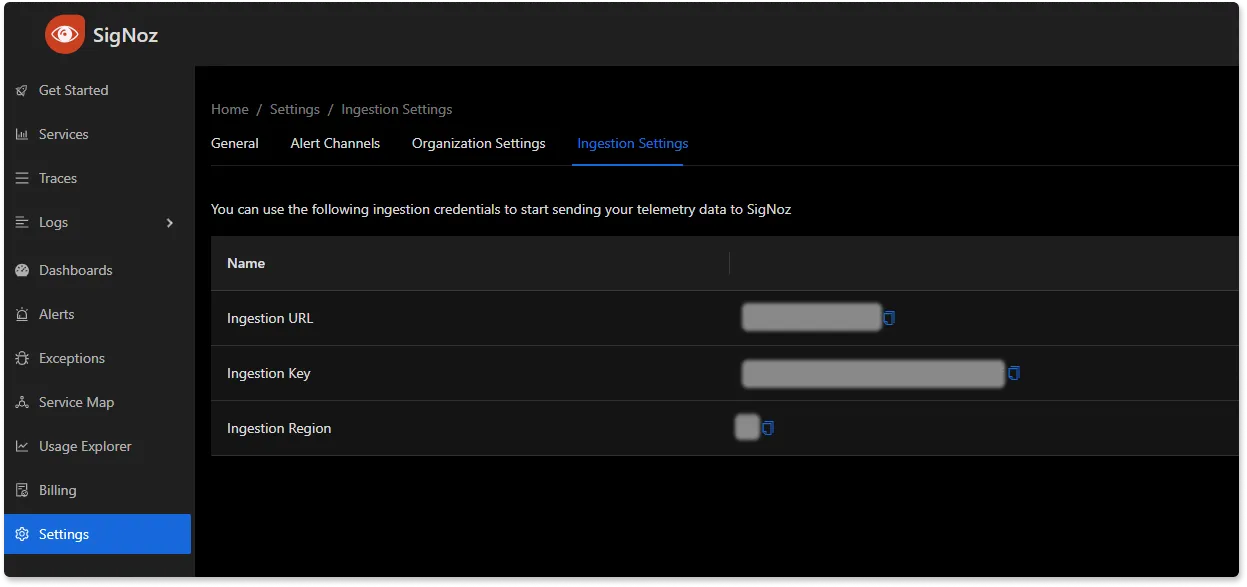
You would need to replace region and signoz-token in the above file with the region of your choice (for SigNoz Cloud) and token obtained from SigNoz Cloud → Settings → Ingestion Settings.
The above configuration additionally contains a resource detection process that helps identify the host attributes better. The docker socket path remains the same for UNIX-based systems; however, for any other systems, you can refer to this documentation to know more.
This article focues on gathering Docker metrics via the OTel Collector. If you wish to understand how to run the Collector inside Docker in more detail, check out our detailed guide on the topic.
Step 4 - Running the collector service
Every Collector release includes an otelcol executable that you can run. Since we’re done with configurations, we can now run the collector service with the following command.
From the otelcol-contrib, run the following command:
./otelcol-contrib --config ./config.yaml
If you want to run it in the background -
./otelcol-contrib --config ./config.yaml &> otelcol-output.log & echo "$\!" > otel-pid
Step 5 - Debugging the output
If you want to see the output of the logs, we’ve just set it up for the background process. You may look it up with:
tail -f -n 50 otelcol-output.log
tail 50 will give the last 50 lines from the file otelcol-output.log
You can stop the collector service with the following command:
kill "$(< otel-pid)"
You should start seeing the metrics on your SigNoz Cloud UI in about 30 seconds. You can now use these metrics to build custom dashboards to monitor your Docker containers.
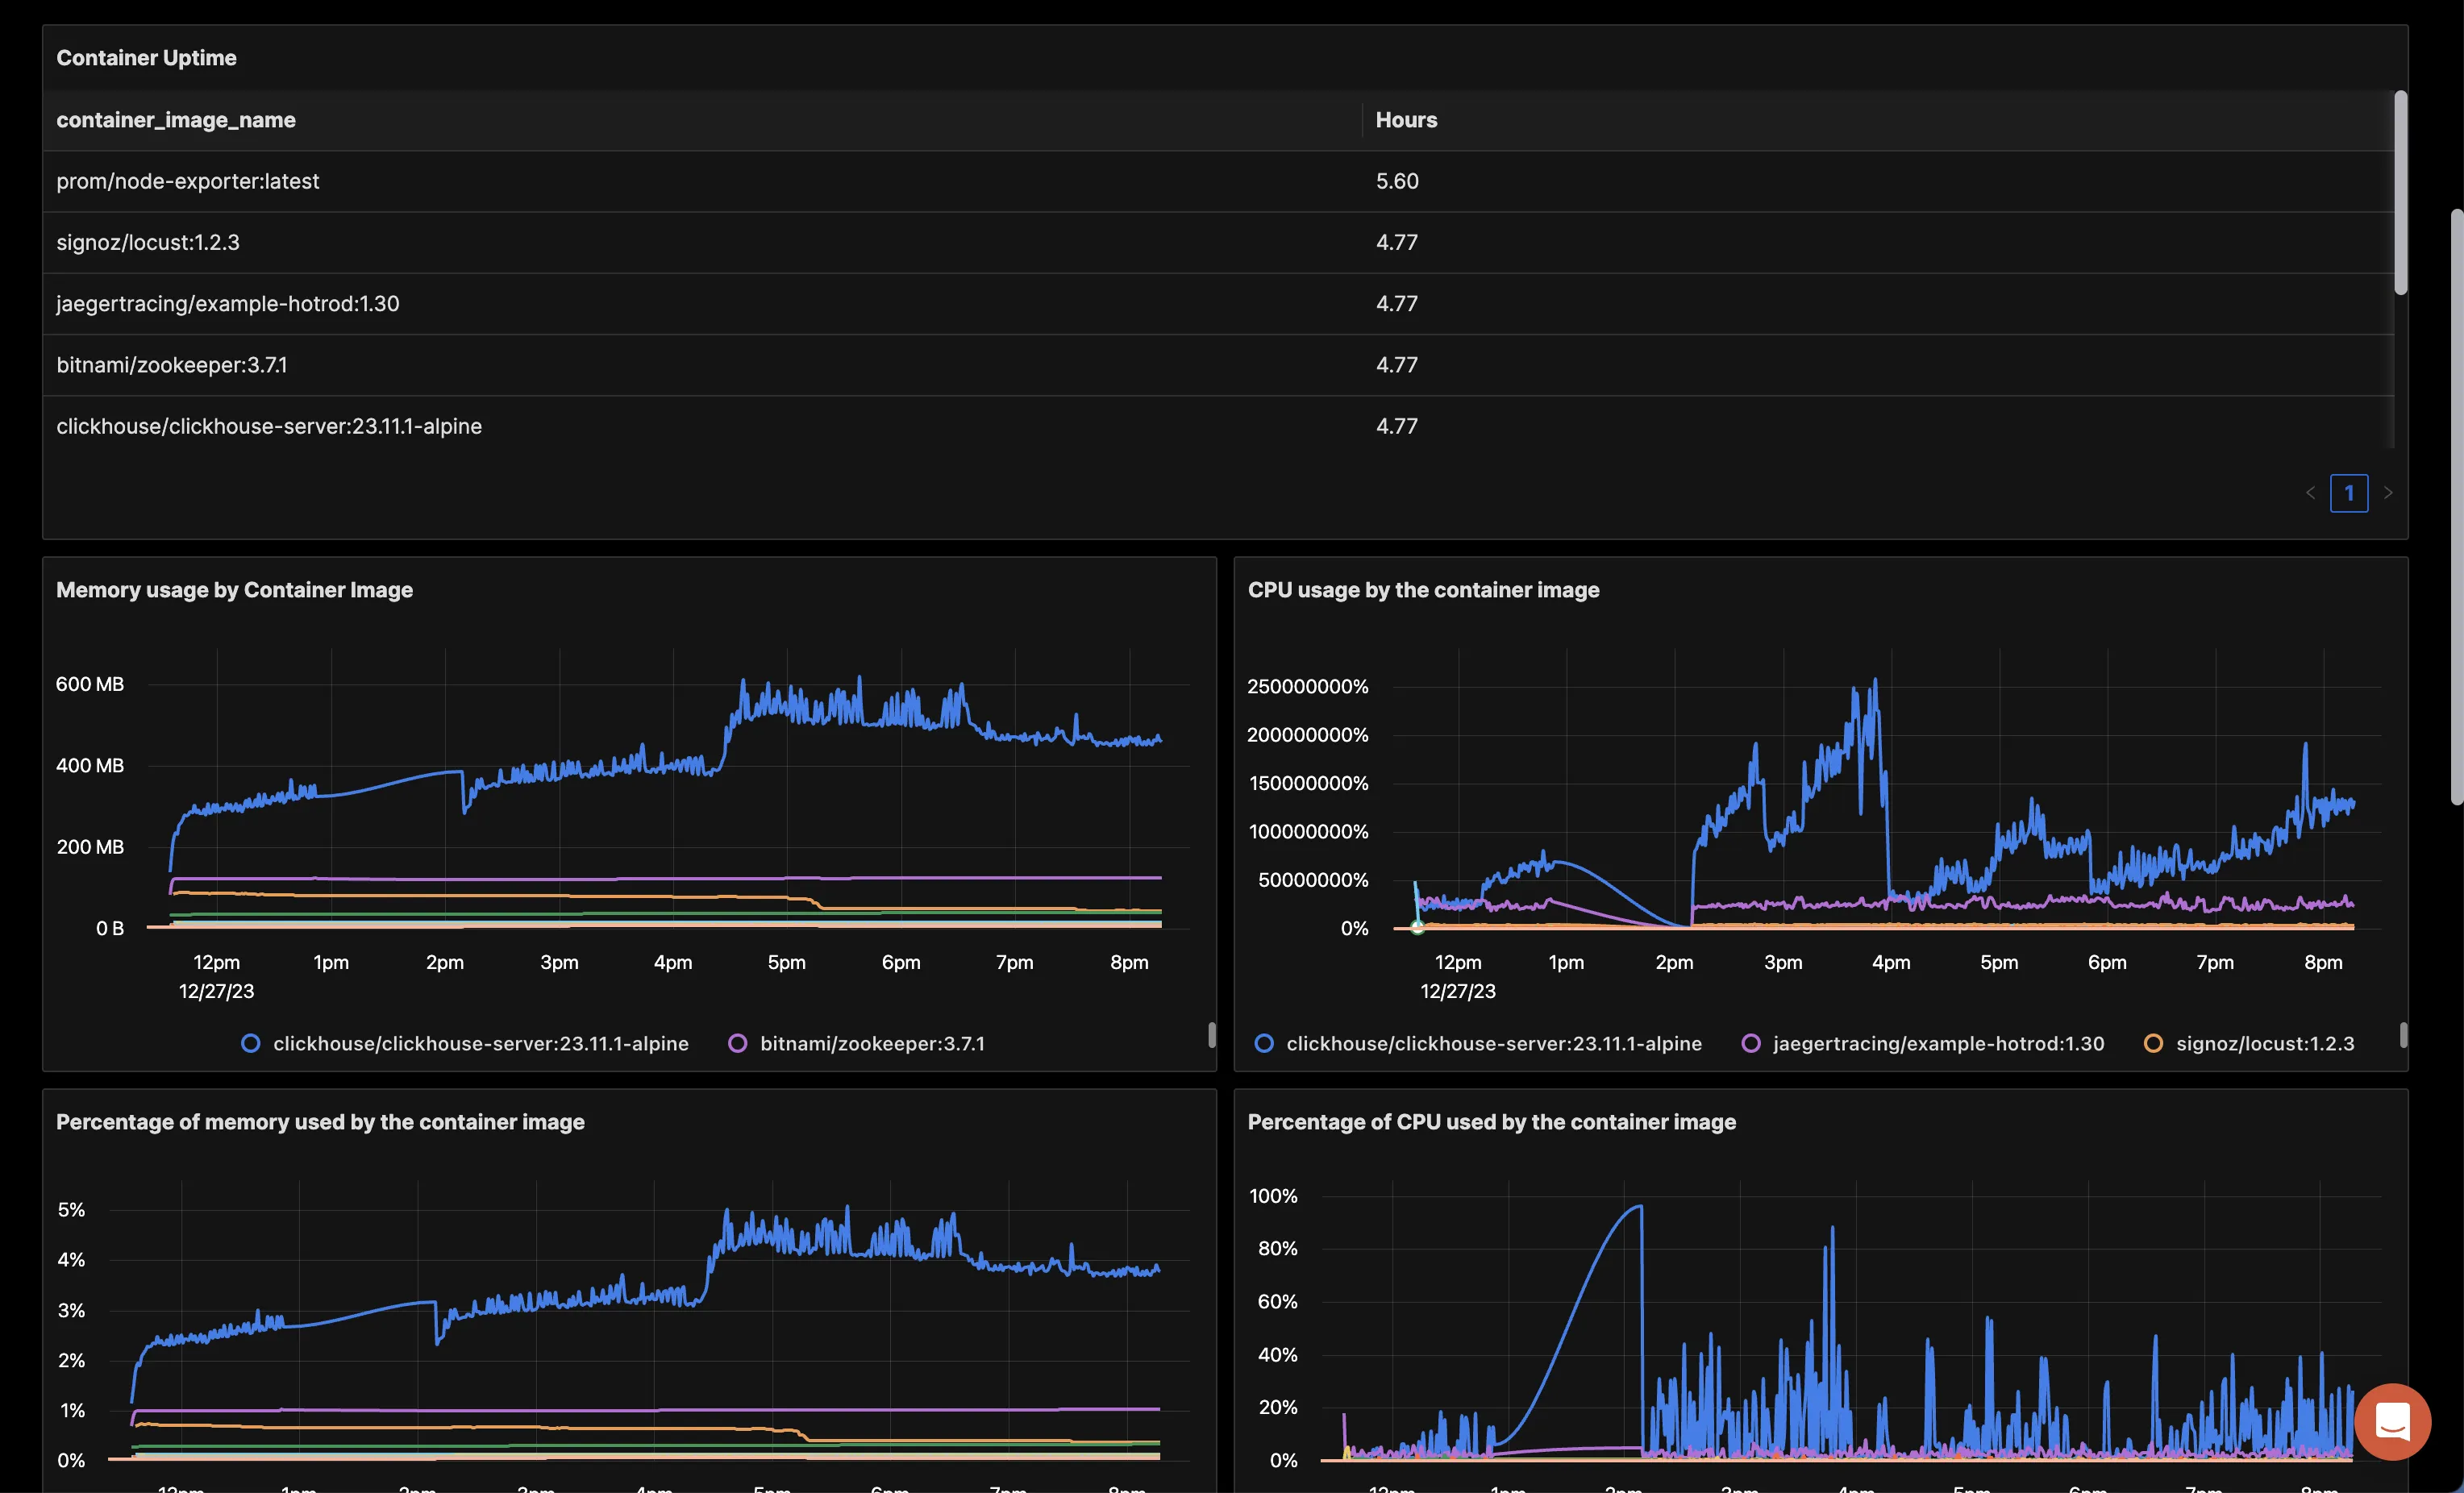
Monitoring Docker Metrics in the SigNoz Dashboard
Once the above setup is done, you will be able to access the metrics in the SigNoz dashboard. You can go to the Dashboards tab and try adding a new panel. You can learn how to create dashboards in SigNoz.
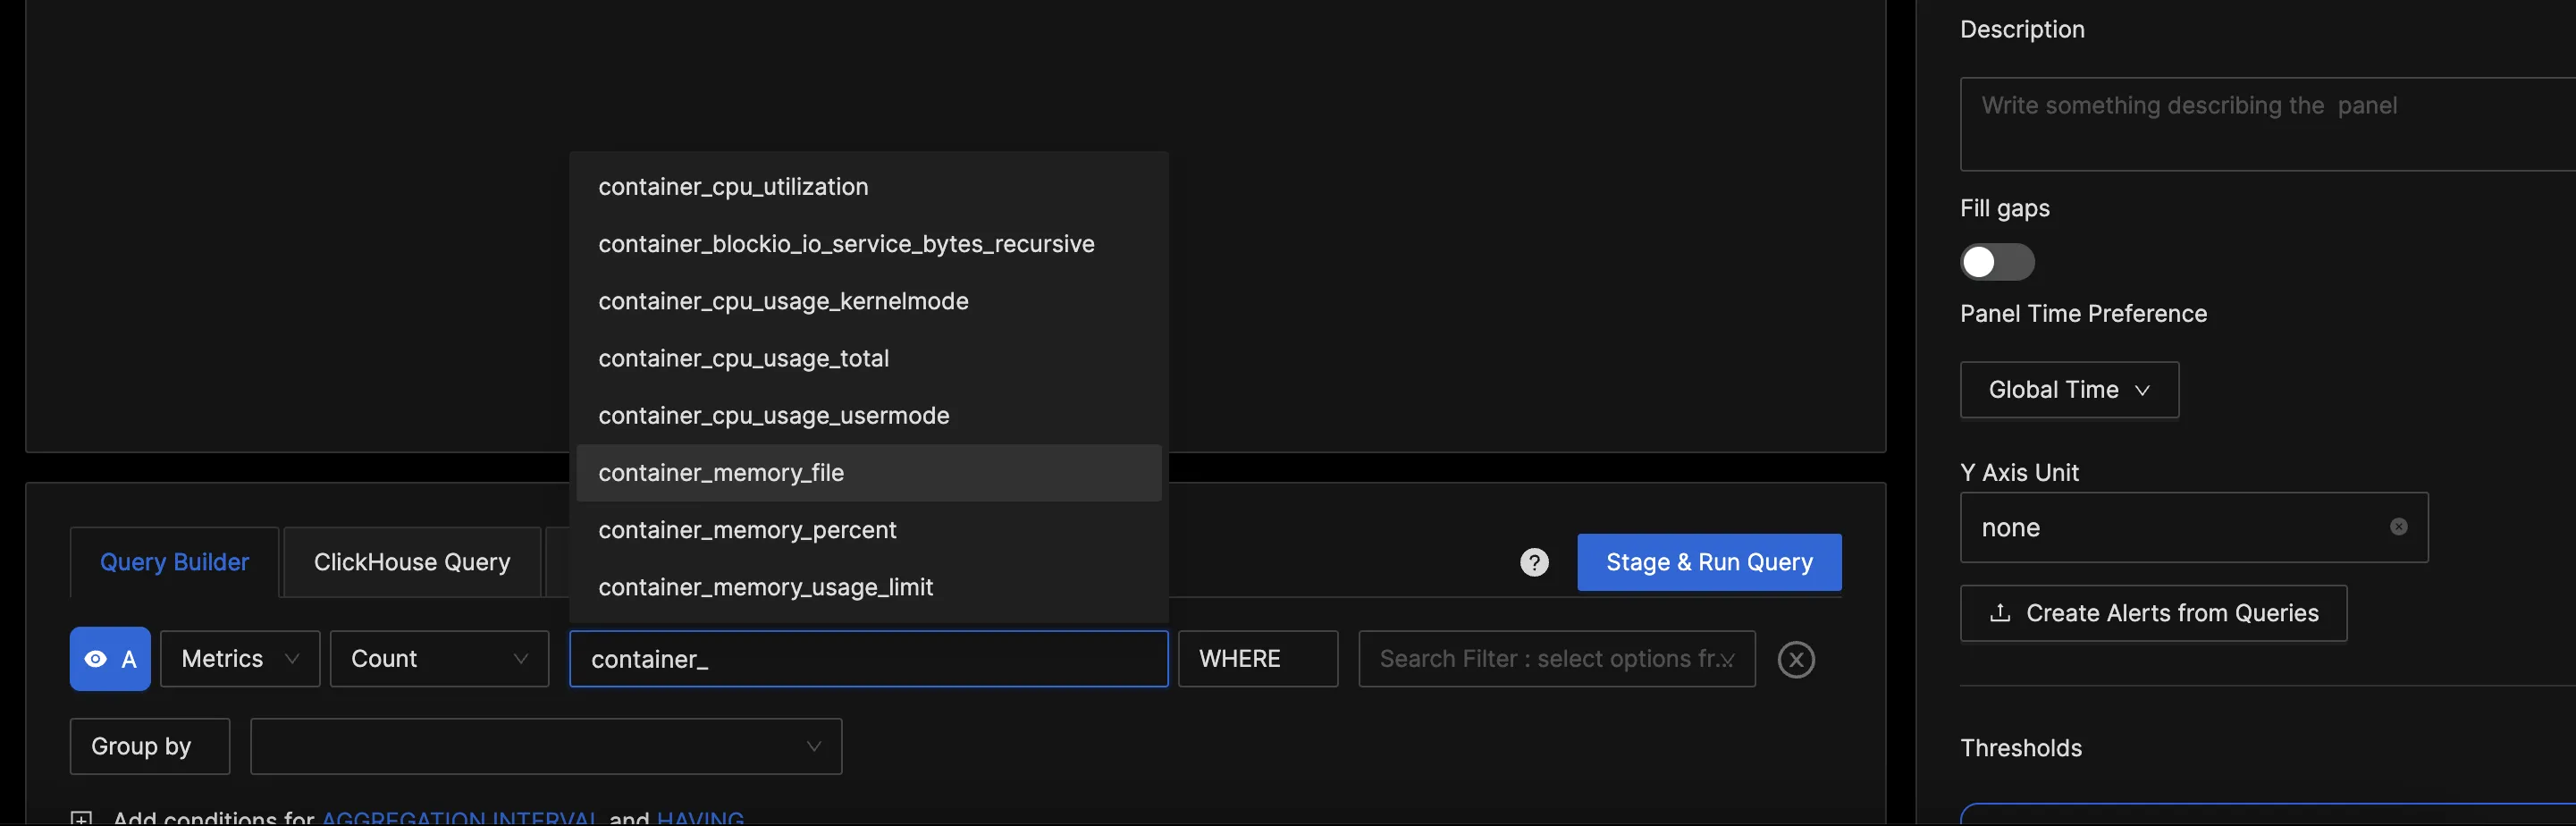
You can easily create charts with query builder in SigNoz. Here are the steps to add a new panel to the dashboard.
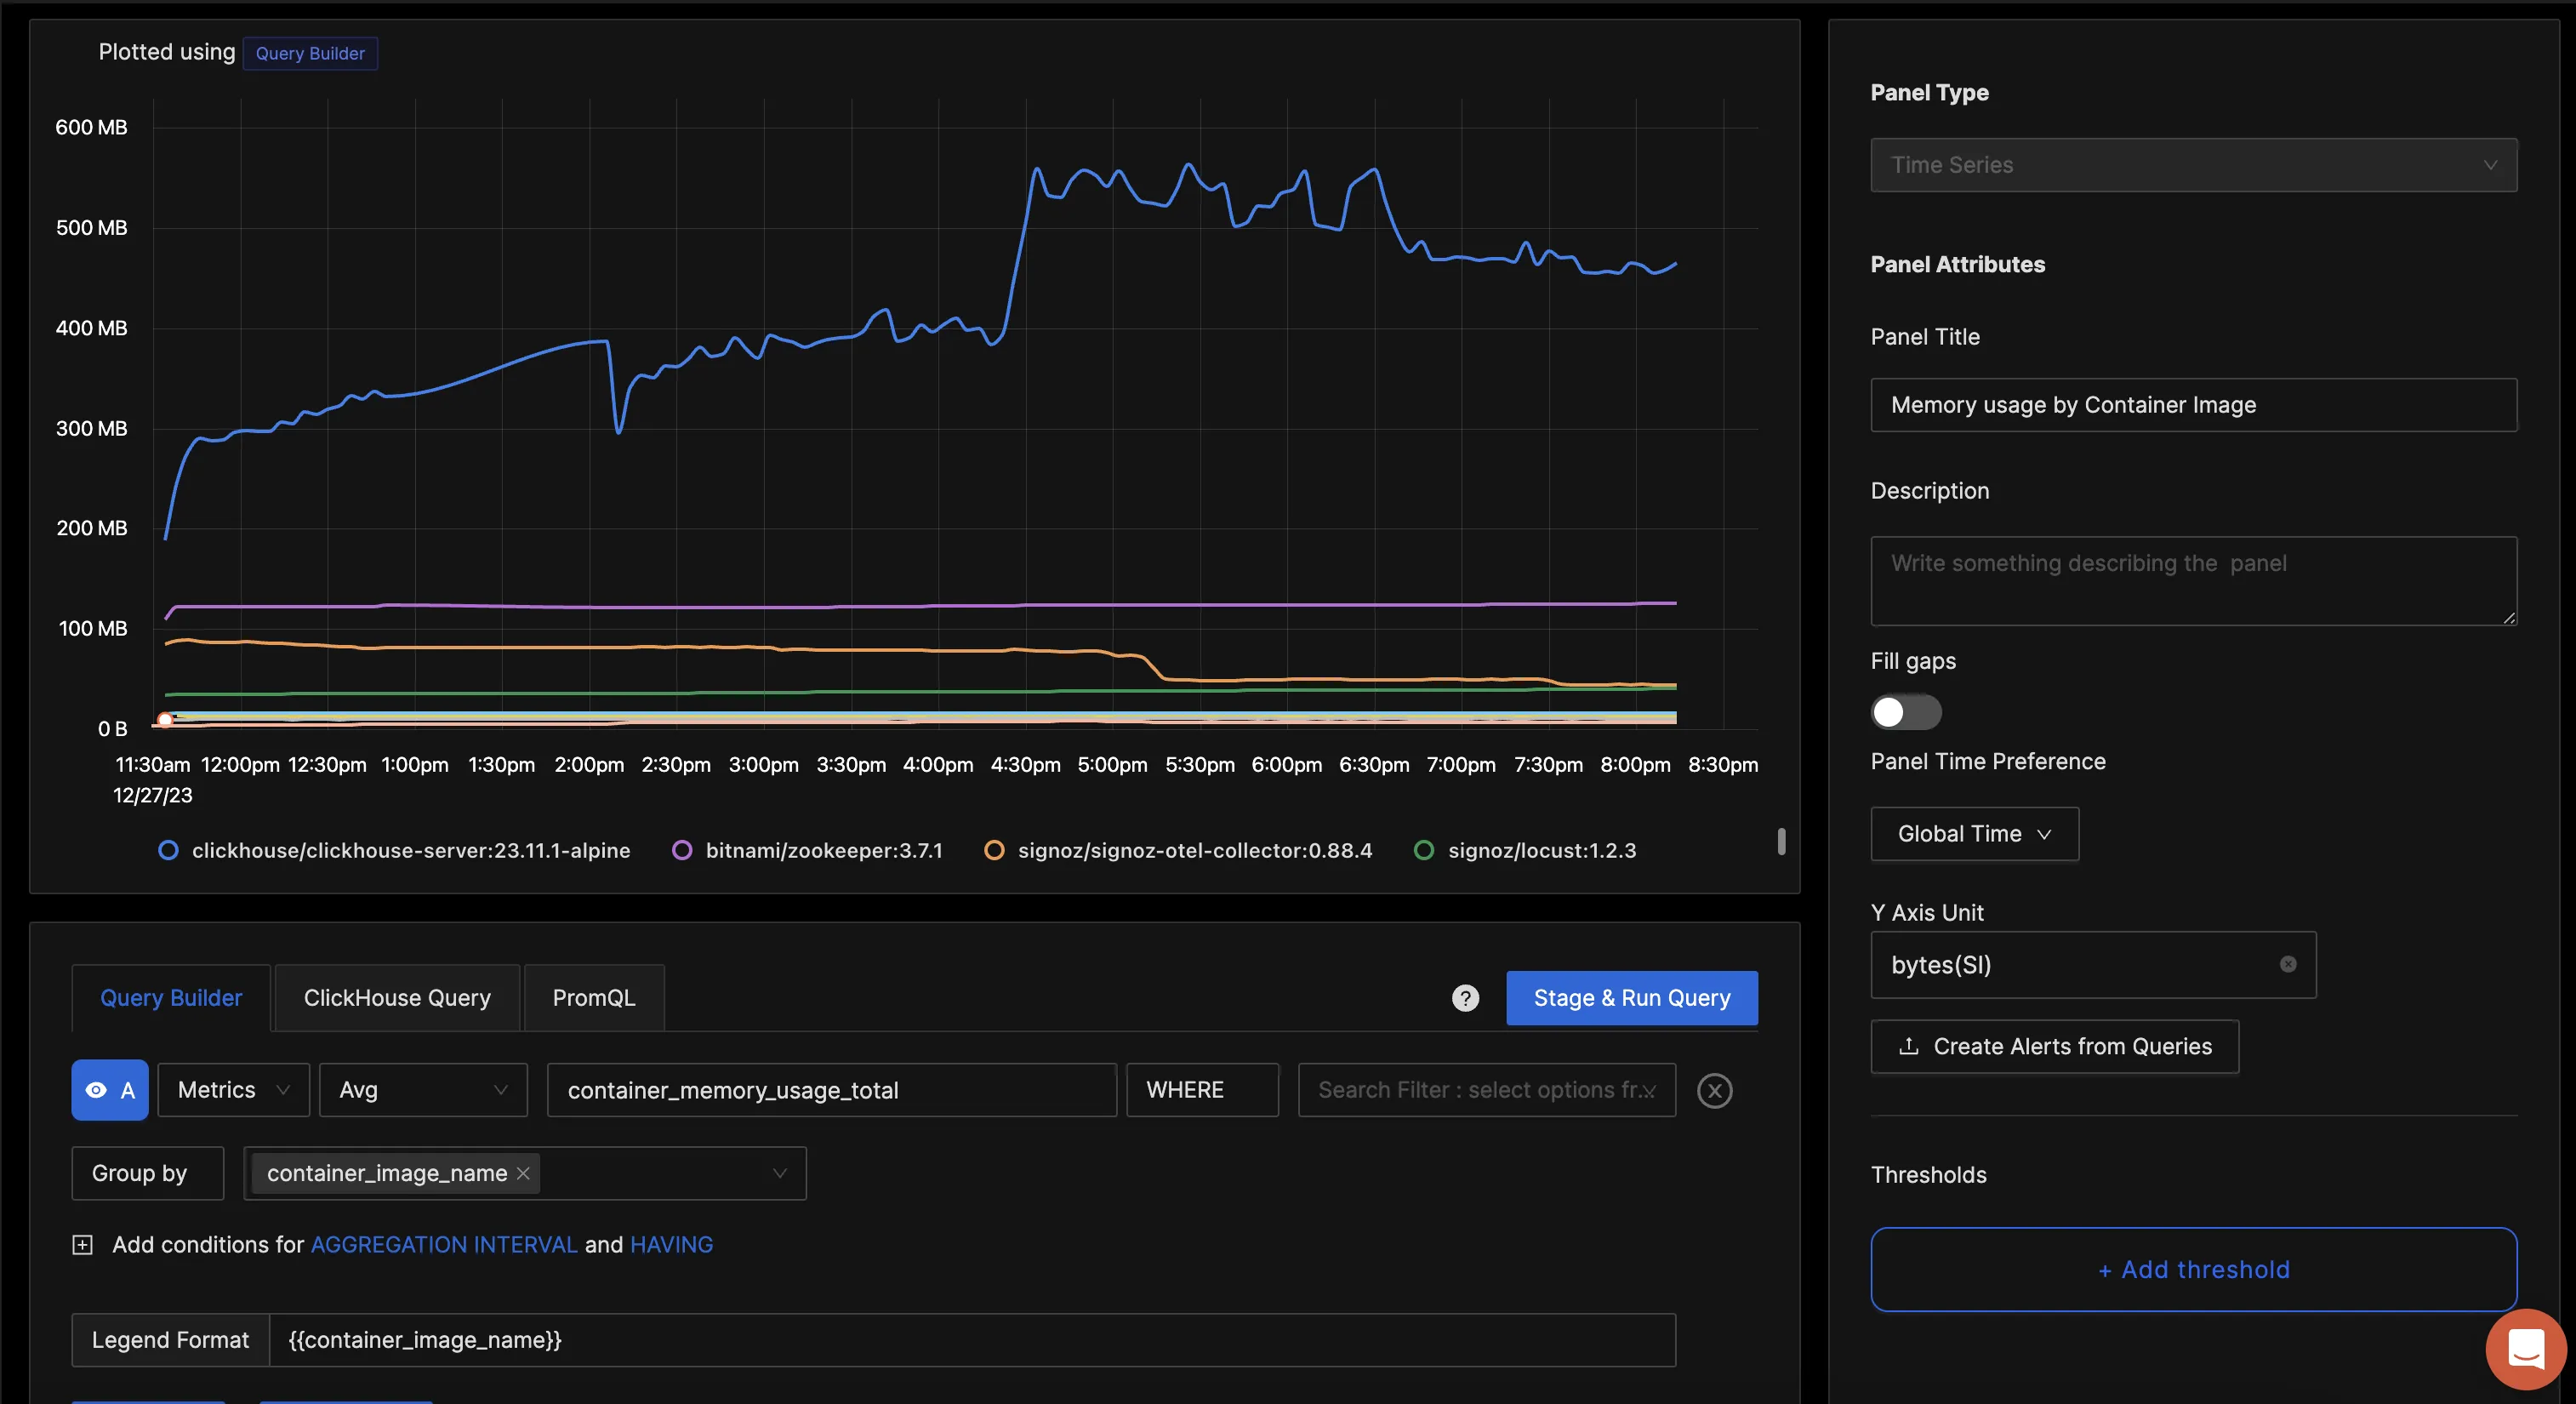
You can build a complete dashboard around various metrics emitted. Here’s a look at a sample dashboard we built out using the metrics collected. You can get started quickly with this dashboard by using this dashboard JSON.
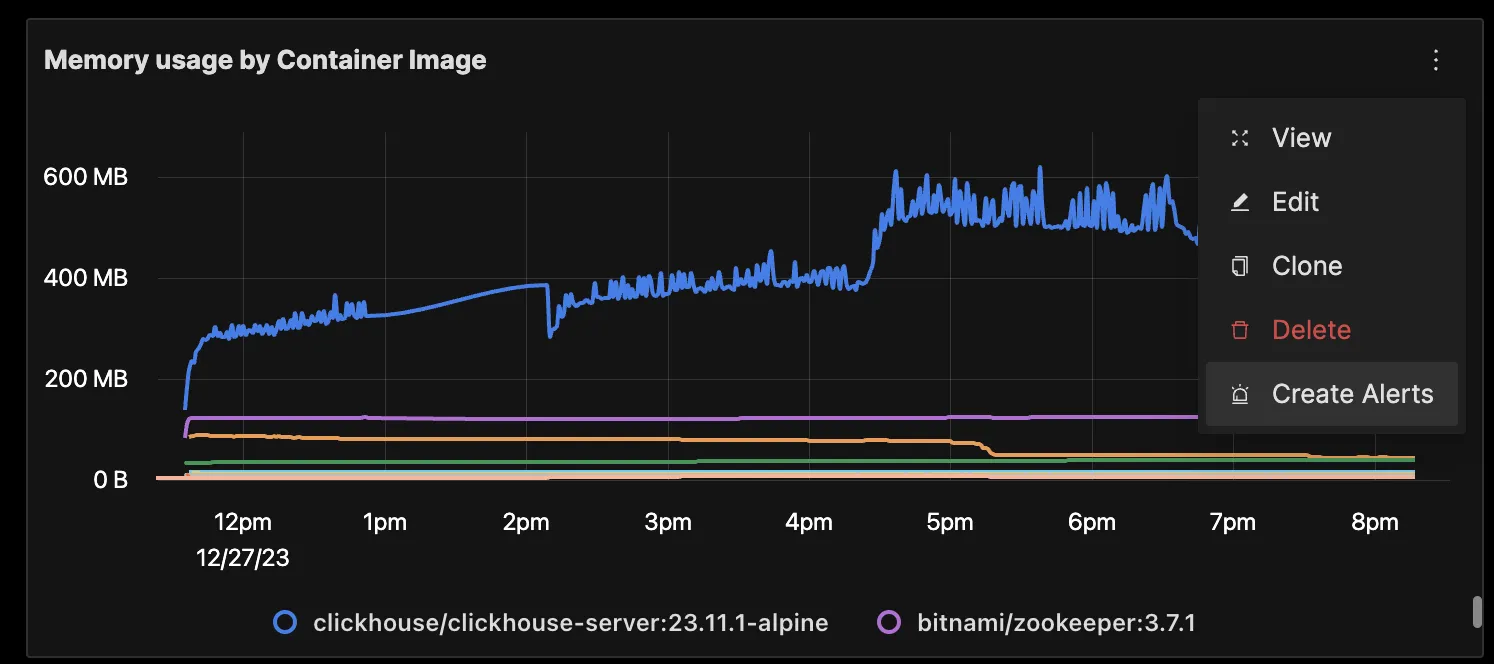
You can also create alerts on any metric. Learn how to create alerts in SigNoz.
Reference: Docker container metrics and labels collected by OpenTelemetry Collector
| Name | Description | Availability (cgroup v1/v2) | Type |
|---|---|---|---|
| container.blockio.io_service_bytes_recursive | Number of bytes transferred to/from the disk by the group and descendant groups. | Both | Sum |
| container.cpu.usage.kernelmode | Time spent by tasks of the cgroup in kernel mode (Linux). Time spent by all container processes in kernel mode (Windows). | Both | Sum |
| container.cpu.usage.total | Total consumed CPU time | Both | Sum |
| container.cpu.usage.usermode | Time spent by tasks of the cgroup in user mode (Linux). Time spent by all container processes in user mode (Windows). | Both | Sum |
| container.cpu.utilization | Percentage usage of CPU | Both | Gauge |
| container.memory.file | Total memory used | cgroup v2 | Sum |
| container.memory.percent | Percentage of memory used. | cgroup v1 | Gauge |
| container.memory.total_cache | Total cache memory used by the processes of the cgroup | Both | Sum |
| container.memory.usage.limit | Memory limits for the container (if specified) | Both | Sum |
| container.memory.usage.total | Memory usage of the containers excluding cache | Both | Sum |
| container.network.io.usage.rx_bytes | Bytes received by the container | Both | Sum |
| container.network.io.usage.rx_dropped | Incoming packets dropped by the container | Both | Sum |
| container.network.io.usage.tx_bytes | Bytes transmitted by the container | Both | Sum |
| container.network.io.usage.tx_dropped | Outgoing packets that got dropped | Both | Sum |
Optional Metrics
The following metrics are not emitted by default. Each of them can be enabled by applying the following configuration:
metrics:
  <metric_name>:
    enabled: true
| Name | Description | Availability (cgroup v1/v2) | Type |
|---|---|---|---|
| container.blockio.io_merged_recursive | Number of bios/requests merged into requests belonging to this cgroup and its descendant cgroups | cgroup v1 | Sum |
| container.blockio.io_queued_recursive | Number of requests queued up for this cgroup and its descendant cgroups | cgroup v1 | Sum |
| container.blockio.io_service_time_recursive | Total amount of time in nanoseconds between request dispatch and request completion for the IOs done by this cgroup and descendant cgroups | cgroup v1 | Sum |
| container.blockio.io_serviced_recursive | Number of IOs (bio) issued to the disk by the group and descendant groups | cgroup v1 | Sum |
| container.blockio.io_time_recursive | Disk time allocated to cgroup (and descendant cgroups) per device in milliseconds | cgroup v1 | Sum |
| container.blockio.io_wait_time_recursive | Total amount of time the IOs for this cgroup (and descendant cgroups) spent waiting in the scheduler queues for service | cgroup v1 | Sum |
| container.blockio.sectors_recursive | Number of sectors transferred to/from disk by the group and descendant groups | cgroup v1 | Sum |
| container.cpu.limit | CPU limit set for the container. | Both | Sum |
| container.cpu.shares | CPU shares set for the container. | Both | Sum |
| container.cpu.throttling_data.periods | Number of periods with throttling active | Both | Sum |
| container.cpu.throttling_data.throttled_periods | Number of periods when the container hits its throttling limit. | Both | Sum |
| container.cpu.throttling_data.throttled_time | Aggregate time the container was throttled | Both | Sum |
| container.cpu.usage.percpu | Per-core CPU usage by the container | cgroup v1 | Sum |
| container.cpu.usage.system | System CPU usage, as reported by docker | Both | Sum |
| container.memory.active_anon | The amount of anonymous memory that has been identified as active by the kernel. | Both | Sum |
| container.memory.active_file | Cache memory that has been identified as active by the kernel. | Both | Sum |
| container.memory.anon | Amount of memory used in anonymous mappings such as brk(), sbrk(), and mmap(MAP_ANONYMOUS) (Only available with cgroups v2). | cgroup v2 | Sum |
| container.memory.cache | The amount of memory used by the processes of this control group that can be associated precisely with a block on a block device | cgroup v1 | Sum |
| container.memory.dirty | Bytes that are waiting to get written back to the disk, from this cgroup | cgroup v1 | Sum |
| container.memory.hierarchical_memory_limit | The maximum amount of physical memory that can be used by the processes of this control group | cgroup v1 | Sum |
| container.memory.hierarchical_memsw_limit | The maximum amount of RAM + swap that can be used by the processes of this control group | cgroup v1 | Sum |
| container.memory.inactive_anon | The amount of anonymous memory that has been identified as inactive by the kernel. | Both | Sum |
| container.memory.inactive_file | Cache memory that has been identified as inactive by the kernel. | Both | Sum |
| container.memory.mapped_file | Indicates the amount of memory mapped by the processes in the control group | cgroup v1 | Sum |
| container.memory.pgfault | Indicate the number of times that a process of the cgroup triggered a page fault. | Both | Sum |
| container.memory.pgmajfault | Indicate the number of times that a process of the cgroup triggered a major fault. | Both | Sum |
| container.memory.pgpgin | Number of pages read from disk by the cgroup | cgroup v1 | Sum |
| container.memory.pgpgout | Number of pages written to disk by the cgroup | cgroup v1 | Sum |
| container.memory.rss | The amount of memory that doesn’t correspond to anything on disk: stacks, heaps, and anonymous memory maps | cgroup v1 | Sum |
| container.memory.rss_huge | Number of bytes of anonymous transparent hugepages in this cgroup | cgroup v1 | Sum |
| container.memory.total_active_anon | The amount of anonymous memory that has been identified as active by the kernel. Includes descendant cgroups | cgroup v1 | Sum |
| container.memory.total_active_file | Cache memory that has been identified as active by the kernel. Includes descendant cgroups | cgroup v1 | Sum |
| container.memory.total_dirty | Bytes that are waiting to get written back to the disk, from this cgroup and descendants | cgroup v1 | Sum |
| container.memory.total_inactive_anon | The amount of anonymous memory that has been identified as inactive by the kernel. Includes descendant cgroups | cgroup v1 | Sum |
| container.memory.total_inactive_file | Cache memory that has been identified as inactive by the kernel. Includes descendant cgroups | cgroup v1 | Sum |
| container.memory.total_mapped_file | Indicates the amount of memory mapped by the processes in the control group and descendant groups | cgroup v1 | Sum |
| container.memory.total_pgfault | Indicate the number of times that a process of the cgroup (or descendant cgroups) triggered a page fault | cgroup v1 | Sum |
| container.memory.total_pgmajfault | Indicate the number of times that a process of the cgroup (or descendant cgroups) triggered a major fault | cgroup v1 | Sum |
| container.memory.total_pgpgin | Number of pages read from disk by the cgroup and descendant groups | cgroup v1 | Sum |
| container.memory.total_pgpgout | Number of pages written to disk by the cgroup and descendant groups | cgroup v1 | Sum |
| container.memory.total_rss | The amount of memory that doesn’t correspond to anything on disk: stacks, heaps, and anonymous memory maps. Includes descendant cgroups | cgroup v1 | Sum |
| container.memory.total_rss_huge | Number of bytes of anonymous transparent hugepages in this cgroup and descendant cgroups | cgroup v1 | Sum |
| container.memory.total_unevictable | The amount of memory that cannot be reclaimed. Includes descendant cgroups | cgroup v1 | Sum |
| container.memory.total_writeback | Number of bytes of file/anon cache that are queued for syncing to disk in this cgroup and descendants | cgroup v1 | Sum |
| container.memory.unevictable | The amount of memory that cannot be reclaimed. | Both | Sum |
| container.memory.usage.max | Maximum memory usage. | Both | Sum |
| container.memory.writeback | Number of bytes of file/anon cache that are queued for syncing to disk in this cgroup | cgroup v1 | Sum |
| container.network.io.usage.rx_errors | Received network errors | Both | Sum |
| container.network.io.usage.rx_packets | Errors in received packets | Both | Sum |
| container.network.io.usage.tx_errors | Transmission errors | Both | Sum |
| container.network.io.usage.tx_packets | Packets with transmission errors | Both | Sum |
| container.pids.count | Total container PIDs | Both | Sum |
| container.pids.limit | PIDs limits | Both | Sum |
| container.restarts | Number of restarts for the container. | Both | Sum |
| container.uptime | Time elapsed since container start time. | Both | Gauge |
Attributes
The attributes collected for all the metrics are as follows:
| Name | Description | Values | Enabled |
|---|---|---|---|
| container.command_line | The full command executed by the container. | Any Str | false |
| container.hostname | The hostname of the container. | Any Str | true |
| container.id | The ID of the container. | Any Str | true |
| container.image.id | The ID of the container image. | Any Str | false |
| container.image.name | The name of the docker image in use by the container. | Any Str | true |
| container.name | The name of the container. | Any Str | true |
| container.runtime | The runtime of the container. For this receiver, it will always be 'docker'. | Any Str | true |
Conclusion
In this tutorial, you installed an OpenTelemetry collector to collect Docker container metrics and sent the collected data to SigNoz for monitoring and visualization.
Visit our complete guide on OpenTelemetry Collector to learn more about it. OpenTelemetry is quietly becoming the world standard for open-source observability, and by using it, you can have advantages like a single standard for all telemetry signals, no vendor lock-in, etc.
SigNoz is an open-source OpenTelemetry-native APM that can be used as a single backend for all your observability needs.
In case you are running containers on Kubernetes too, our guide on Kubernetes monitoring with OpenTelemetry can help you better manage and understand your K8s workloads, their lifecycles and data patterns.
Further Reading
