Complete Guide to tracing Kafka clients with OpenTelemetry in Go
OpenTelemetry can be used to trace Go applications that use Kafka to find performance issues and bugs. OpenTelemetry is an open-source project under the Cloud Native Computing Foundation (CNCF) that aims to standardize the generation and collection of telemetry data. Telemetry data includes logs, metrics, and traces.
Apache Kafka introduced the ability to add headers to Kafka messages from version 0.11 onwards. A Header is a key-value pair, and multiple headers can be included with the key, value, and timestamp in each Kafka message. OpenTelemetry provides a library through which we can add all relevant tracing metadata into headers alongside Kafka messages.
For this tutorial, we will be using the Sarama library for Apache Kafka by Shopify. Sarama is a Go library for Apache Kafka.
OpenTelemetry provides client libraries for instrumenting Sarama. You can check out the Golang implementation for OTel Sarama libraries on GitHub.
Before we demonstrate how to implement OpenTelemetry libraries for tracing Kafka clients, let’s have a brief overview of OpenTelemetry.
What is OpenTelemetry?
OpenTelemetry is an open-source vendor-agnostic set of tools, APIs, and SDKs used to instrument applications to create and manage telemetry data(logs, metrics, and traces). It aims to make telemetry data(logs, metrics, and traces) a built-in feature of cloud-native software applications.
The telemetry data is then sent to an observability tool for storage and visualization.
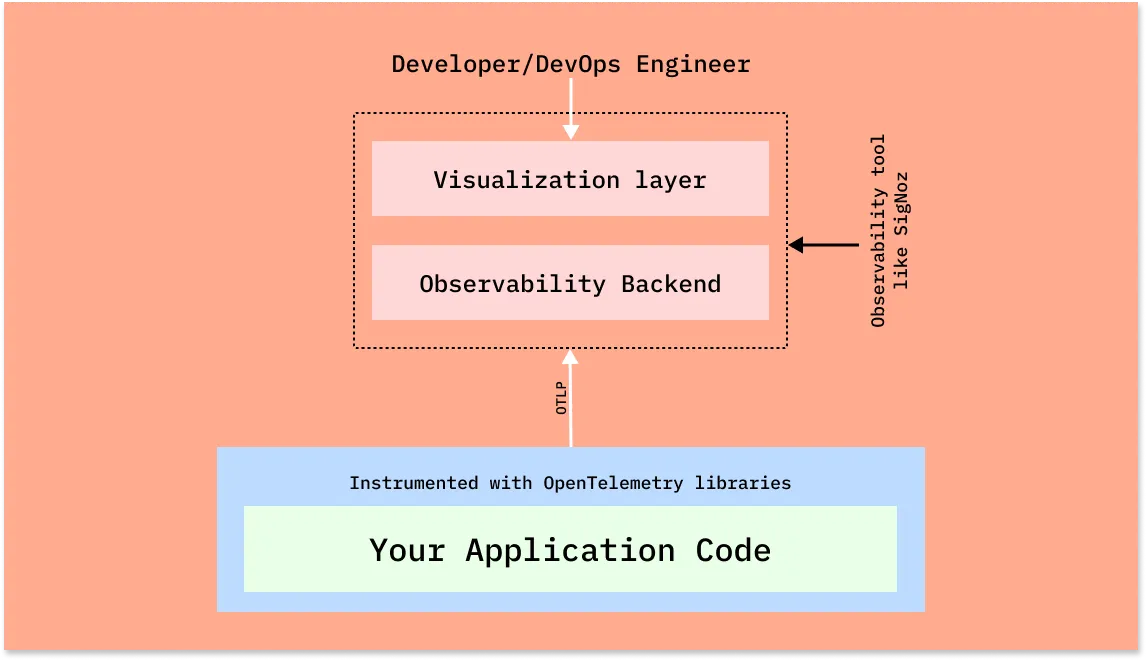
OpenTelemetry is the bedrock for setting up an observability framework. It also provides you the freedom to choose a backend analysis tool of your choice.
OpenTelemetry and SigNoz
In this article, we will use SigNoz as our backend analysis tool. SigNoz is a full-stack open-source APM tool that can be used for storing and visualizing the telemetry data collected with OpenTelemetry. It is built natively on OpenTelemetry and works on the OTLP data formats.
SigNoz provides query and visualization capabilities for the end-user and comes with out-of-box charts for application metrics and traces. It also provides logs management. With logs, metrics, and traces under a single dashboard, SigNoz is a open-stop open source observability platform.
Now let’s get down to implementing OpenTelemetry libraries for tracing Kafka clients.
Installing SigNoz
First, you need to install SigNoz so that OpenTelemetry can send the data to it.
SigNoz can be installed on macOS or Linux computers in just three steps by using a simple installation script.
The install script automatically installs Docker Engine on Linux. However, on macOS, you must manually install Docker Engine before running the install script.
git clone -b main https://github.com/SigNoz/signoz.git
cd signoz/deploy/
./install.sh
You can visit our documentation for instructions on how to install SigNoz using Docker Swarm and Helm Charts.

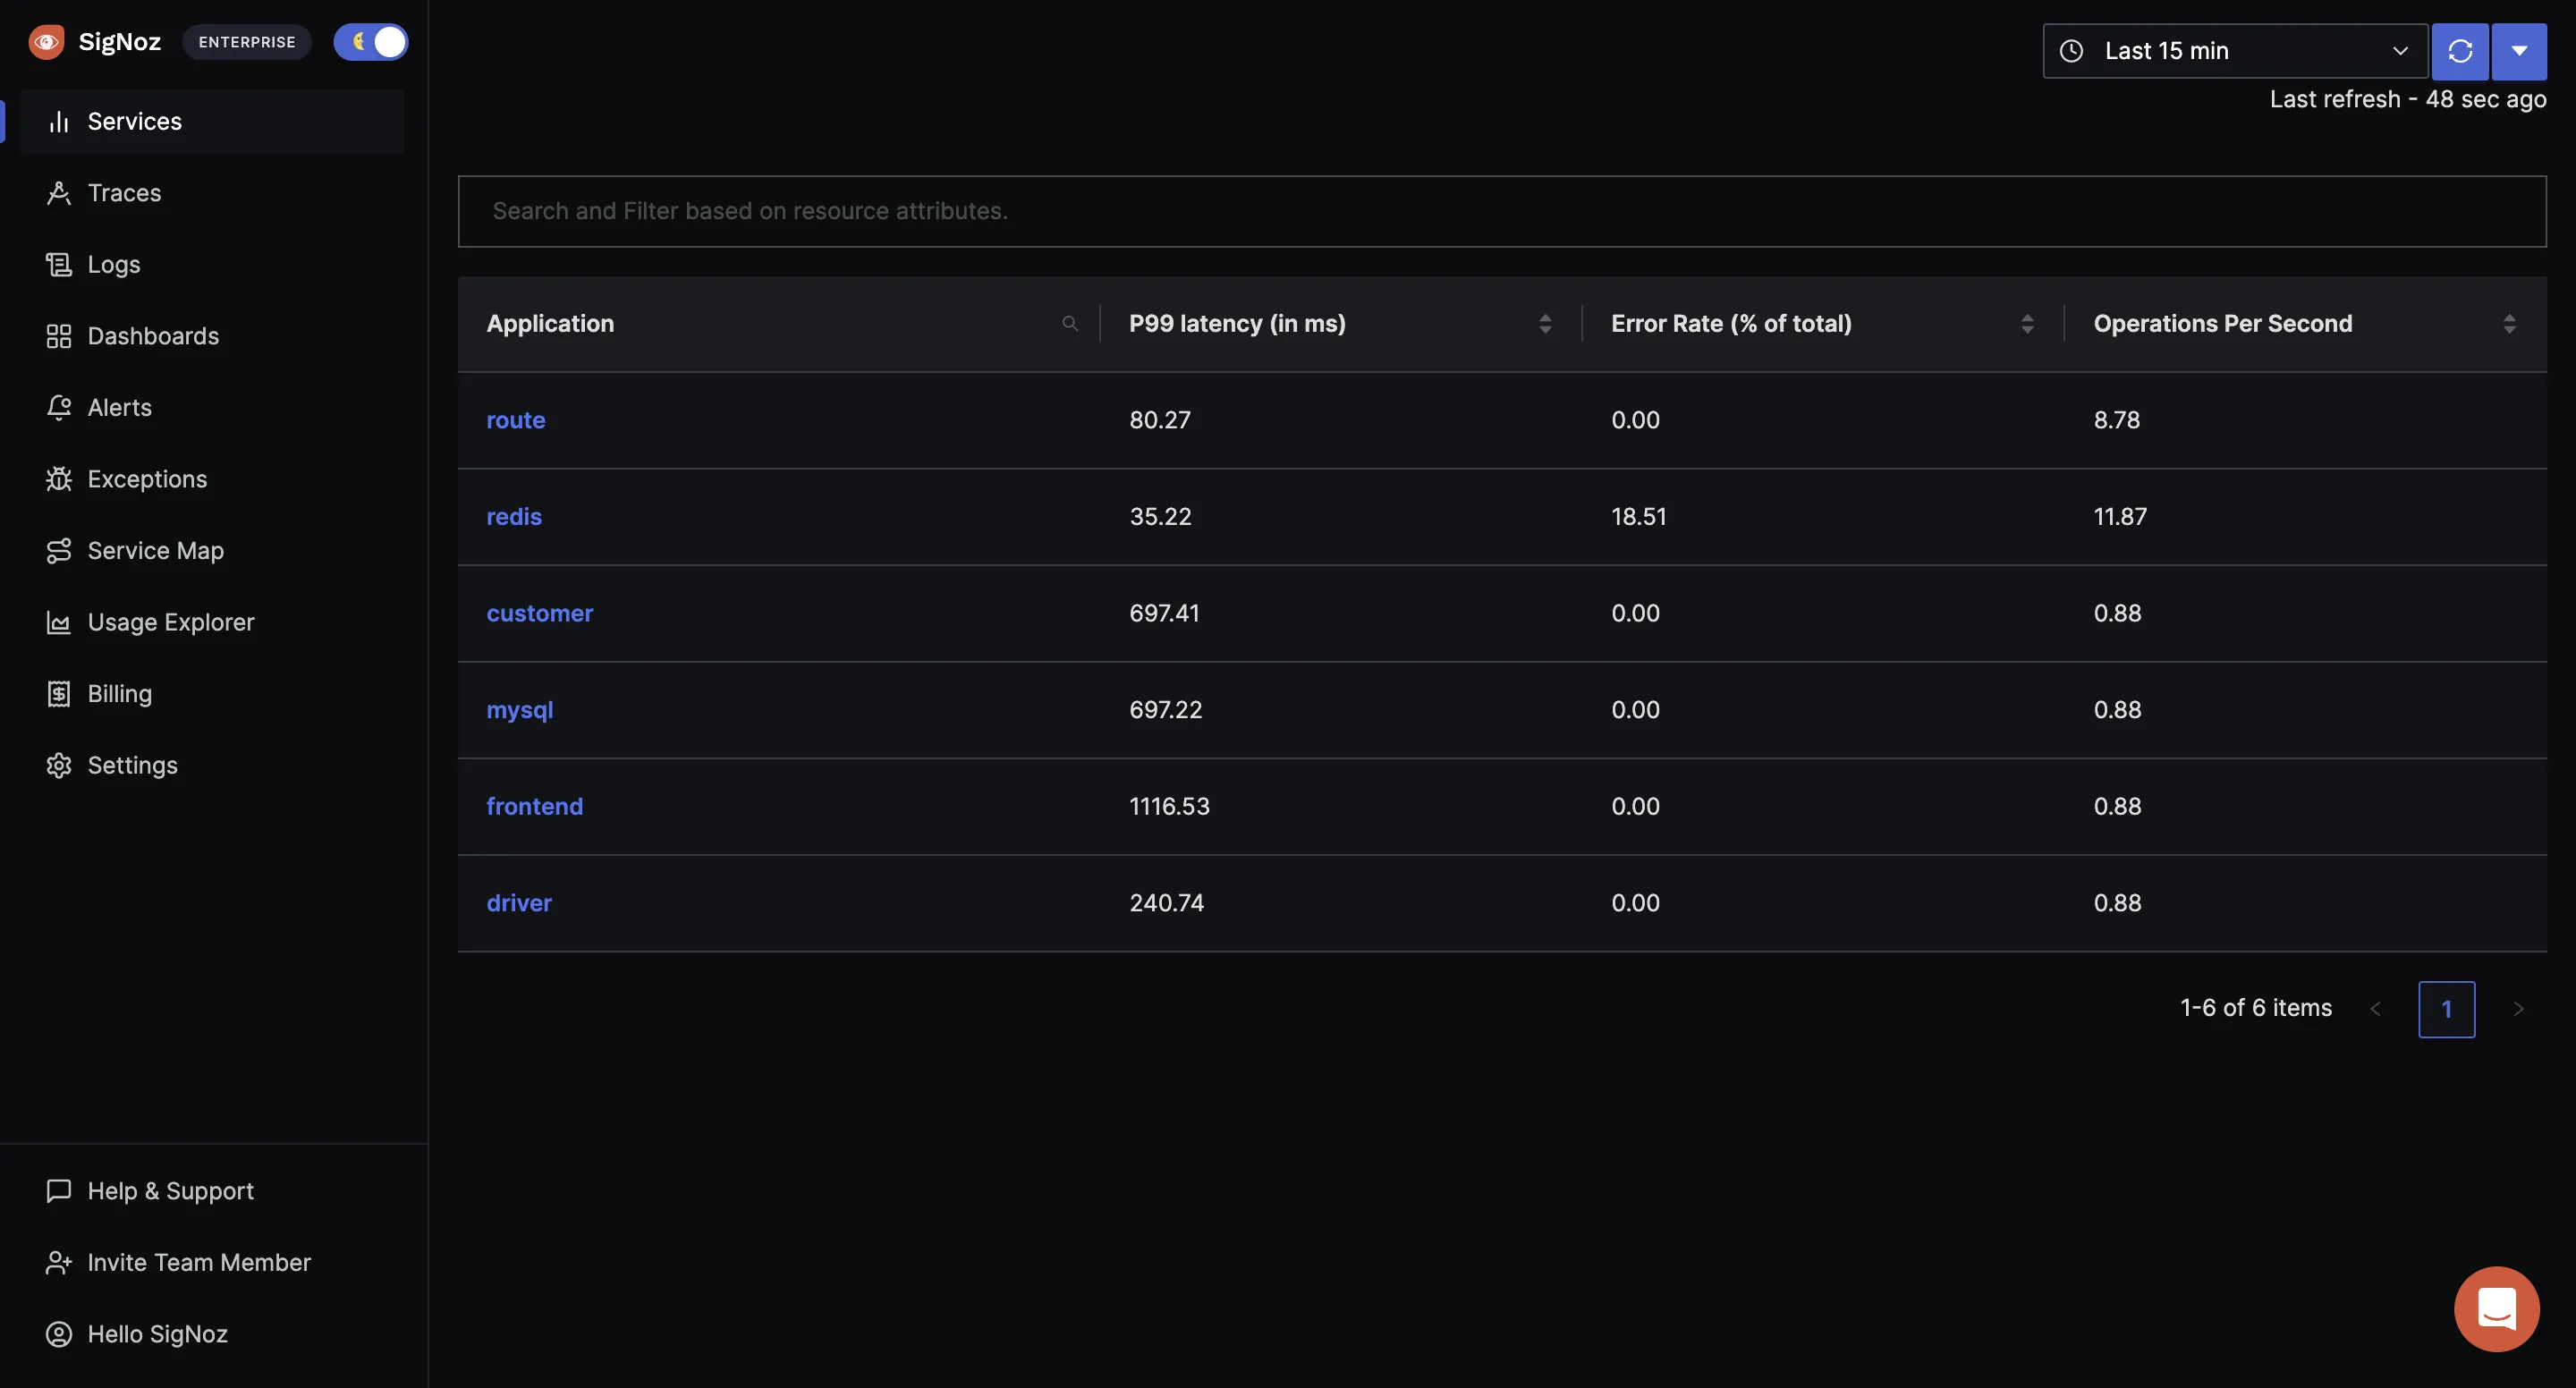
When you are done installing SigNoz, you can access the UI at http://localhost:3301/application.
Running Go Kafka application with OpenTelemetry
We will need to deploy Kafka locally before we proceed with creating the application. Create a new folder named kafka and inside it, create a file named docker-compose.yaml. Paste the below code snippet in the docker-compose.yaml file:
version: '3'
services:
  zookeeper:
    image: confluentinc/cp-zookeeper:7.0.1
    container_name: zookeeper
    environment:
      ZOOKEEPER_CLIENT_PORT: 2181
      ZOOKEEPER_TICK_TIME: 2000

  broker:
    image: confluentinc/cp-kafka:7.0.1
    container_name: broker
    ports:
      - "9092:9092"
    depends_on:
      - zookeeper
    environment:
      KAFKA_BROKER_ID: 1
      KAFKA_ZOOKEEPER_CONNECT: 'zookeeper:2181'
      KAFKA_LISTENER_SECURITY_PROTOCOL_MAP: PLAINTEXT:PLAINTEXT,PLAINTEXT_INTERNAL:PLAINTEXT
      KAFKA_ADVERTISED_LISTENERS: PLAINTEXT://localhost:9092,PLAINTEXT_INTERNAL://broker:29092
      KAFKA_OFFSETS_TOPIC_REPLICATION_FACTOR: 1
      KAFKA_TRANSACTION_STATE_LOG_MIN_ISR: 1
      KAFKA_TRANSACTION_STATE_LOG_REPLICATION_FACTOR: 1
Start Kafka and Zookeeper by using the following command:
docker compose up -d
The containers should be visible once they are running. You can check them by running docker ps.

Clone the sample Golang application repo.
git clone https://github.com/SigNoz/sample-golang-kafka-app.git
The sample app repo has two branches: main and without-instrumentation. The main branch has completed code sample. If you want to follow along with the tutorial, checkout the without-instrumentation branch after going to the root folder.
cd sample-golang-kafka-app
git checkout without-instrumentation
Create a folder named config.
mkdir config
Inside the config folder, initialize the config module by running the following commands:
cd config
go mod init github.com/SigNoz/sample-golang-kafka-app/config
Now we will initialize OpenTelemetry. Create a file named config.go and paste the following snippet:
package config

import (
	"context"
	"fmt"
	"log"
	"os"

	"go.opentelemetry.io/otel"

	"go.opentelemetry.io/otel/attribute"
	"go.opentelemetry.io/otel/exporters/otlp/otlptrace"
	"go.opentelemetry.io/otel/exporters/otlp/otlptrace/otlptracegrpc"
	"go.opentelemetry.io/otel/propagation"
	"go.opentelemetry.io/otel/sdk/resource"
	sdktrace "go.opentelemetry.io/otel/sdk/trace"
	"google.golang.org/grpc/credentials"
)

var (
	serviceName  = os.Getenv("SERVICE_NAME")
	collectorURL = os.Getenv("OTEL_EXPORTER_OTLP_ENDPOINT")
	insecure     = os.Getenv("INSECURE_MODE")
)

func InitTracer() func(context.Context) error {

	secureOption := otlptracegrpc.WithTLSCredentials(credentials.NewClientTLSFromCert(nil, ""))
	if len(insecure) > 0 {
		secureOption = otlptracegrpc.WithInsecure()
	}

	exporter, err := otlptrace.New(
		context.Background(),
		otlptracegrpc.NewClient(
			secureOption,
			otlptracegrpc.WithEndpoint(collectorURL),
		),
	)

	resources, err := resource.New(
		context.Background(),
		resource.WithAttributes(
			attribute.String("service.name", serviceName),
			attribute.String("library.language", "go"),
		),
	)
	if err != nil {
		log.Printf("Could not set resources: ", err)
	}

	tp := sdktrace.NewTracerProvider(
		sdktrace.WithSampler(sdktrace.AlwaysSample()),
		sdktrace.WithBatcher(exporter),
		sdktrace.WithResource(resources),
	)
	otel.SetTracerProvider(tp)
	otel.SetTextMapPropagator(propagation.NewCompositeTextMapPropagator(propagation.TraceContext{}))
	return exporter.Shutdown
}
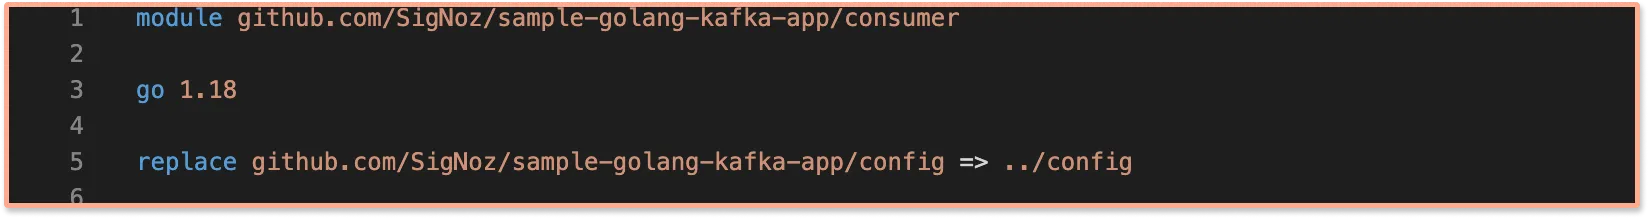
Modify go.mod in producer and consumer folder by adding replace github.com/SigNoz/sample-golang-kafka-app/config => ../config
Import config in both consumer.go and producer.go:
import (
	....
	....
	config "github.com/SigNoz/sample-golang-kafka-app/config"
)
To initialise OpenTelemetry, call the InitTracer function from both consumer.go and producer.go:
func main(){
	cleanup := config.InitTracer()
	defer cleanup(context.Background())
	.....
	.....
}
In main function inside consumer.go wrap the consumer with the OTel library. This is done so that the consumer is instrumented by OpenTelemetry.
func main(){
	.....
	consumer := Consumer{
			ready: make(chan bool),
	}

	handler := otelsarama.WrapConsumerGroupHandler(&consumer)
	.....

}
Since we wrapped our consumer with the open-telemetry library, in consumer.go modify the client.Consume function call and pass handler instead of &consumer.
.......
if err := client.Consume(ctx, strings.Split("quickstart", ","), handler); err != nil {
			log.Panicf("Error from consumer: %v", err)
}
In producer.go wrap the producer. This is done so that the producer is instrumented by OpenTelemetry.
func main() {
	....

	producer, err := sarama.NewSyncProducer(strings.Split(kafkaAddress, ","), config)
	if err != nil {
		log.Panicf("Error creating consumer group client: %v", err)
	}

	producer = otelsarama.WrapSyncProducer(config, producer)

 ....
}
Run go mod tidy in both the producer and consumer folder.
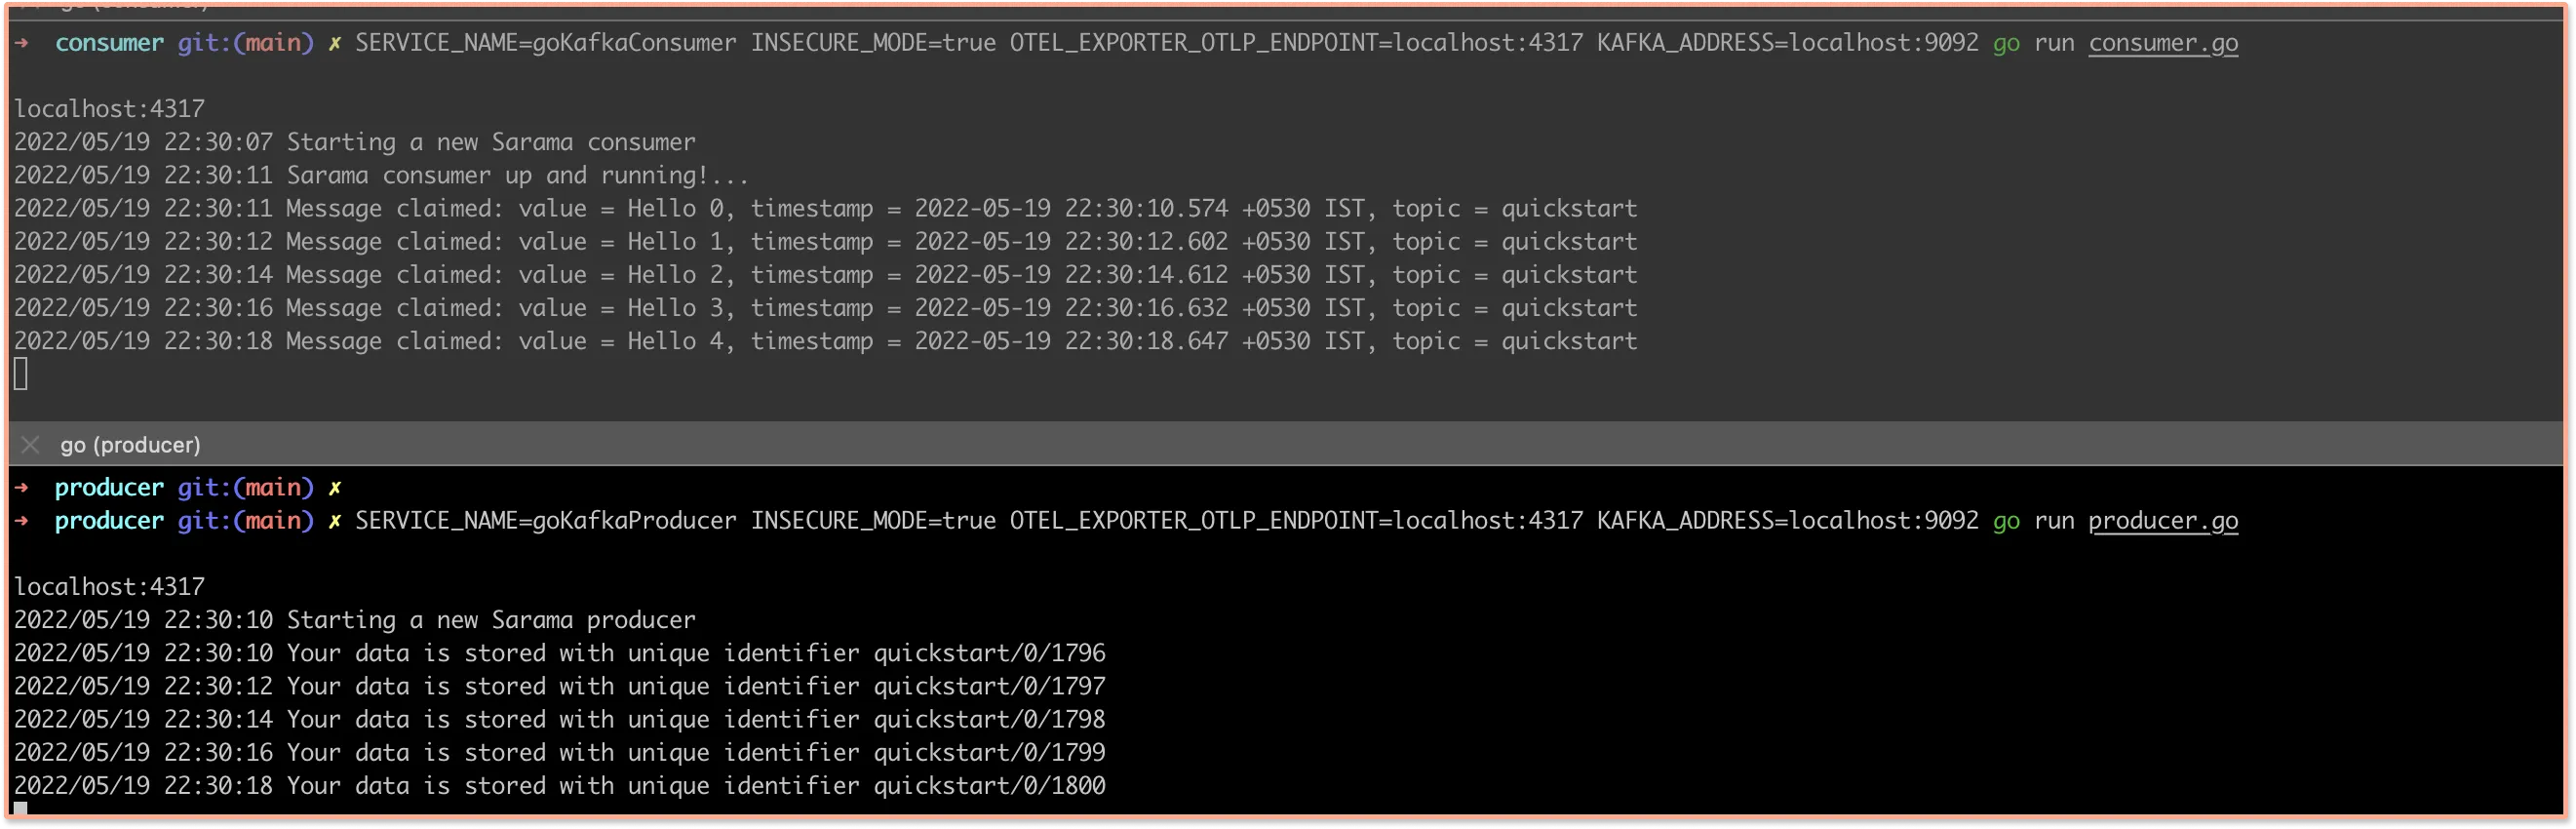
Run consumer:
SERVICE_NAME=goKafkaConsumer INSECURE_MODE=true OTEL_EXPORTER_OTLP_ENDPOINT=localhost:4317 KAFKA_ADDRESS=localhost:9092 go run consumer.go
Run producer:
SERVICE_NAME=goKafkaProducer INSECURE_MODE=true OTEL_EXPORTER_OTLP_ENDPOINT=localhost:4317 KAFKA_ADDRESS=localhost:9092 go run producer.go
You will start seeing messages created by the producer and they are being consumed by the consumer.
Monitor your Kafka application with SigNoz
Once your Kafka-based golang application is instrumented with OpenTelemetry, you can visualize the data collected with OpenTelemetry in SigNoz dashboards.
Go to the Traces tab, you will see goKafkaProducer and goKafkaConsumer under the Service Name filter.
The table in the screenshot below shows spans - a key concept of distributed tracing. Spans represent a logical unit of work in completing a user request.
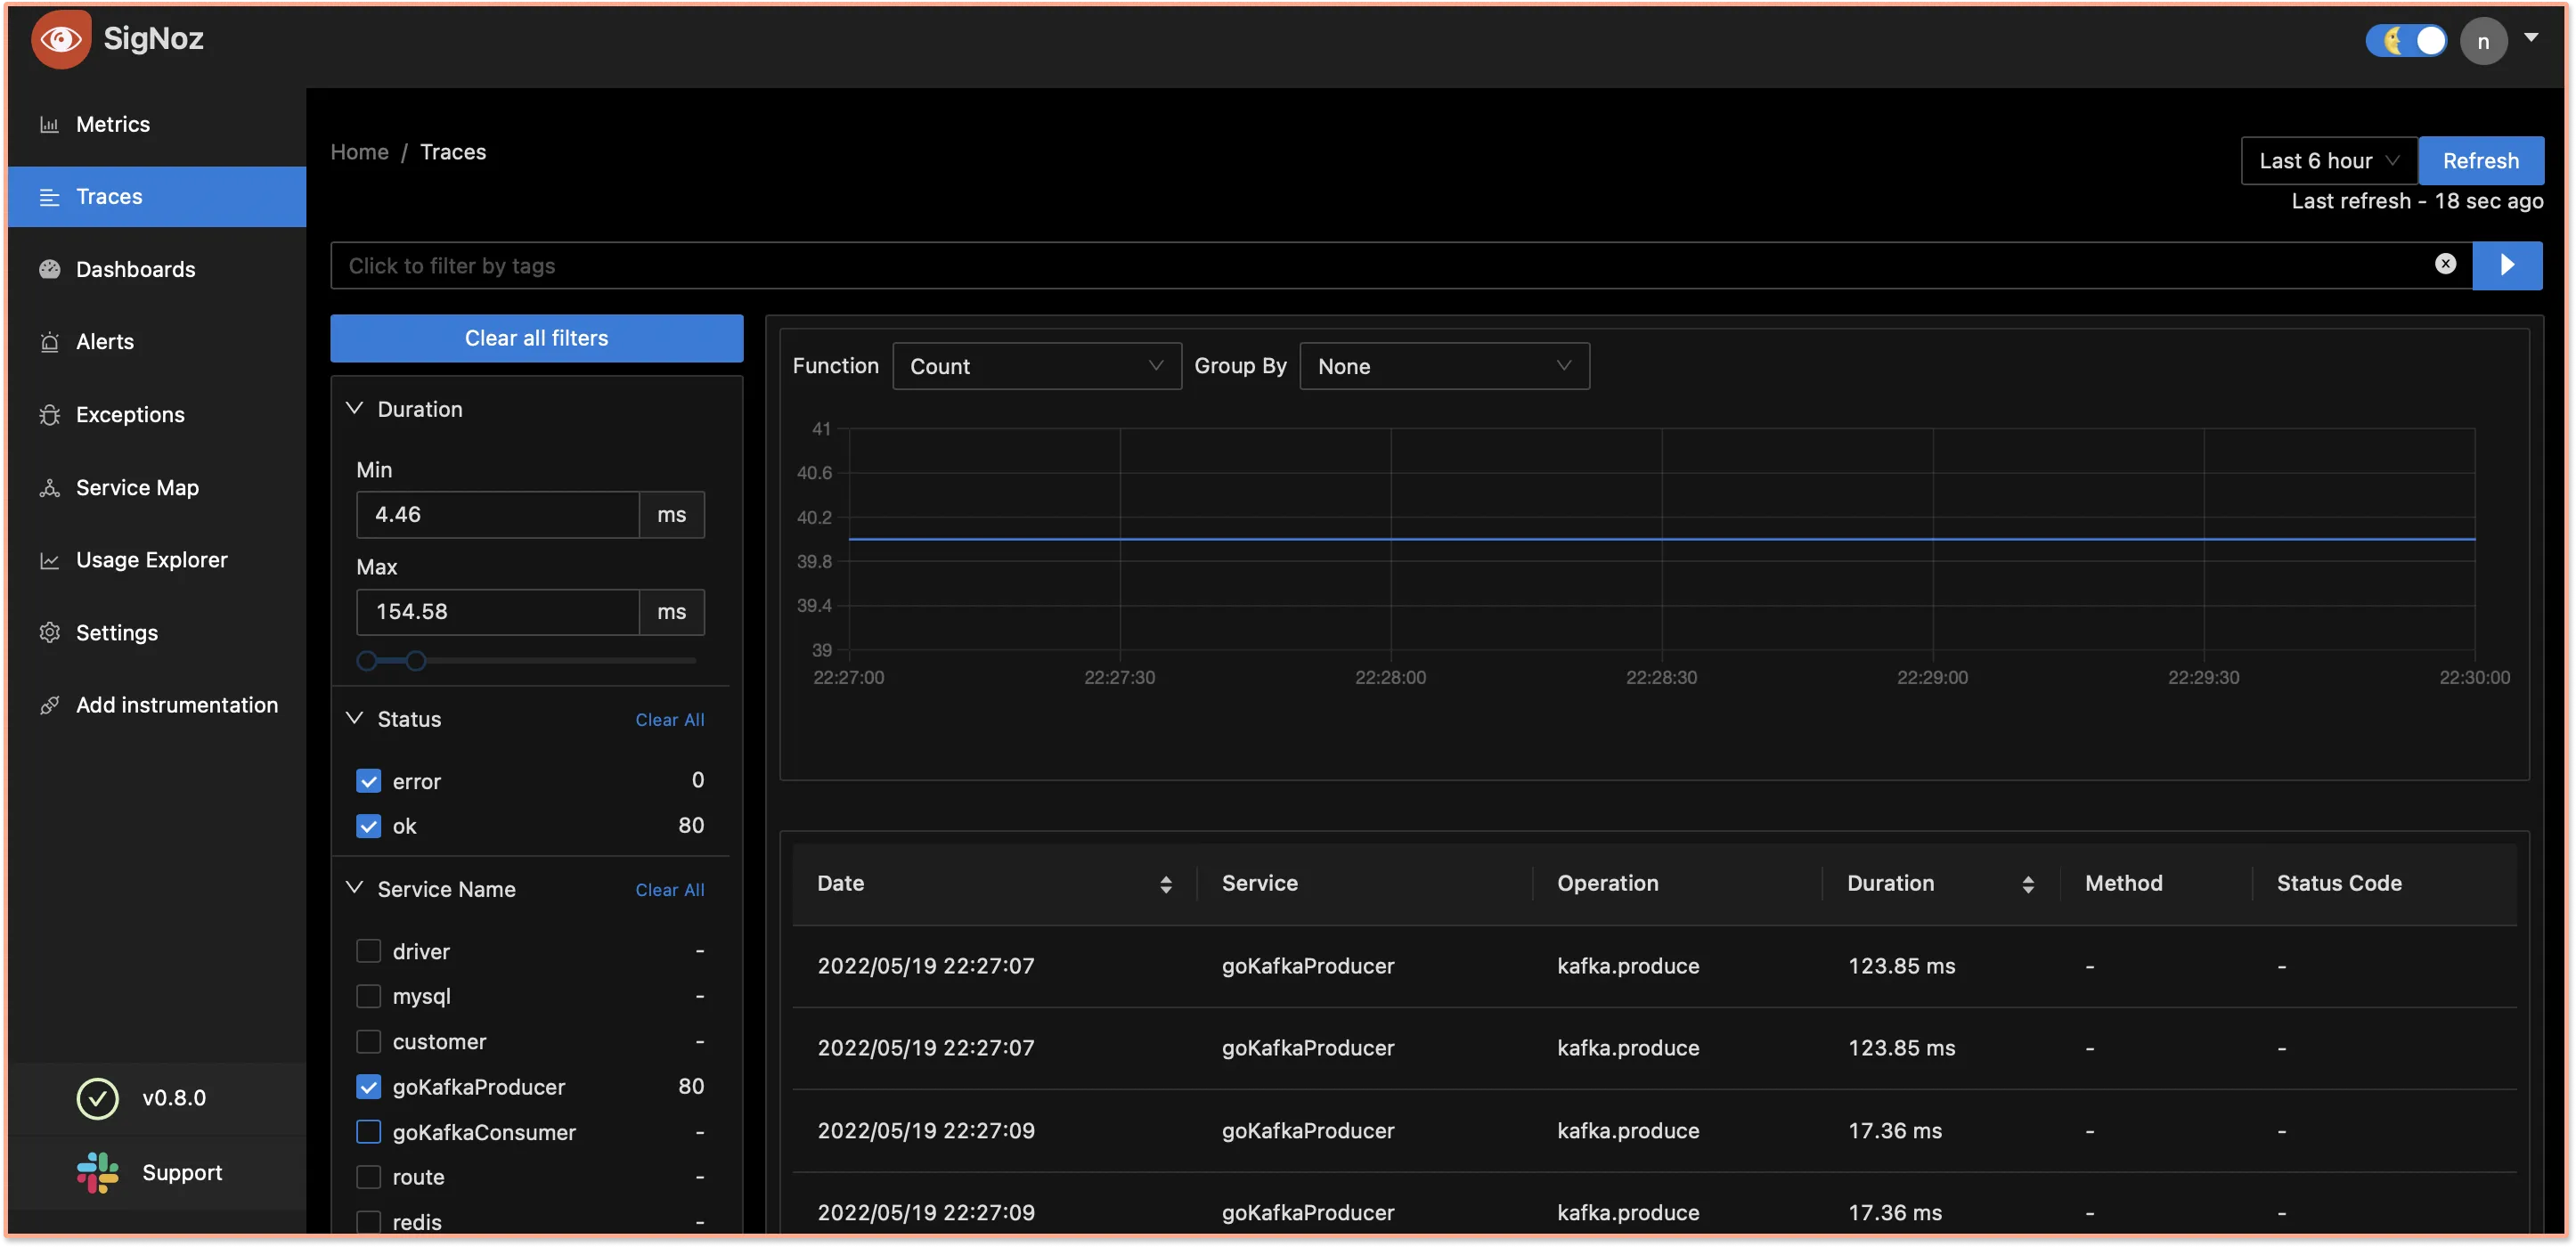
Using Flamegraphs and Gantt charts, you can see the detailed breakdown of each request.
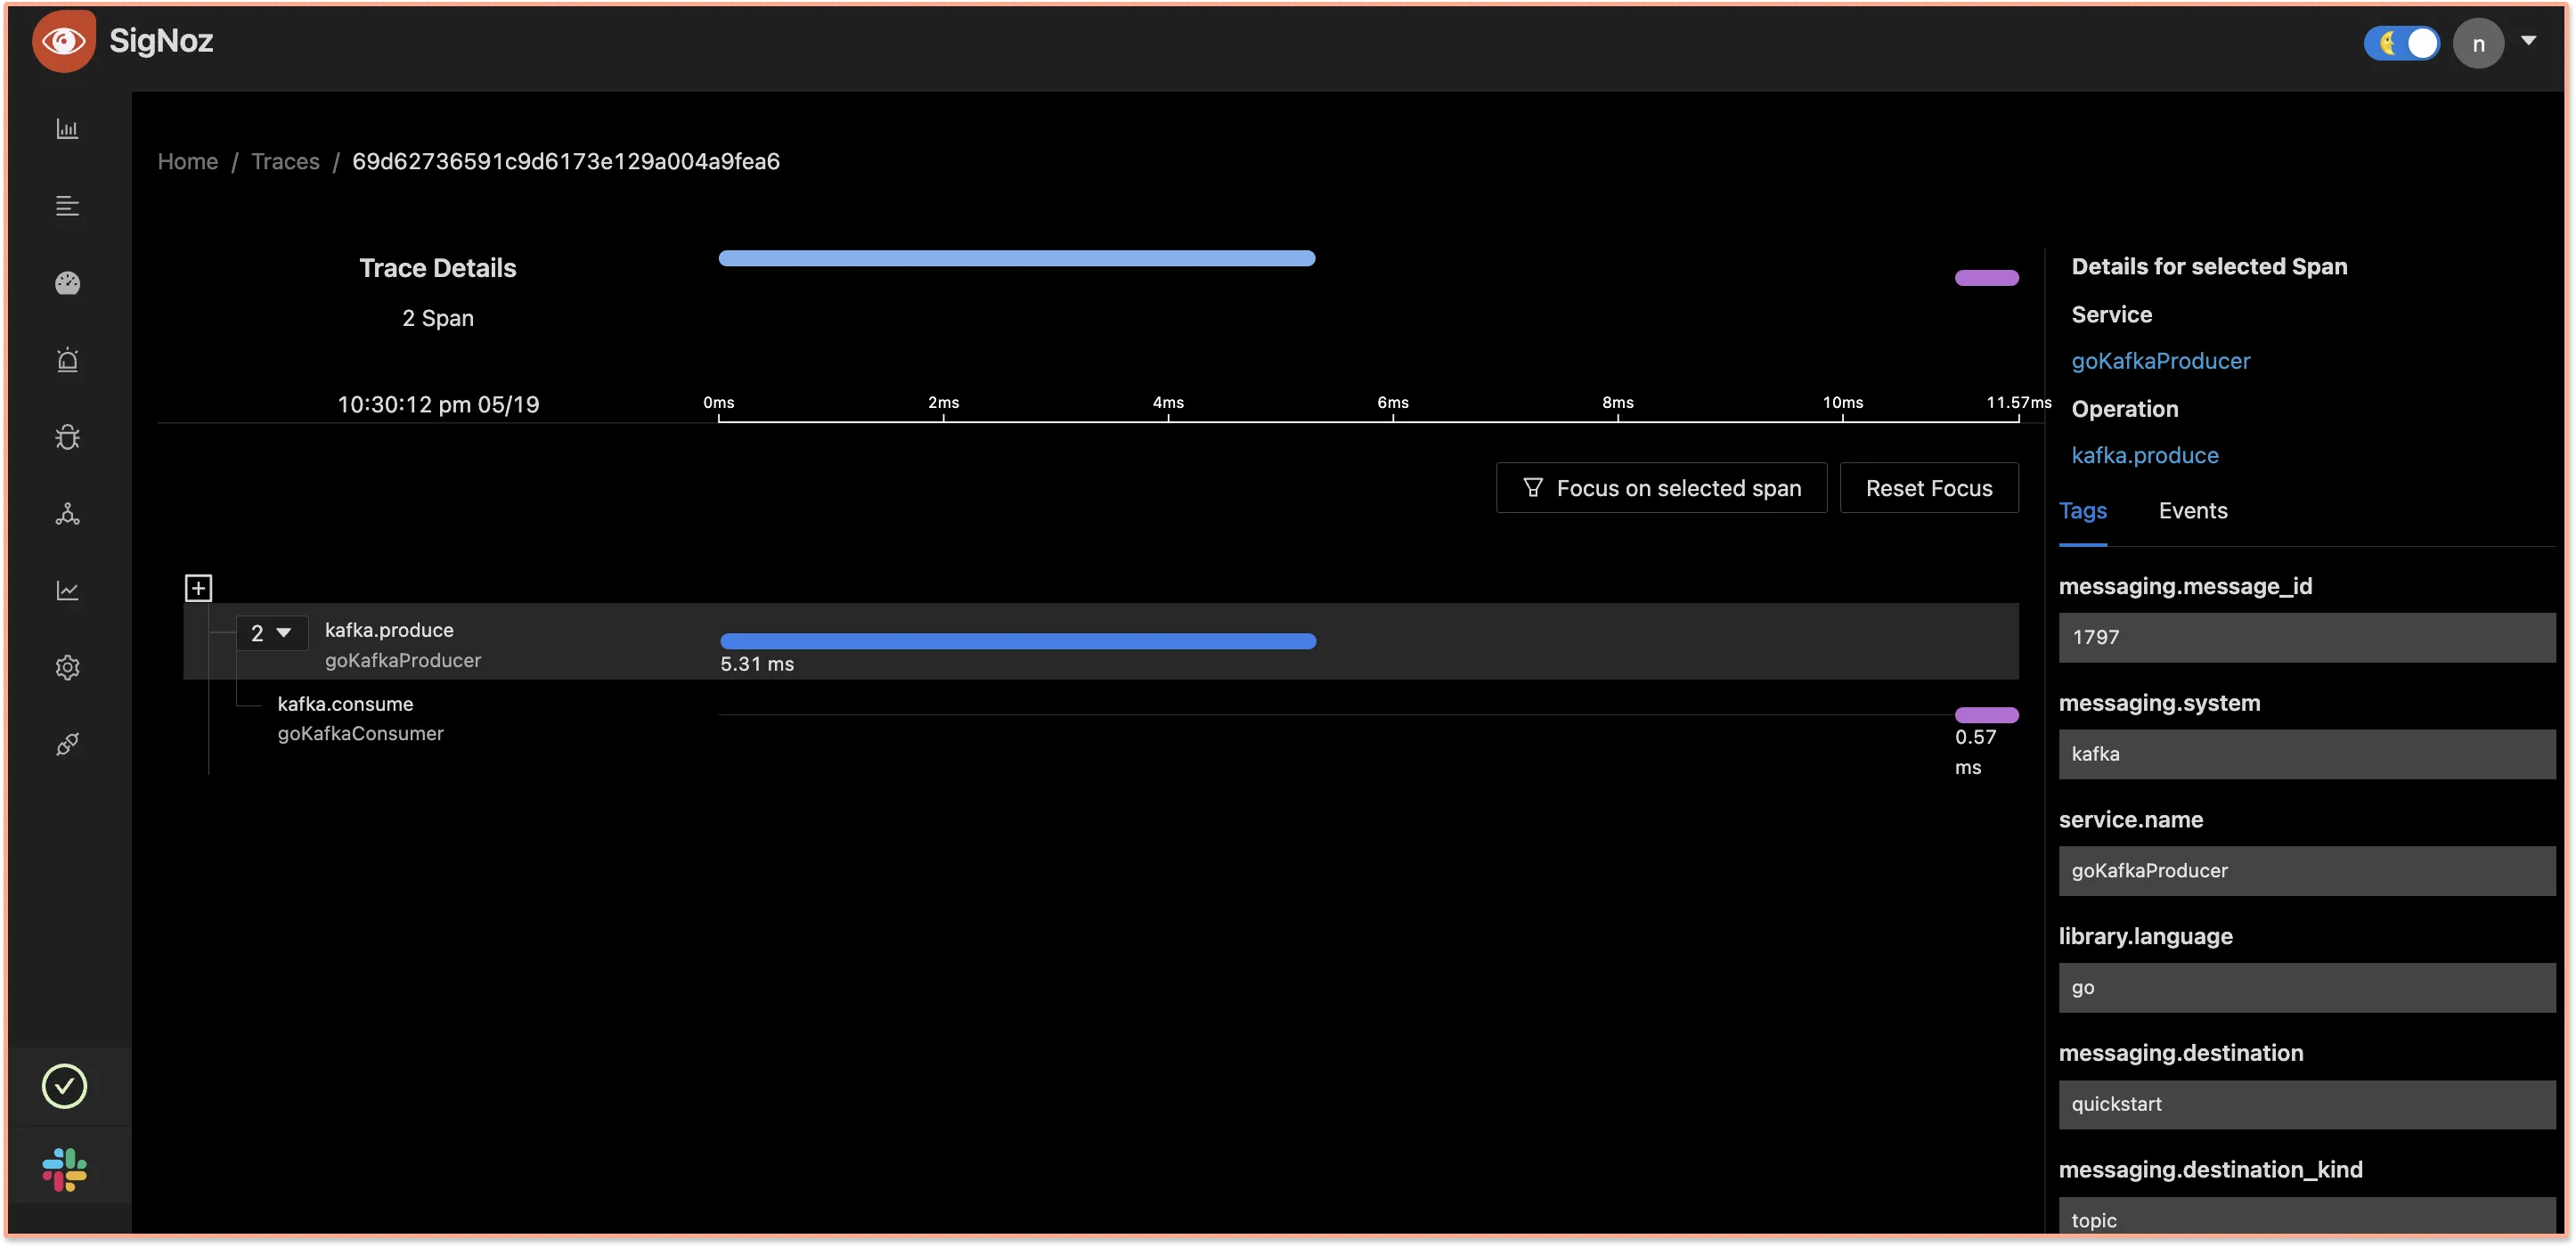
The above visualization shows us the following details:
kafka.producefunction ingoKafkaProducertook 5.31 ms to send the message to Kafka.kafka.consumefunction ofgoKafkaConsumertook 0.5 ms to consume the message from Kafka.- The gap between the spans is the time period for which the message was transferred from
goKafkaProducertogoKafkaConsumervia Kafka.
Conclusion
Apache Kafka plays a critical role in cloud-native distributed applications based on mciroservices architecture. Kafka producers and consumers don’t know about each other and work asynchronously. Although it enables a lot of use-cases for modern applications, Kafka also brings operational complexity.
OpenTelemetry can help solve this complexity by tracing Kafka clients, giving much-needed visibility into how different components of a distributed system interact.
Once your application is instrumented with OpenTelemetry, you can use SigNoz to visualize the interactions in rich detail. SigNoz is built natively on OpenTelemetry and is also open-source. You can try out SigNoz by visiting its GitHub repo 👇
If you have any questions or need any help in setting things up, join our slack community and ping us in #support channel.

If you want to learn more about OpenTelemetry and SigNoz, feel free to follow these links:
