OpenTelemetry Operator Complete Guide [OTel Collector + Auto-Instrumentation Demo]
Manually deploying and managing OpenTelemetry components in a Kubernetes environment can be a complex and time-consuming task. It involves creating various Kubernetes resources, setting up configurations, and ensuring the components are properly integrated with the applications.
OpenTelemetry Operators provide a solution to this problem by automating the deployment, configuration, and management of OpenTelemetry components in Kubernetes clusters, making it easier for operation teams to implement observability in their applications.
What is OpenTelemetry?
OpenTelemetry is an open-source project under the Cloud Native Computing Foundation (CNCF) that aims to standardize the generation and collection of telemetry data. Telemetry data includes logs, metrics, and traces.
It is a collection of APIs, SDKs, and client libraries used to generate telemetry data from your application code. The data you collect with OpenTelemetry is vendor-agnostic and can be exported in many formats.
The biggest advantage of using OpenTelemetry is that you have the freedom to choose a backend of your choice. You don’t get locked into a vendor, and engineering teams can get ramped up on a single technology to generate telemetry data.
Which backend analysis tool to choose?
You can try SigNoz, a full stack open-source APM built natively on OpenTelemetry.
What is a Kubernetes Operator?
A Kubernetes Operator is a specialized controller or software component that automates the management of complex applications in a Kubernetes cluster through the use of Custom Resource Definitions (CRDs). It extends Kubernetes functionality, allowing it to handle tasks like deploying, configuring, and managing applications, databases, and services.
Operators are especially valuable for stateful applications (applications that maintain persistent state, such as databases, caching systems, and file stores). They work by monitoring the state of the cluster and automatically taking actions to keep it in the desired state. For example, a Kubernetes Operator could monitor the status of a StatefulSet and automatically perform a rollback if an update fails. Operators can also handle complex scenarios like upgrading a database from one version to another while ensuring data consistency.
OpenTelemetry Operator for Kubernetes
An OpenTelemetry Operator is a Kubernetes Operator that manages OpenTelemetry Collectors and auto-instrumentation of workloads. It basically simplifies the deployment and management of OpenTelemetry in a Kubernetes environment.
The OpenTelemetry Operator provides two Custom Resource Definitions (CRDs):
OpenTelemetryCollectorInstrumentation
The OpenTelemetryCollector CRD allows you to deploy and manage OpenTelemetry Collectors in your Kubernetes cluster.
The Instrumentation CRD allows you to configure and inject OpenTelemetry auto-instrumentation libraries into your workloads.
The OpenTelemetry Operator can be used to simplify and automate the following tasks:
- Deploying and managing OpenTelemetry Collectors in a Kubernetes cluster
- Auto-instrumenting workloads with OpenTelemetry
- Configuring OpenTelemetry Collectors and Exporters
- Routing telemetry data to multiple destinations
The Operator is the most automated way to run collectors in a cluster, but if you prefer to wire the Collector up by hand as a DaemonSet and Deployment, our full walkthrough on Kubernetes observability with OpenTelemetry covers that path step by step.
Using an OpenTelemetry Operator to auto-instrument a Java application
In this section, you will learn how an OpenTelemetry Operator can be set up and used in SigNoz.
Prerequisite
- A SigNoz cloud account
- A Kubernetes cluster
- Java 8 or newer (full JDK not a JRE)
- A Java application
Setting up SigNoz
You need a backend to which you can send the collected data for monitoring and visualization. SigNoz is an OpenTelemetry-native APM that is well-suited for visualizing OpenTelemetry data.
SigNoz cloud is the easiest way to run SigNoz. You can sign up here for a free account and get 30 days of unlimited access to all features.
You can also install and self-host SigNoz yourself. Check out the docs for installing self-host SigNoz.
Setting up your Java application
A sample Spring PetClinic Java application has been provided. To access it, run the below in your terminal:
# Clone the Spring PetClinic repository from SigNoz's GitHub
git clone https://github.com/SigNoz/spring-petclinic

# Change into the cloned directory
cd spring-petclinic

# Use Maven Wrapper to package the Spring PetClinic application
./mvnw package

# Run the Spring PetClinic application using the generated JAR file
java -jar target/*.jar
You can then access the running application at http://localhost:8090
Setting up the OpenTelemetry Operator
There are two ways to install the OpenTelemetry Operator in your Kubernetes cluster,
1/ Applying the release YAML directly 2/ Using the official Helm chart
For this tutorial, we'll use the direct kubectl apply method because it's fast and straightforward. This command installs the operator, its Custom Resource Definitions (CRDs), and all the necessary RBAC rules.
To install the operator in the existing K8s cluster, run the following command:
kubectl apply -f https://github.com/open-telemetry/opentelemetry-operator/releases/latest/download/opentelemetry-operator.yaml
While the direct apply method is good for a quick start, the recommended method for production and the best practice is to use the official Helm chart. Helm allows you to easily manage configuration options, set resource limits, and handle version upgrades more robustly.
Assuming you have Helm installed, you can add the OpenTelemetry repository and install the operator with these commands:
# 1. Add the OpenTelemetry Helm repository
helm repo add open-telemetry https://open-telemetry.github.io/opentelemetry-helm-charts

# 2. Install the operator into its own namespace
helm install opentelemetry-operator open-telemetry/opentelemetry-operator --namespace
     opentelemetry-operator-system --create-namespace
Setup the OpenTelemetry Collector instance
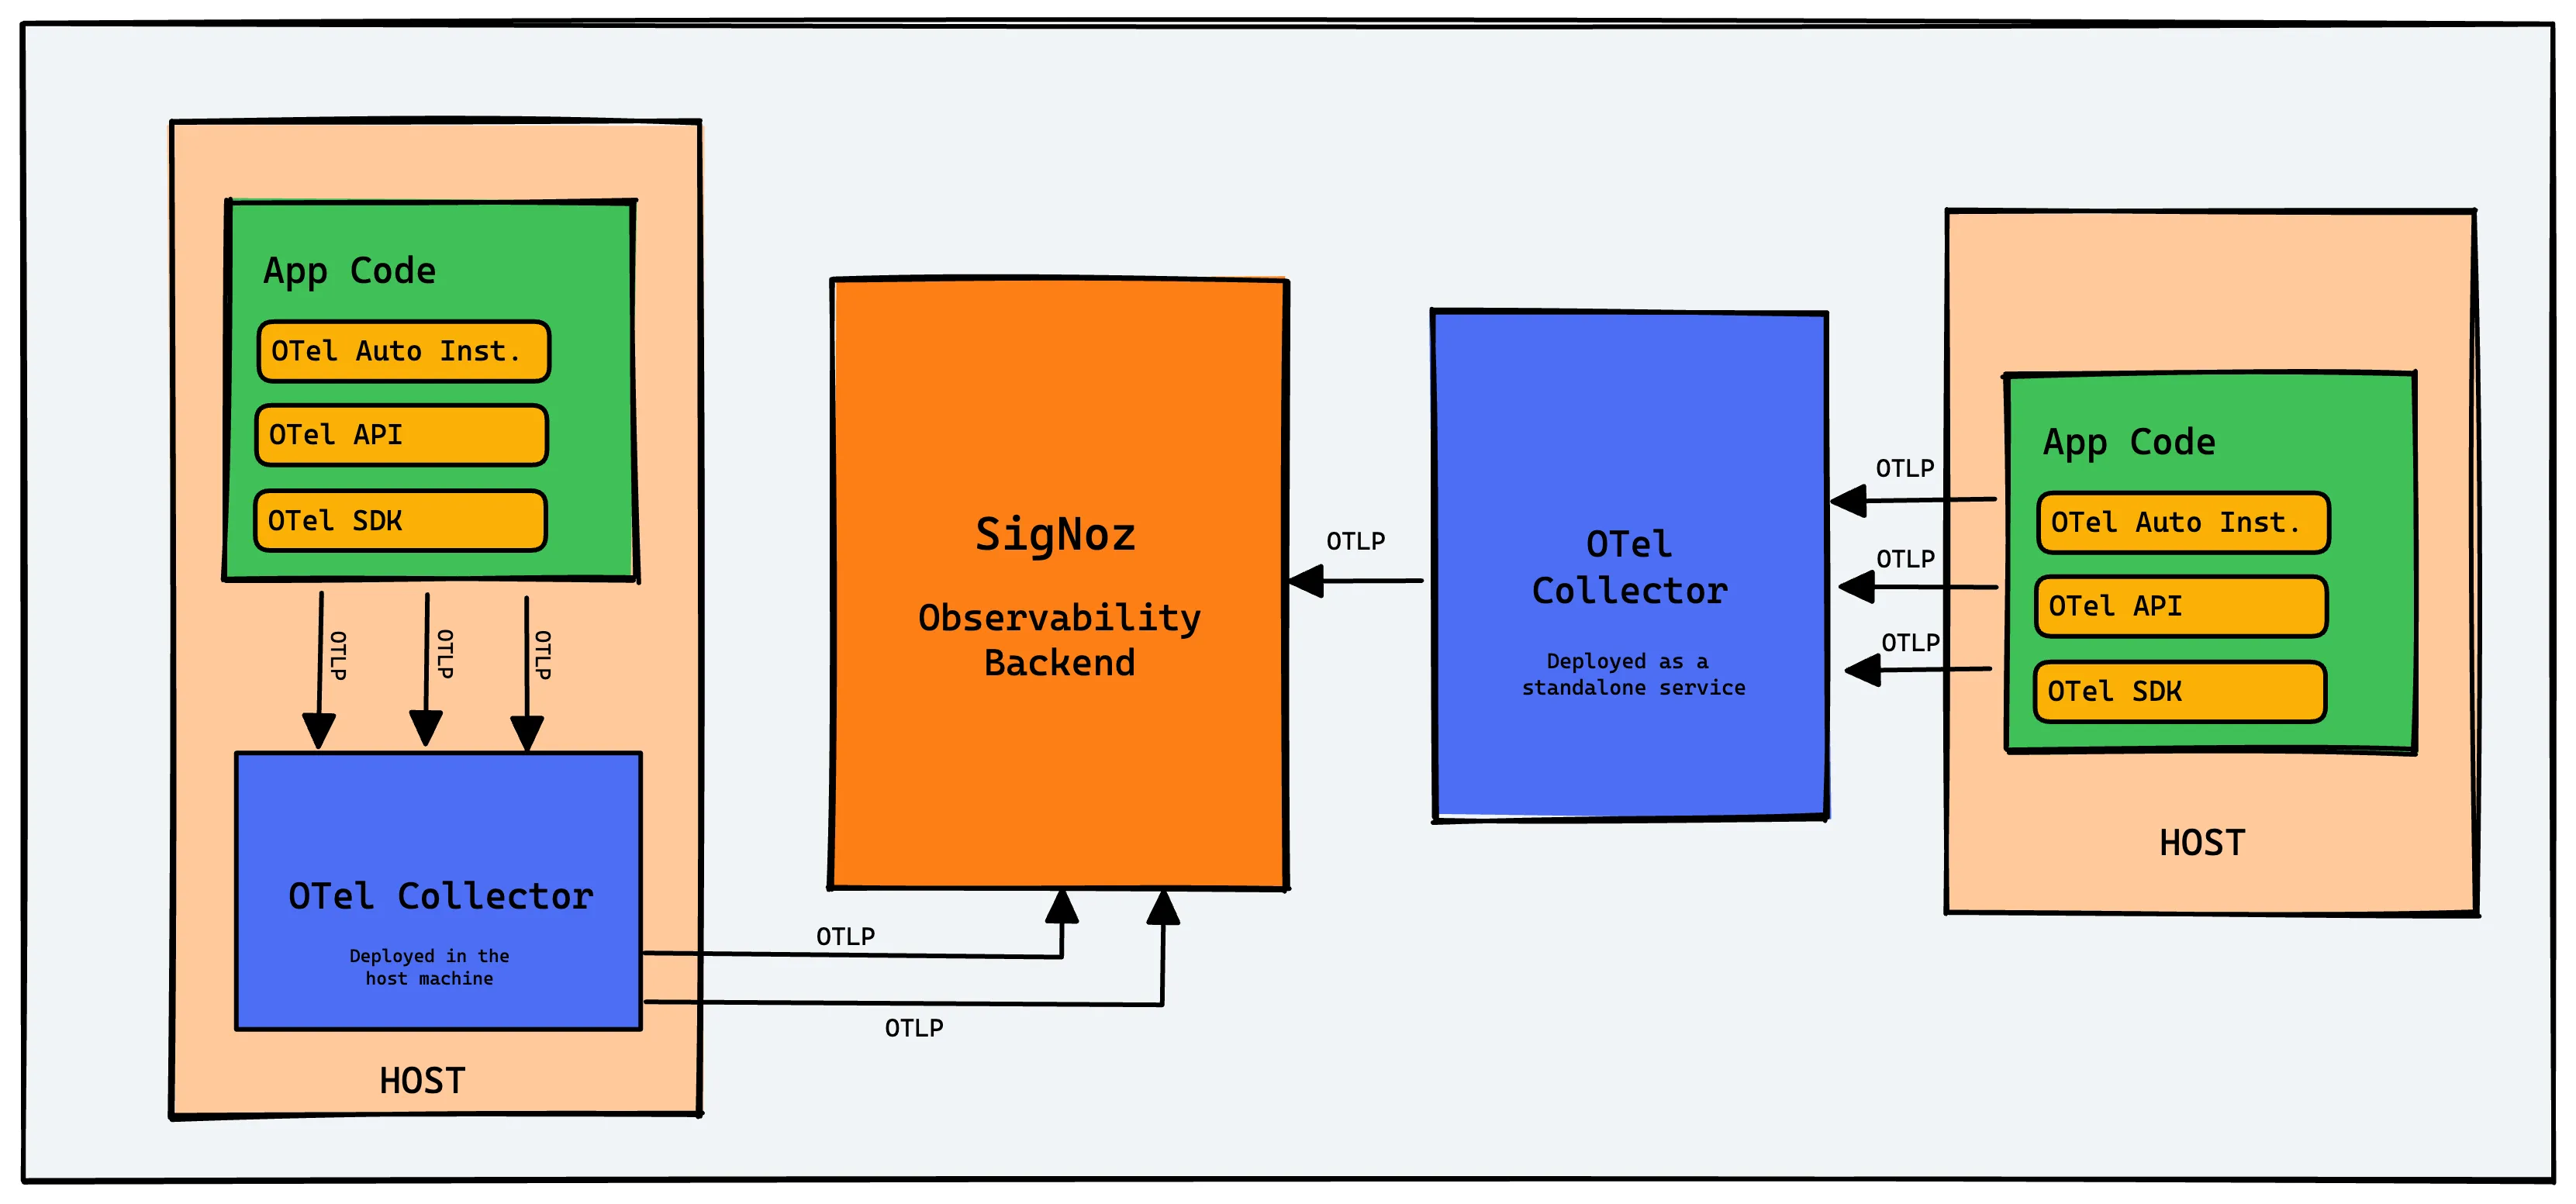
Once the opentelemetry-operator has been deployed, you can proceed with the creation of the OpenTelemetry Collector (otelcol) instance. The OpenTelemetry Collector collects, processes, and exports telemetry data.
There are different deployment modes for the OpenTelemetry Collector, and you can specify them in the spec.mode section of the custom resource. The available deployment modes are:
- Daemonset
- Sidecar
- StatefulSet
- Deployment (default mode)
The default method - the Deployment mode, will be used here.
To create a simple instance of the OpenTelemetry Collector, run the below in your terminal:
kubectl apply -f - <<EOF
apiVersion: opentelemetry.io/v1beta1
kind: OpenTelemetryCollector
metadata:
  name: simplest
spec:
  mode: deployment
  config: |
    receivers:
      otlp:
        protocols:
          grpc:
          http:
    processors:
      batch:
    exporters:
      debug:
    service:
      pipelines:
        traces:
          receivers: [otlp]
          processors: [batch]
          exporters: [debug]
EOF
The above otelcol example receives OTLP traces data using gRPC and HTTP protocols, batches the data, and logs it to the console.
Creating an Instrumentation Instance
Once the OpenTelemetry Collector instance has been deployed, the next step will be to create an instrumentation instance, which will be responsible for sending OTLP data to the SigNoz endpoint.
To create an instance of Instrumentation, run the below configuration in your terminal:
kubectl apply -f - <<EOF
apiVersion: opentelemetry.io/v1beta1
kind: Instrumentation
metadata:
  name: my-instrumentation
spec:
  exporter:
    endpoint: https://ingest.{region}.signoz.cloud:443
  env:
    - name: OTEL_EXPORTER_OTLP_HEADERS
      value: signoz-ingestion-key=<insert-token-here>
    - name: OTEL_EXPORTER_OTLP_INSECURE
      value: "false"
  propagators:
    - tracecontext
    - baggage
    - b3
  sampler:
    type: parentbased_traceidratio
    argument: "0.25"
  java:
    image: ghcr.io/open-telemetry/opentelemetry-operator/autoinstrumentation-java:latest
  nodejs:
    image: ghcr.io/open-telemetry/opentelemetry-operator/autoinstrumentation-nodejs:latest
  python:
    image: ghcr.io/open-telemetry/opentelemetry-operator/autoinstrumentation-python:latest
  dotnet:
    image: ghcr.io/open-telemetry/opentelemetry-operator/autoinstrumentation-dotnet:latest
EOF
This above configuration sets up the OpenTelemetry Operator to automatically instrument applications written in Java, Node.js, Python, and .NET. It defines settings for the exporter, context propagation, and sampling strategies.
In essence, once you deploy an application in the specified languages, the OpenTelemetry Operator will apply the necessary instrumentation code to collect telemetry data from that application.
Replace the
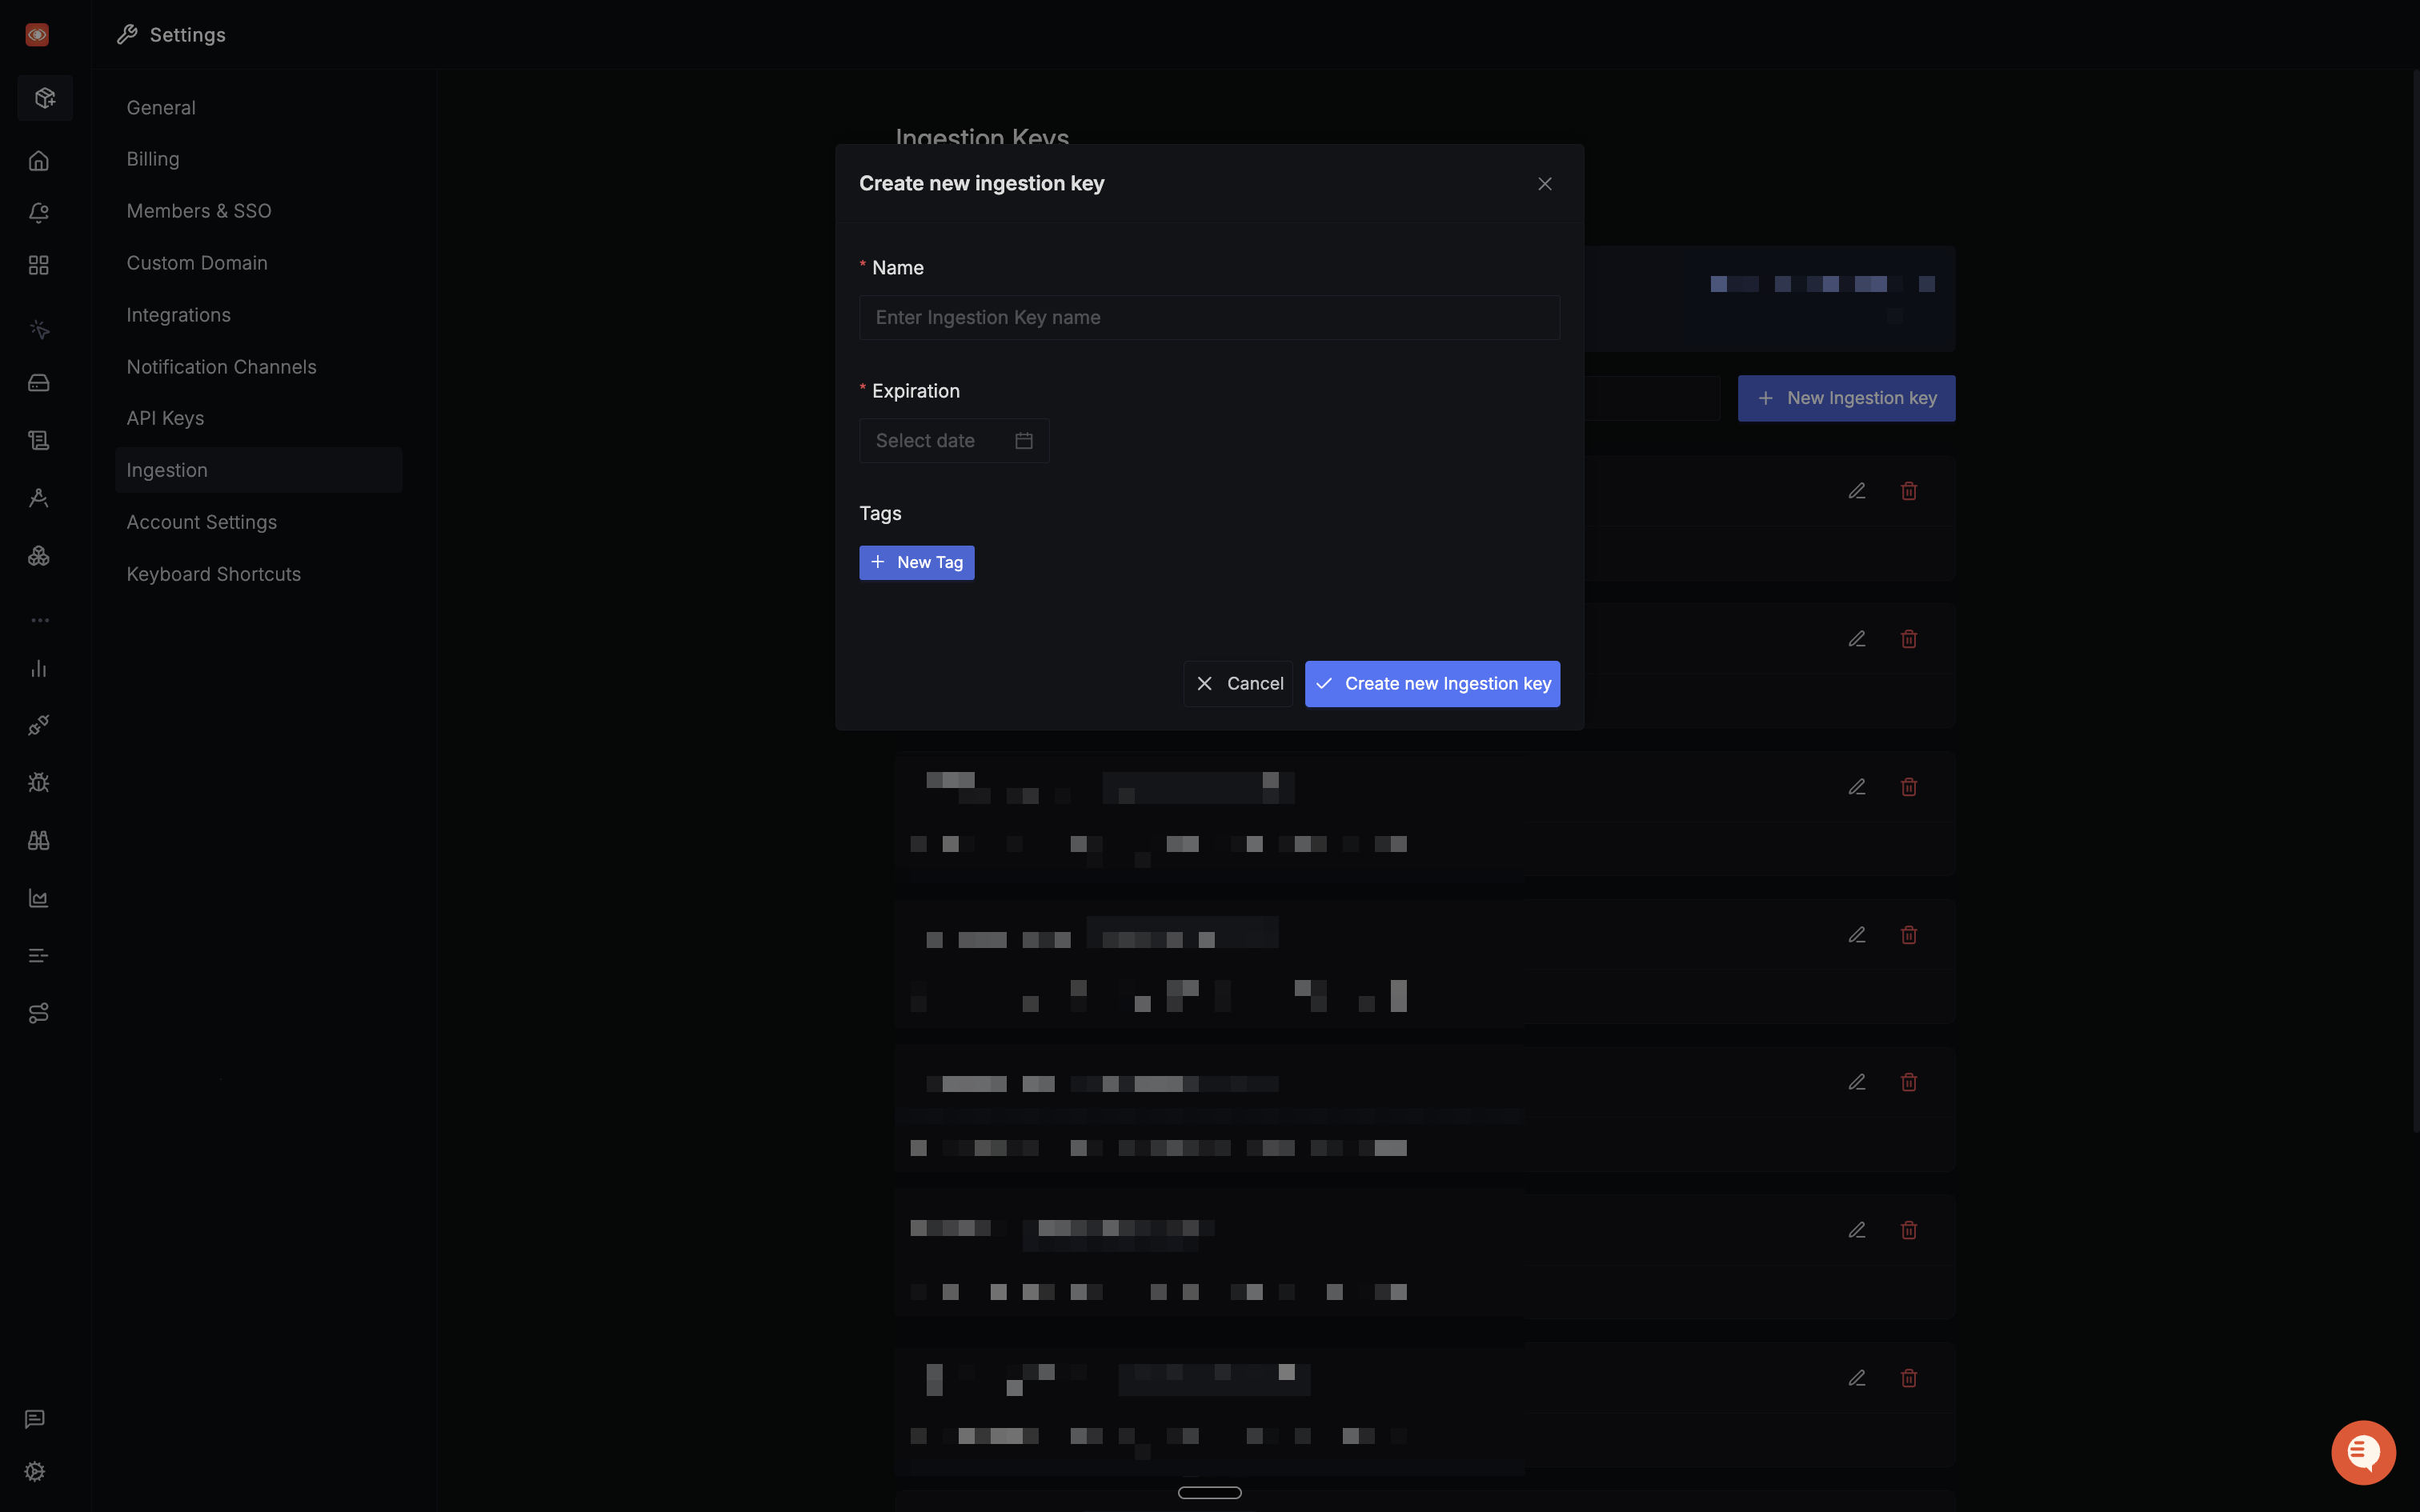
{region}with the region you selected when creating the SigNoz cloud account, and replace<signoz-ingestion-key>with the ingestion token sent to your email.
You can find the ingestion details in the SigNoz dashboard under the Settings tab.
Auto-instrument your Java app with OpenTelemetry
Applications can be instrumented through both manual instrumentation and auto-instrumentation. Manual instrumentation offers granular control and customization of instrumentation code but may be time-consuming and require existing code modification. Alternatively, auto-instrumentation automates this process without code modifications, saving time and effort. In this case, auto-instrumentation will be utilized for simplicity.
There are different ways to set up auto-instrumentation for your applications using the OpenTelemetry Operator, which you can look at here.
The sample Java application that was set up earlier is to be auto-instrumented with OpenTelemetry. It has already been packaged into a docker image and is being referenced in the below Kubernetes manifest. Once the deployment is created, the image will be pulled into your cluster from the GitHub Container Registry, where it is hosted. Auto instrumentation has been set up for the application using the “Auto-instrumentation without Sidecar” method in the below manifest.
Run the below to create the deployment:
kubectl apply -f - <<EOF
apiVersion: apps/v1
kind: Deployment
metadata:
  name: spring-petclinic
spec:
  selector:
    matchLabels:
      app: spring-petclinic
  replicas: 1
  template:
    metadata:
      labels:
        app: spring-petclinic
      annotations:
        instrumentation.opentelemetry.io/inject-java: "true"
    spec:
      containers:
      - name: app
        image: ghcr.io/pavolloffay/spring-petclinic:latest
EOF
The pod annotation
instrumentation.opentelemetry.io/inject-java: "true"signals to the OpenTelemetry Operator that this specific pod should be auto-instrumented for Java.
The OpenTelemetry Operator will be responsible for injecting and configuring OpenTelemetry auto-instrumentation libraries into the spring-petclinic application without you needing to set up OpenTelemetry and its components for the application yourself.
To ensure that the pod deployed is up and running, run the following command:
kubectl get pods
It should return a similar output as the one below showing that the pod is running
NAME                                        READY   STATUS    RESTARTS   AGE
spring-petclinic-ff8897995-gnqnq            1/1     Running   0          133m
Once the pod has reached a running state, export the pod name:
export POD_NAME=$(kubectl get pod -l app=spring-petclinic -o jsonpath="{.items[0].metadata.name}")
Forward network traffic from your local machine to a specific port on a pod in your cluster:
kubectl port-forward ${POD_NAME} 8080:8080
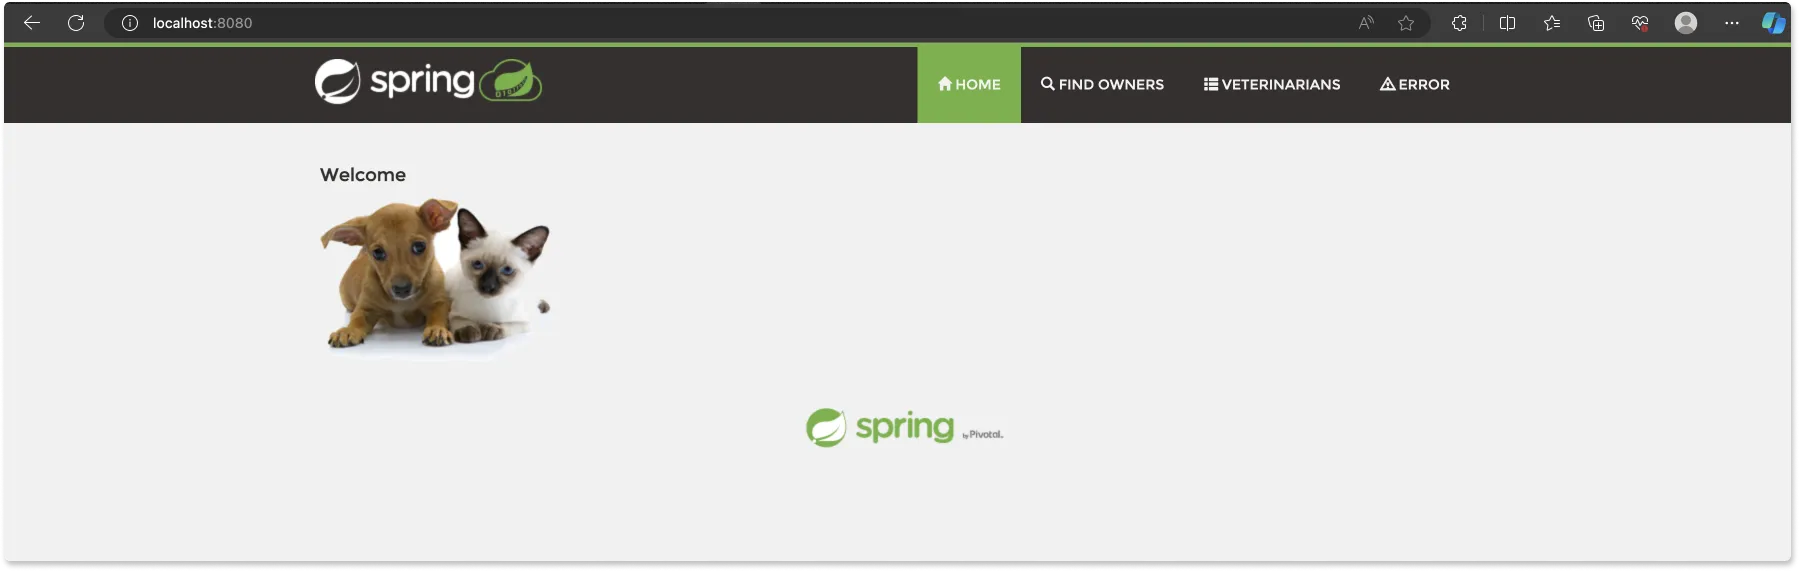
In your browser, visit http://localhost:8080 to see the running application.
Now, telemetry data needs to be generated for the application. This telemetry data will then be visualized in SigNoz. To do this, you can refresh the web page multiple times, which will generate some HTTP GET requests, or you can click on the different pages in the application(Home, Fine Owners, Veterinarians, Error) to generate some activity.
Once telemetry data has been generated, open your SigNoz cloud account, and you should see the spring-petclinic application under the Services tab.
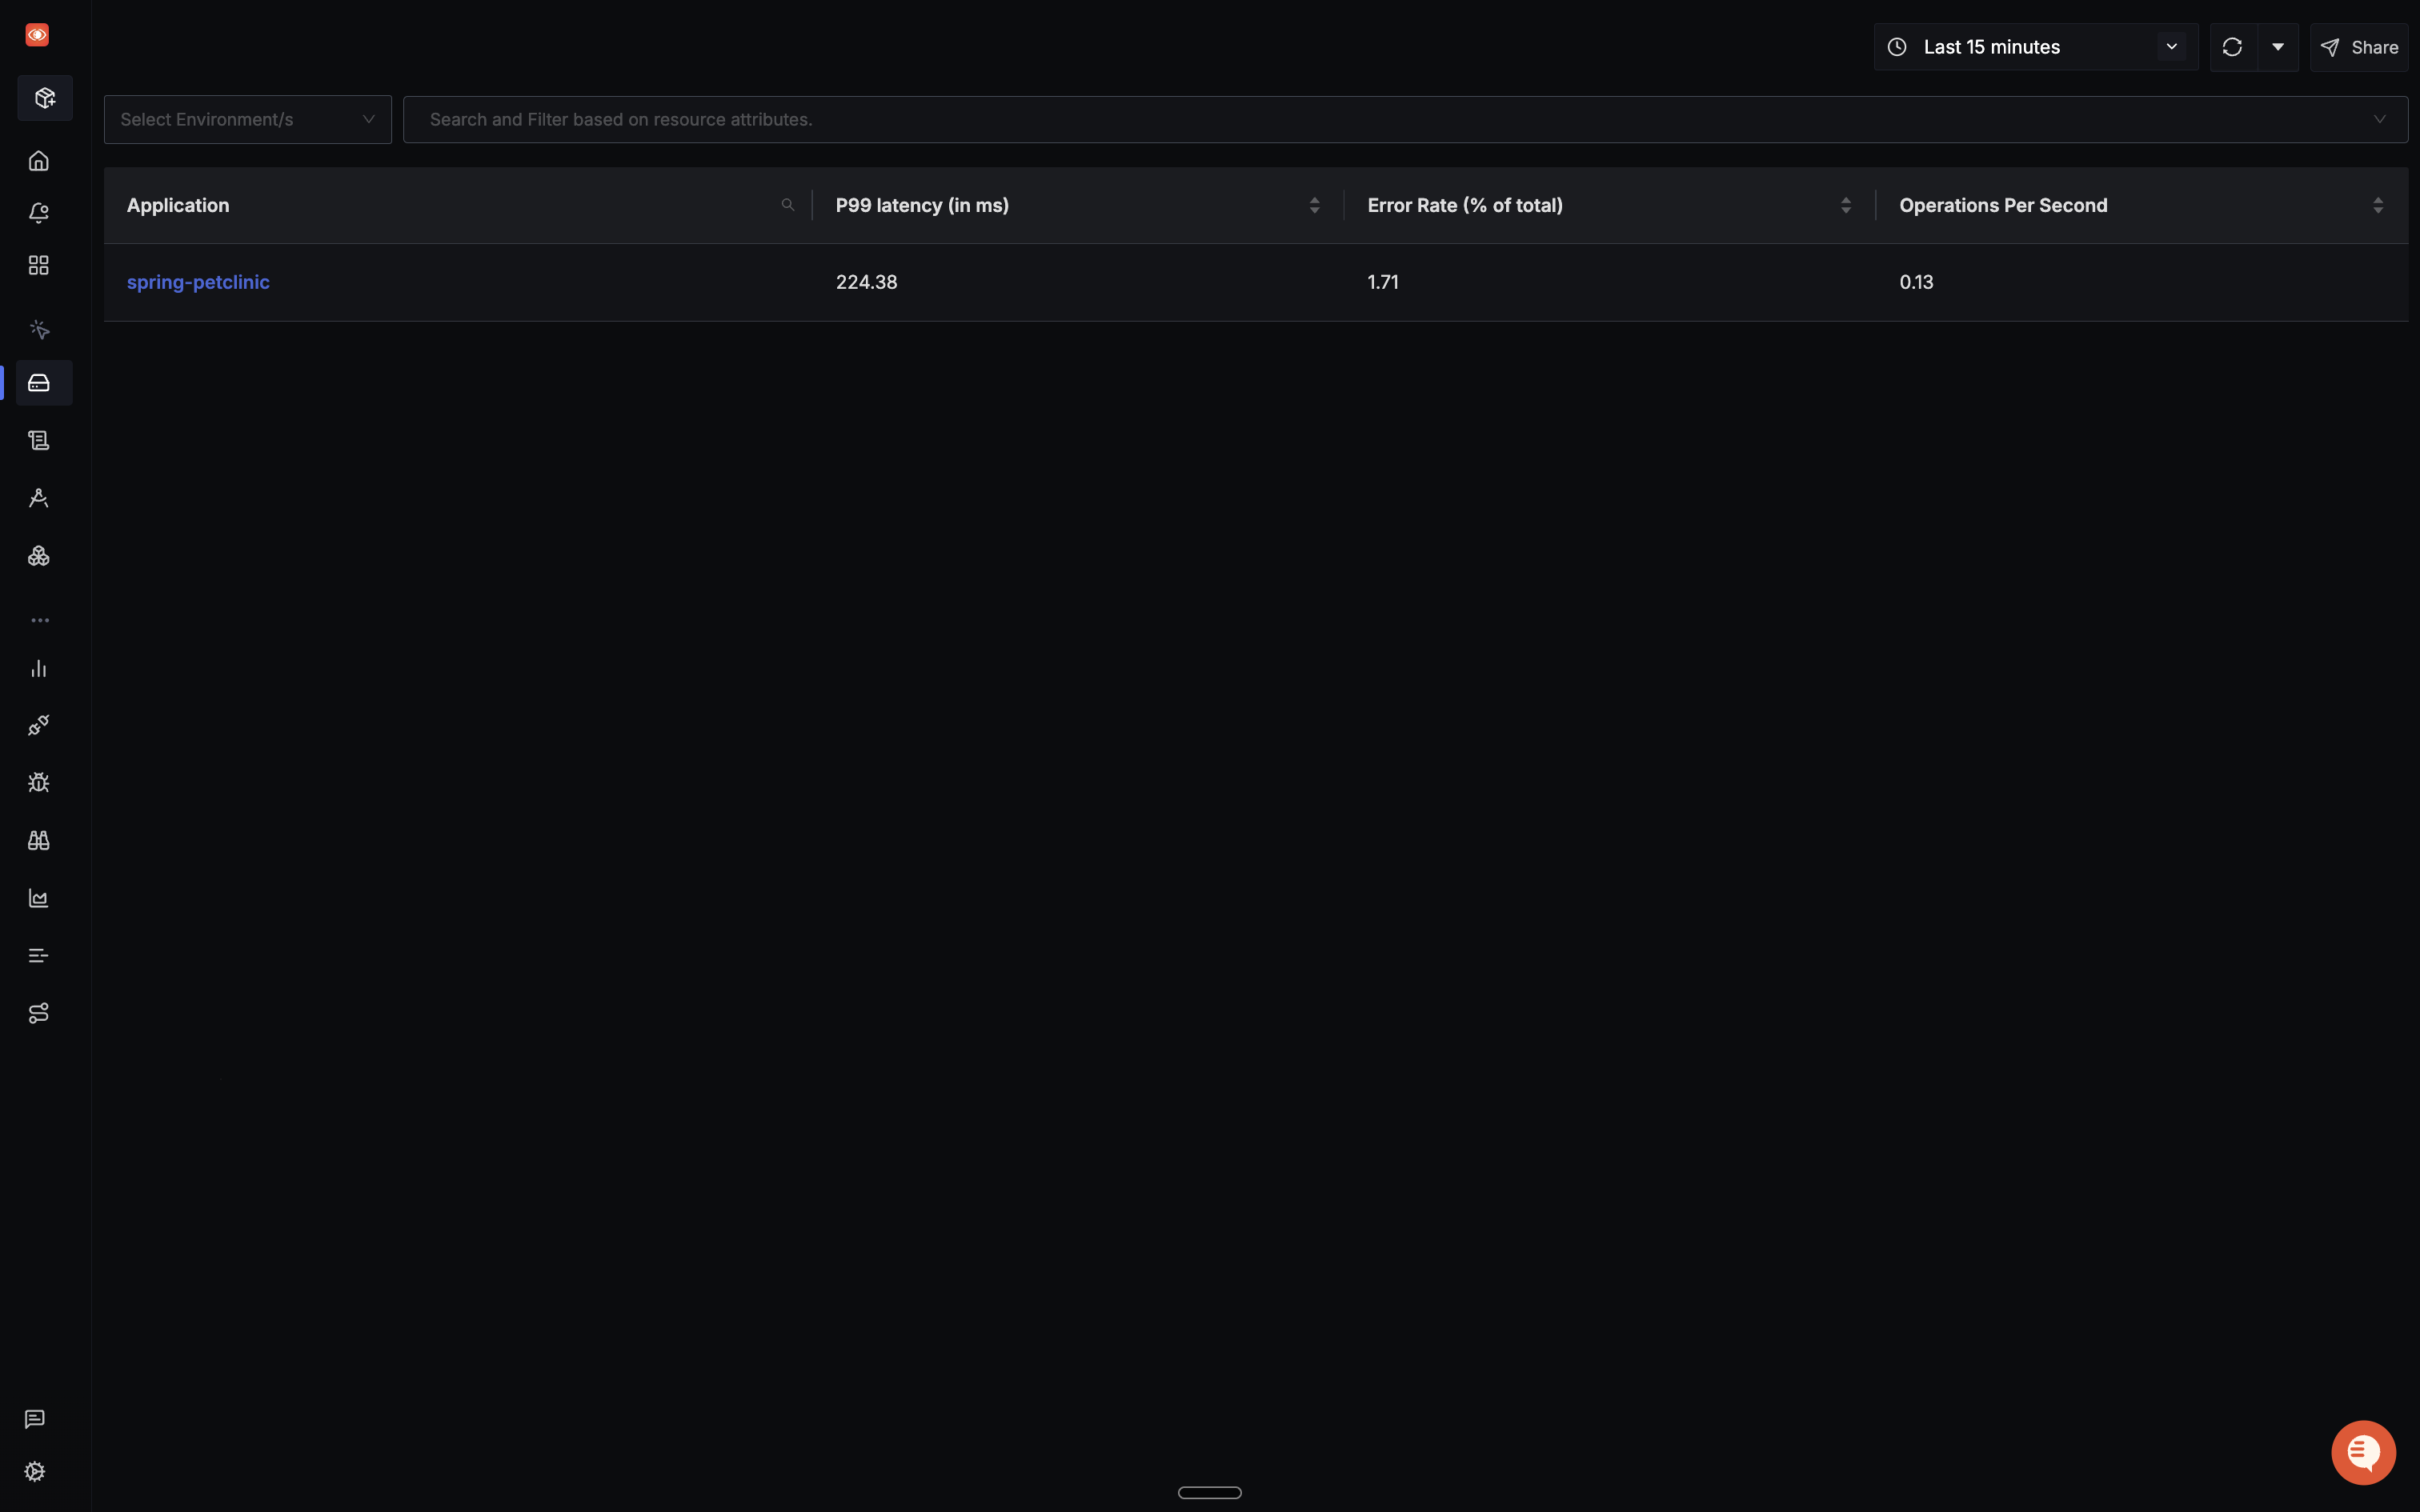
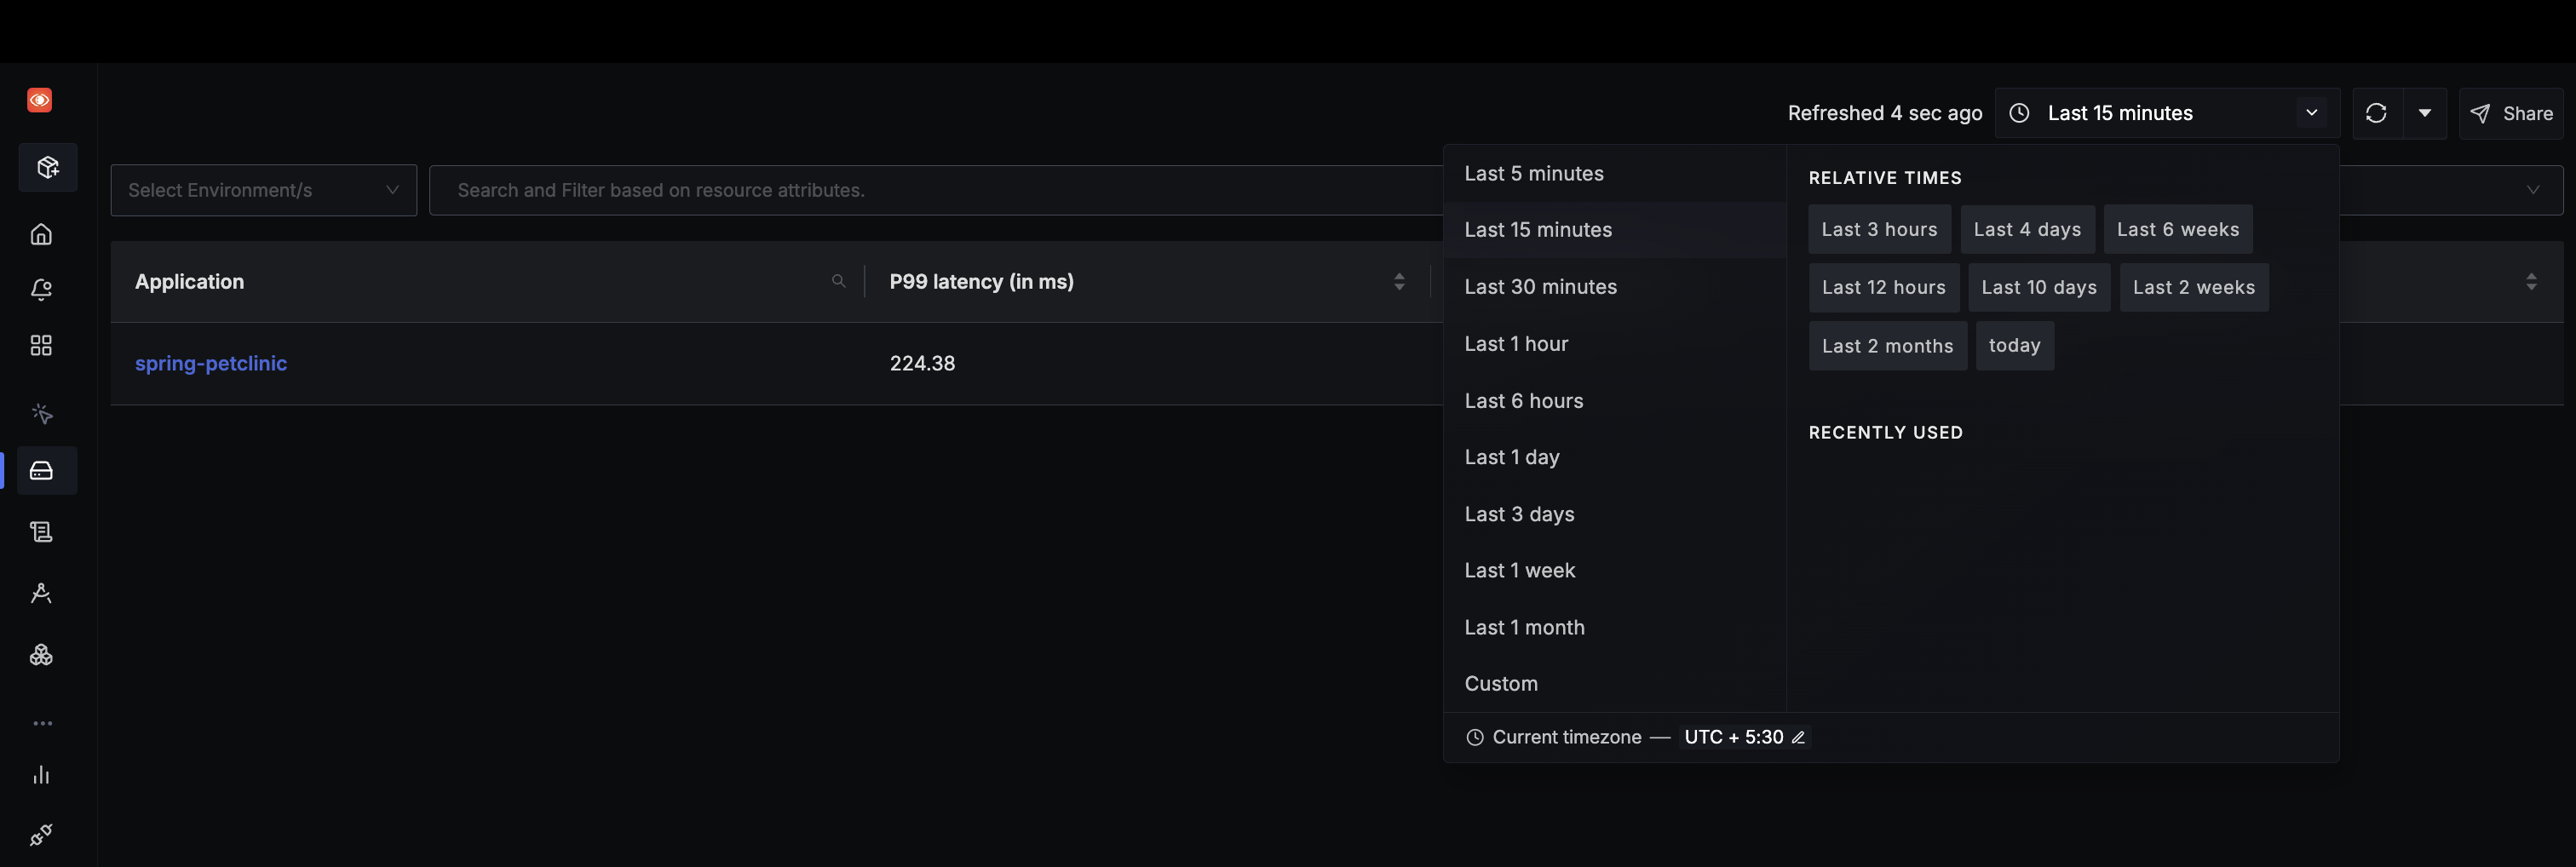
You can change the duration in case the application doesn’t show up depending on the time the telemetry data was generated.
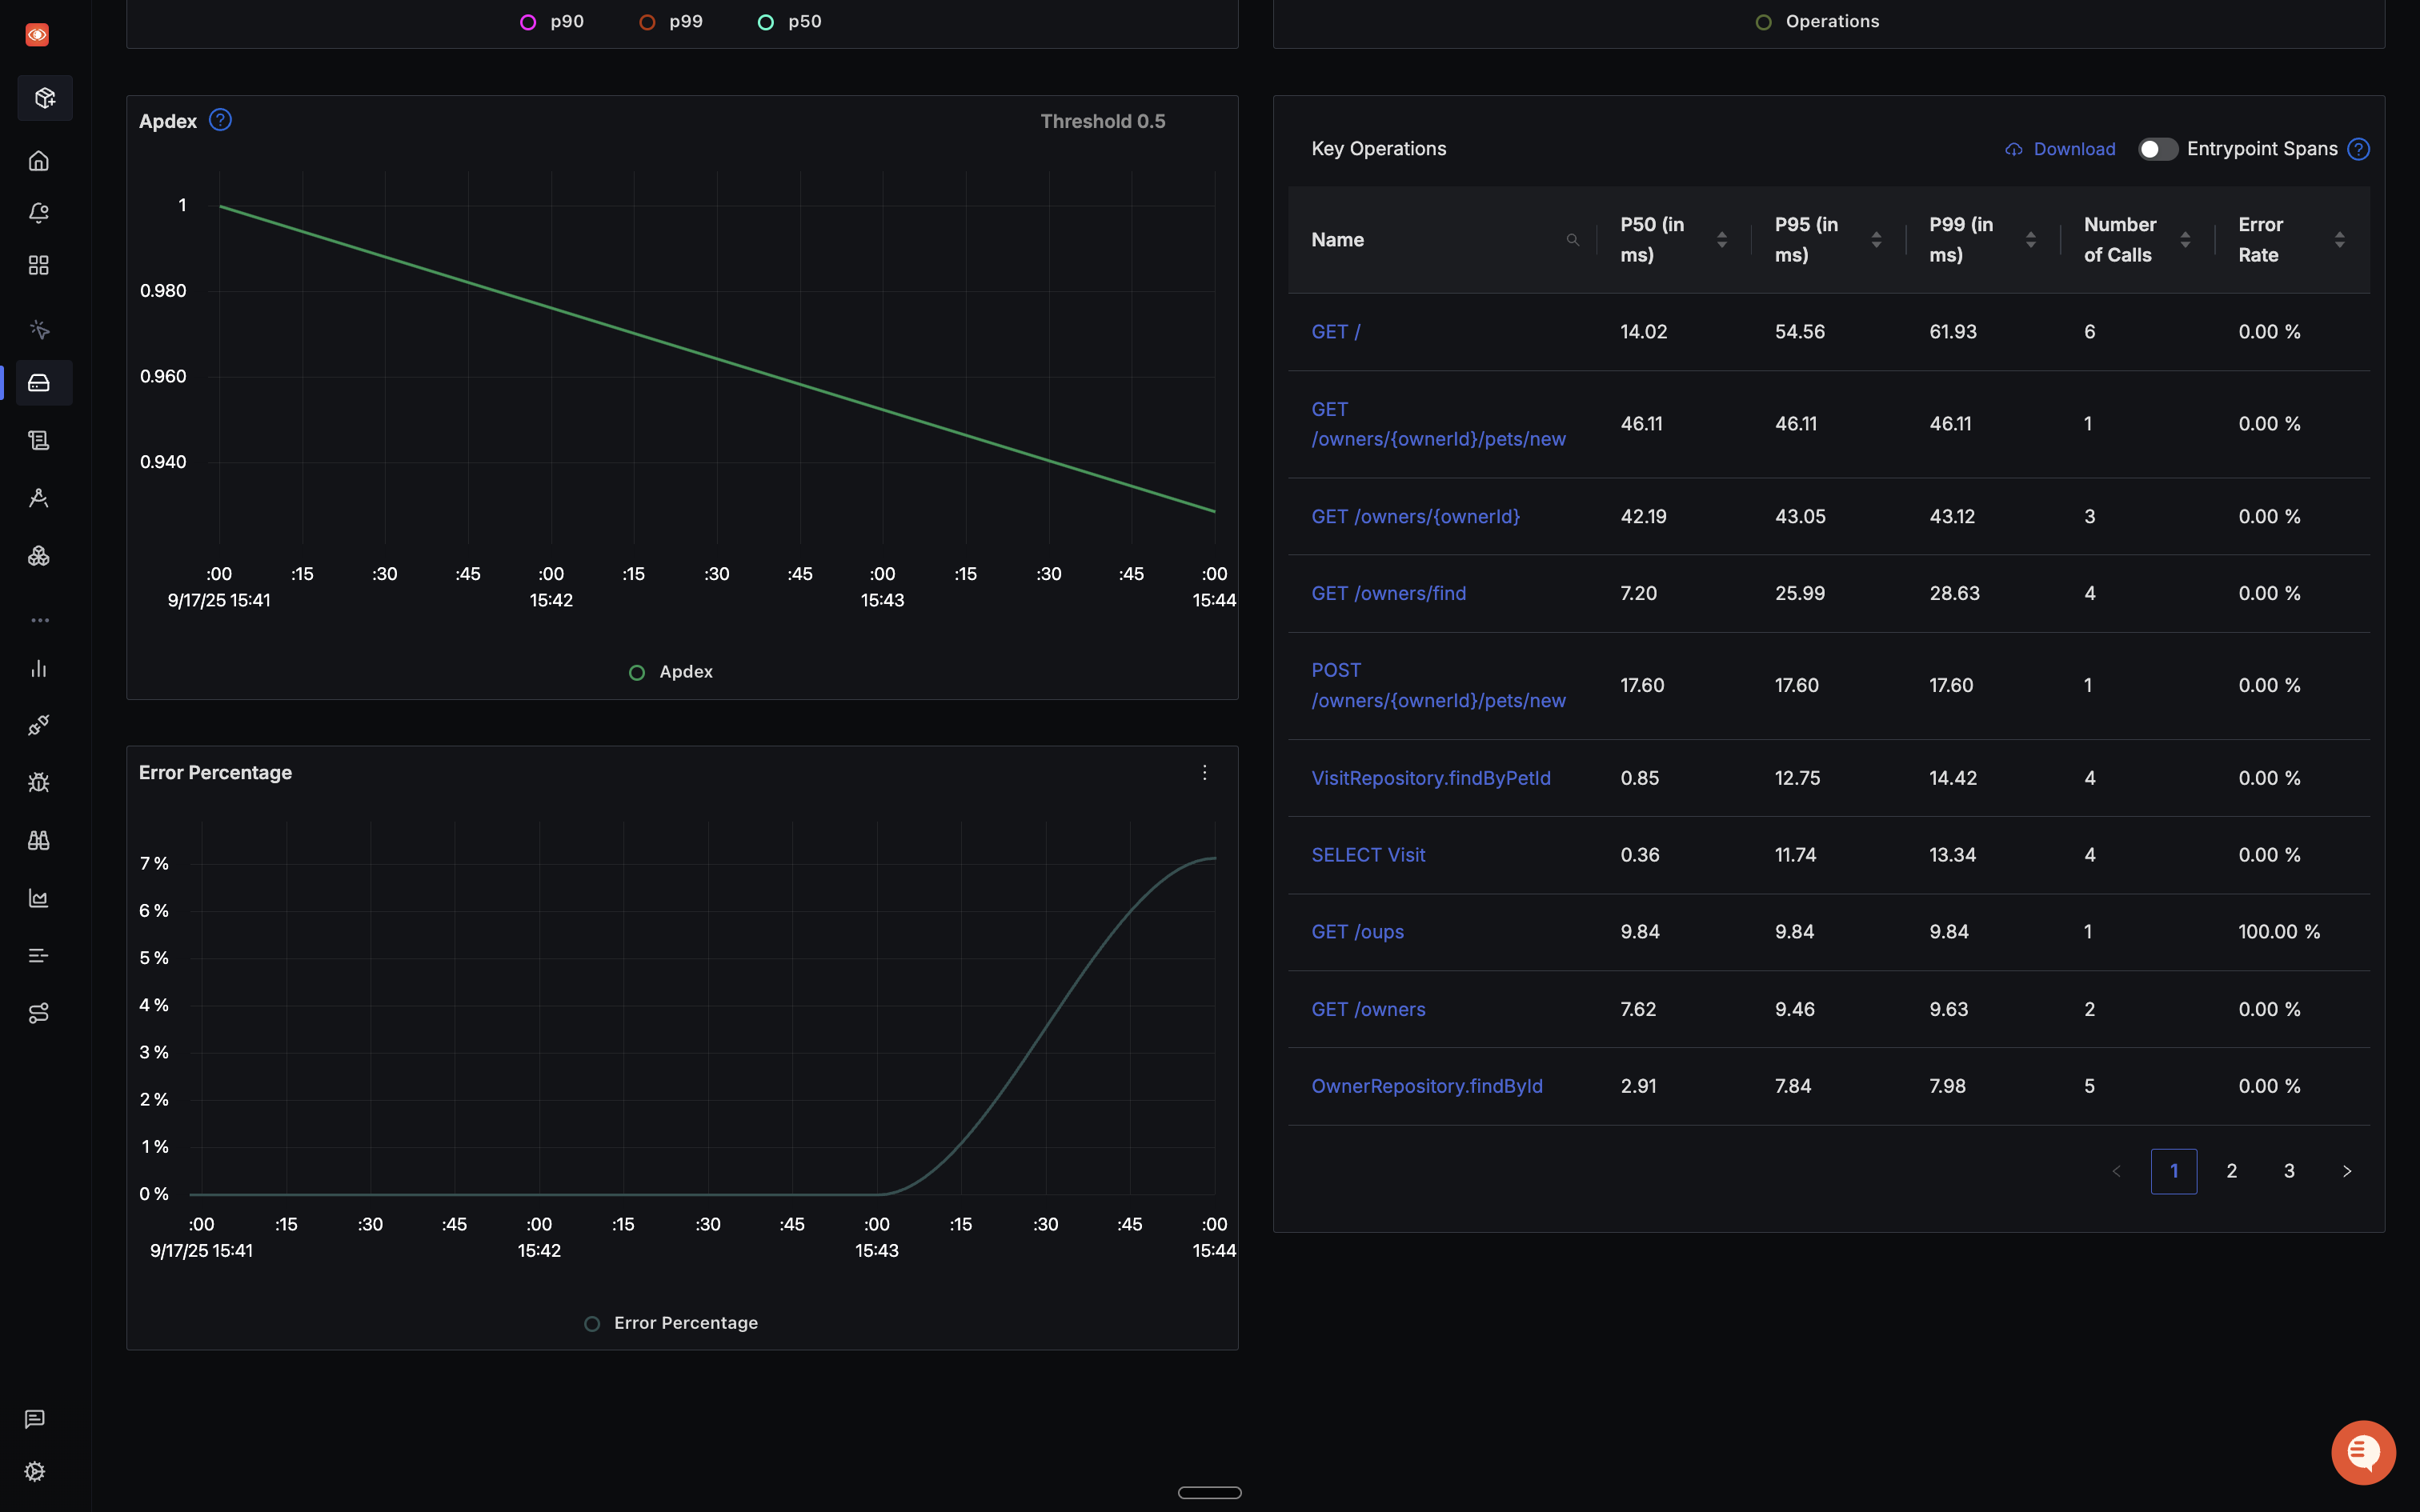
When you click on the 'Spring-Pet-Clinic' application in the 'Services' tab, you will find an overview of your application in the 'Overview' tab containing information on the Latency, Rate, Apdex, Key Operations, and Error Rate. You can also see the tabs for DB Call Metrics and External Metrics. You can select each of the charts to get more insights.
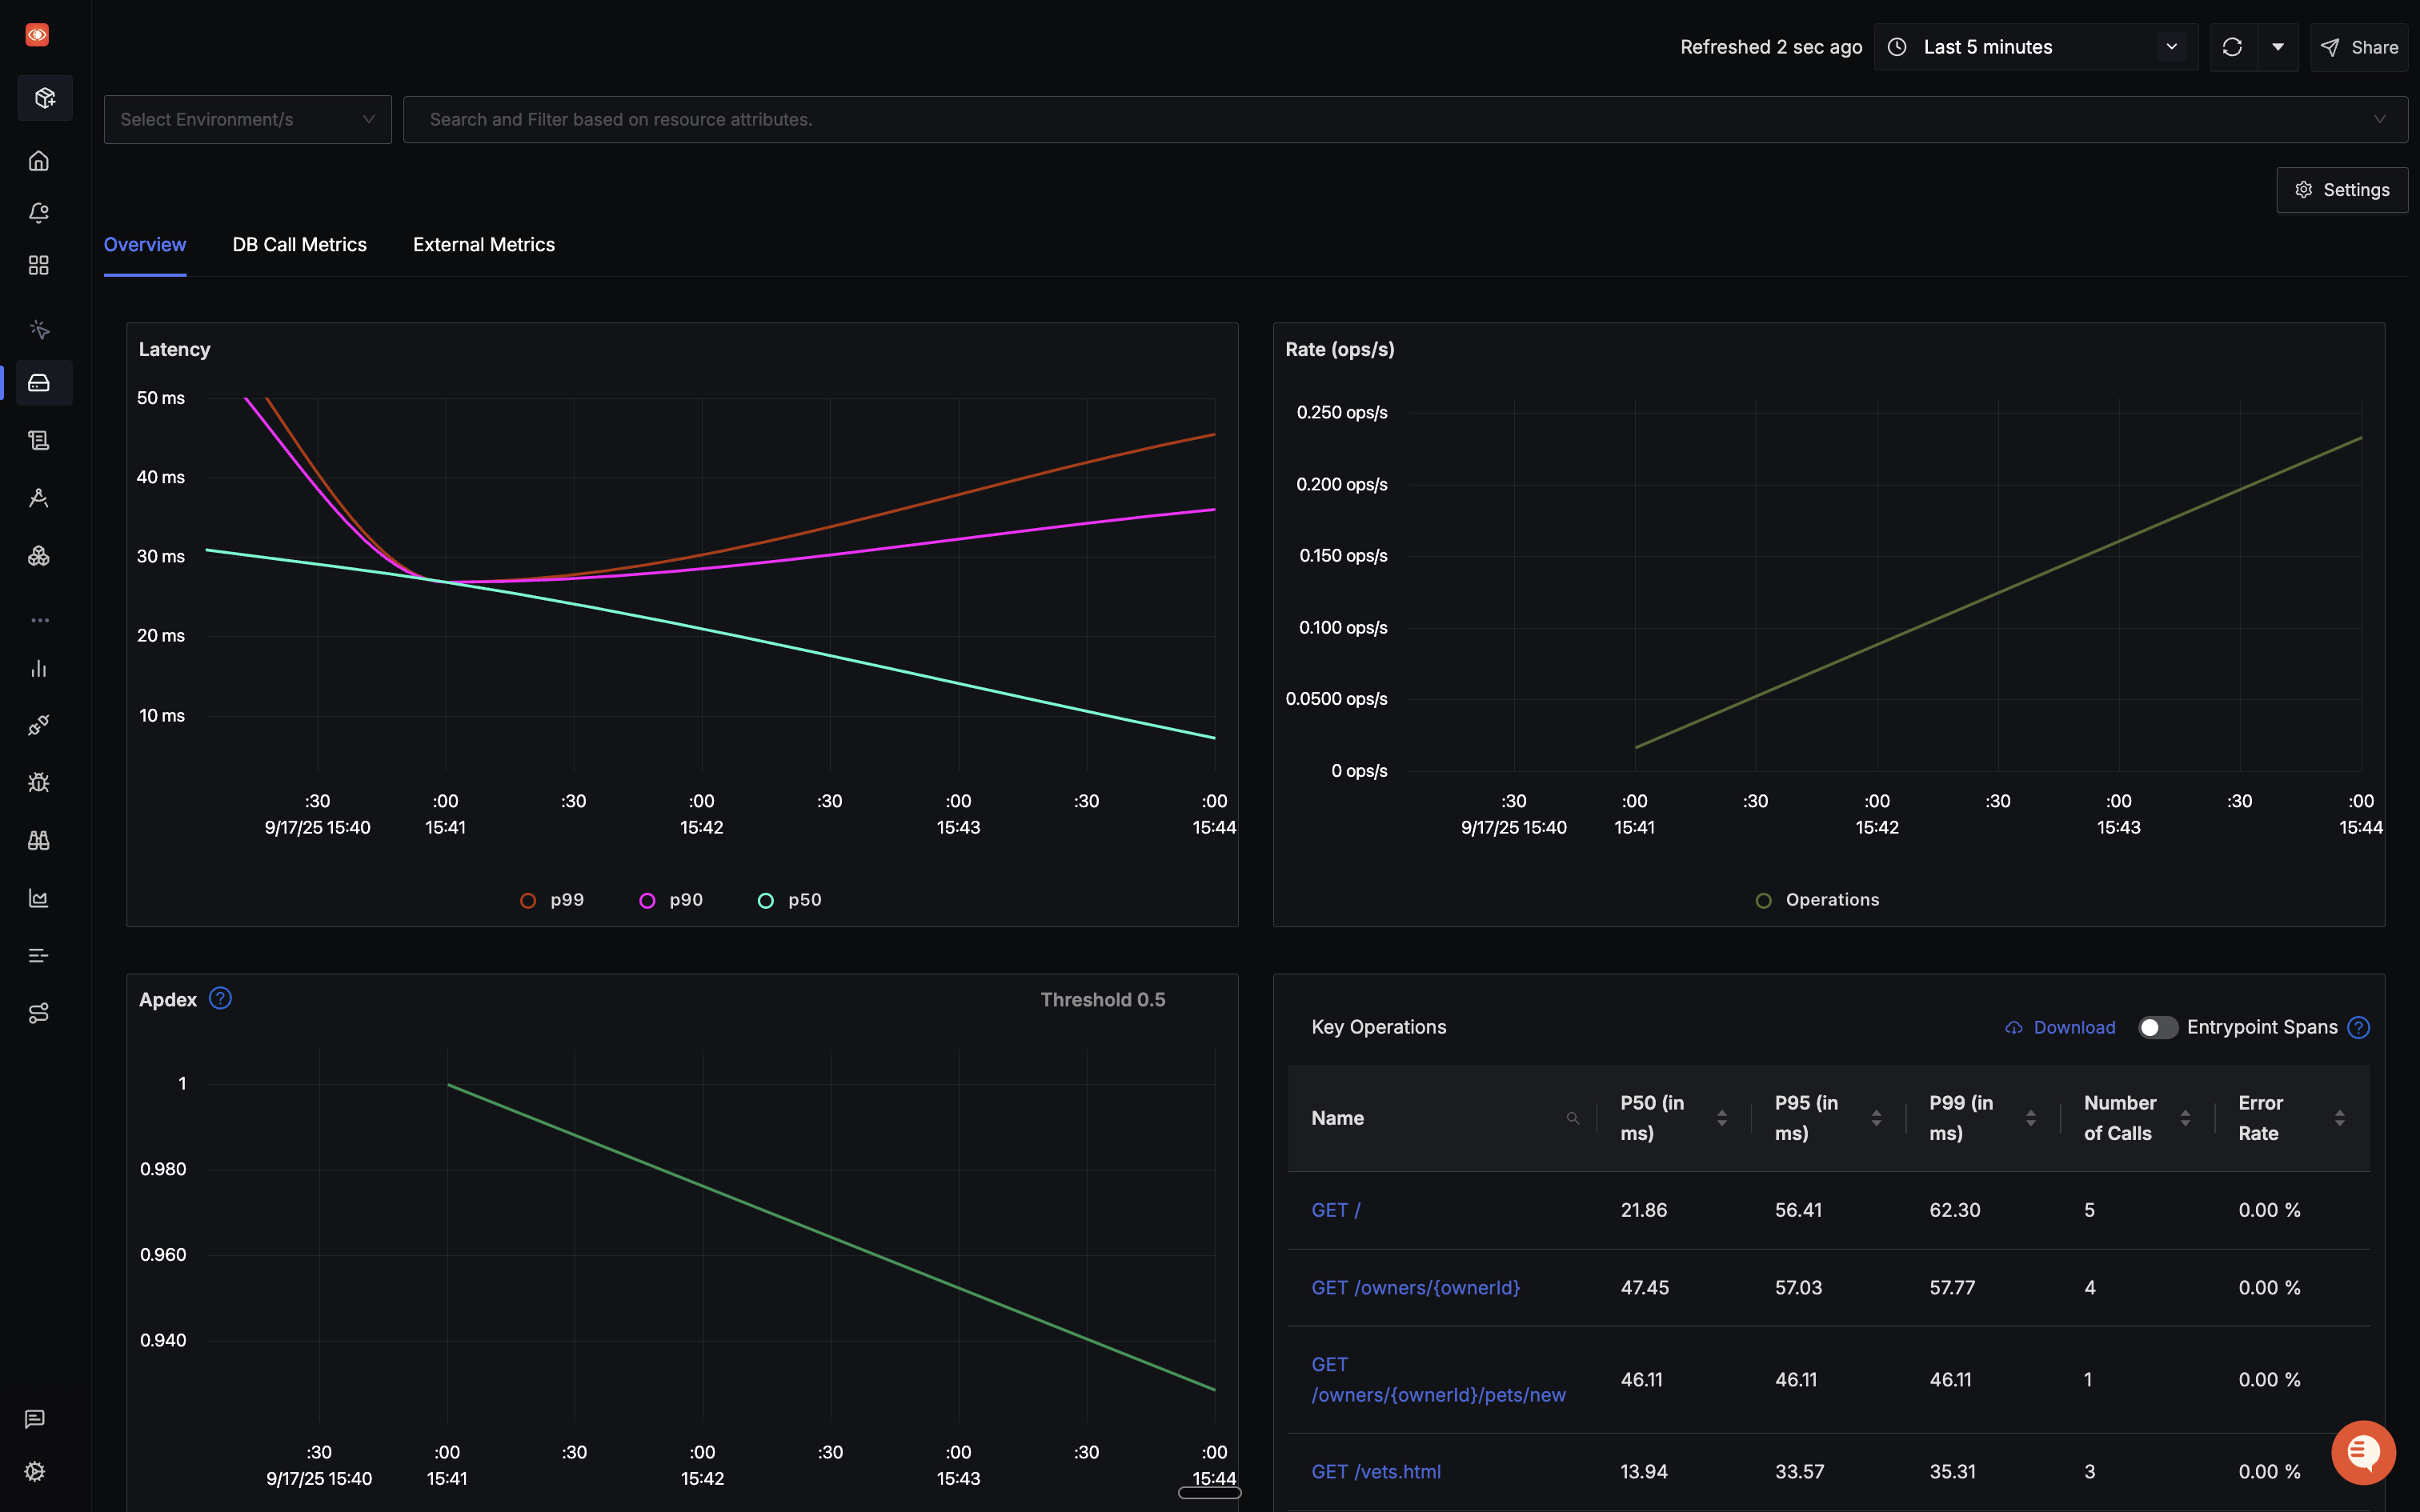
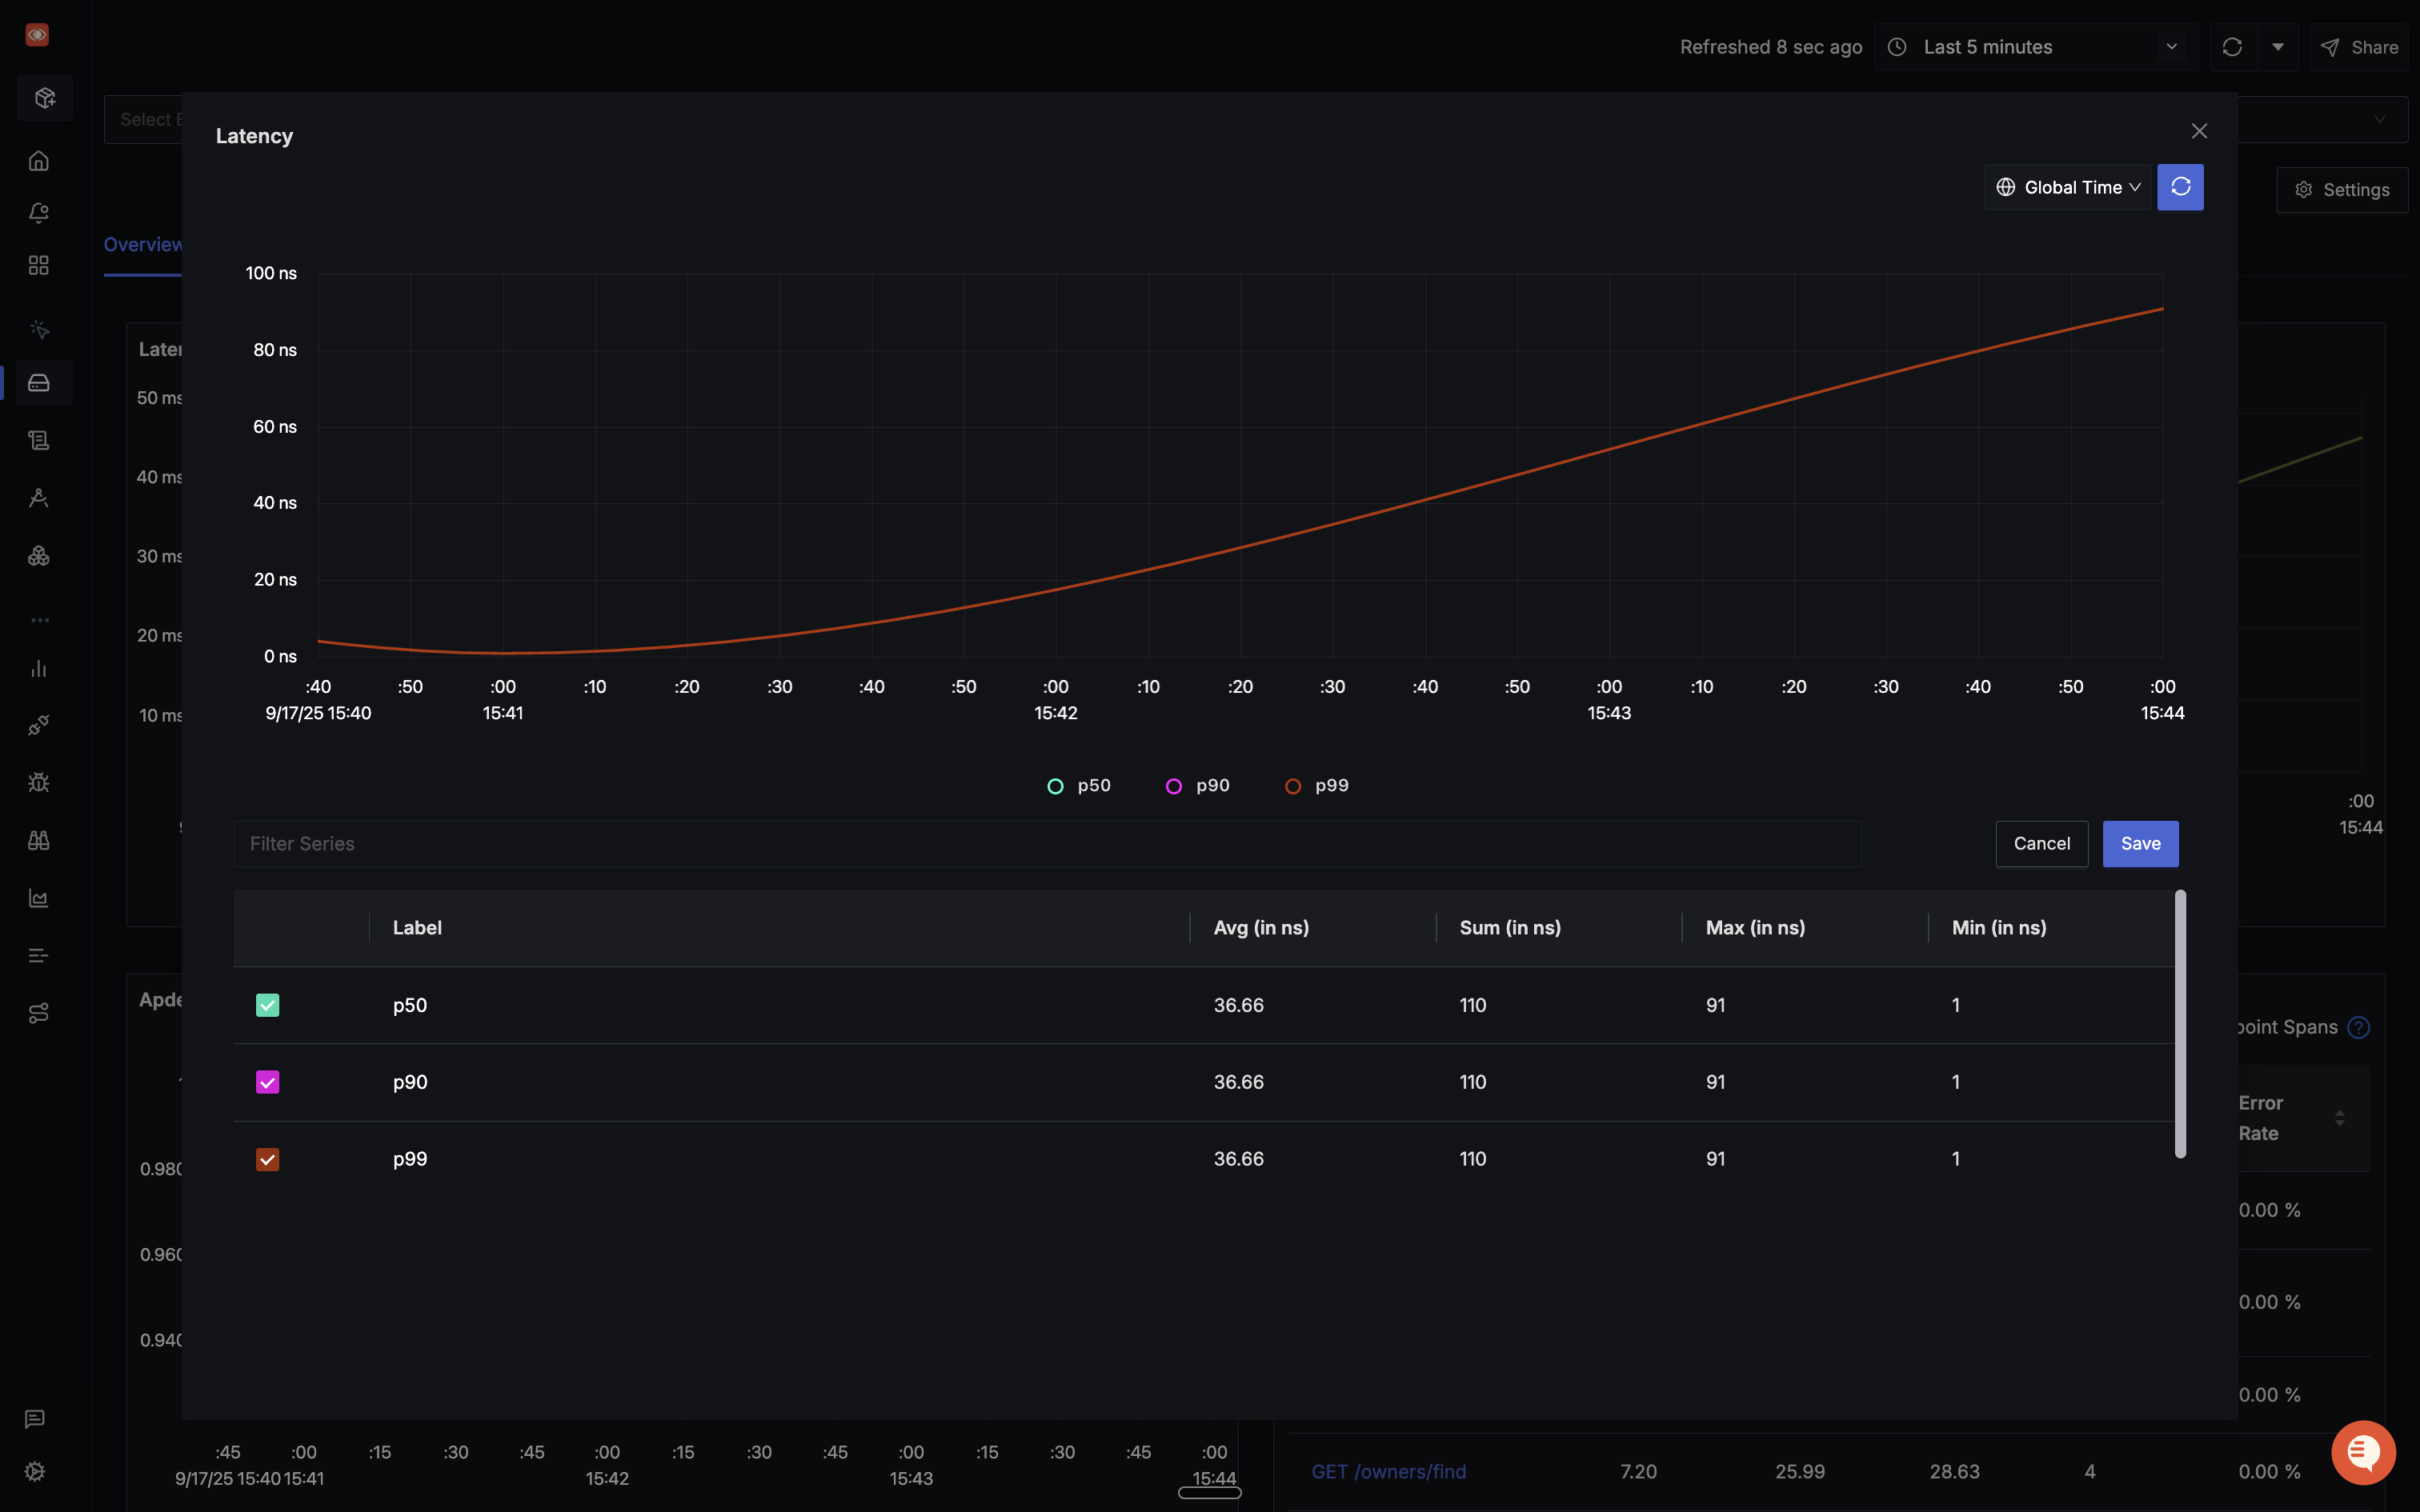
By selecting and viewing the Latency chart, you gain access to crucial percentiles – p99, p90, and p50. These metrics offer valuable insights into the distribution of response times.
Beneath, you can observe the Apdex (Application Performance Index) is at 0, and the Error percentage chart has no data. This is because there was no failure in the requests sent to the application, resulting in no data for the error percentage. The Key Operations chart, on the other hand, shows all the requests made and activities carried out in the application.
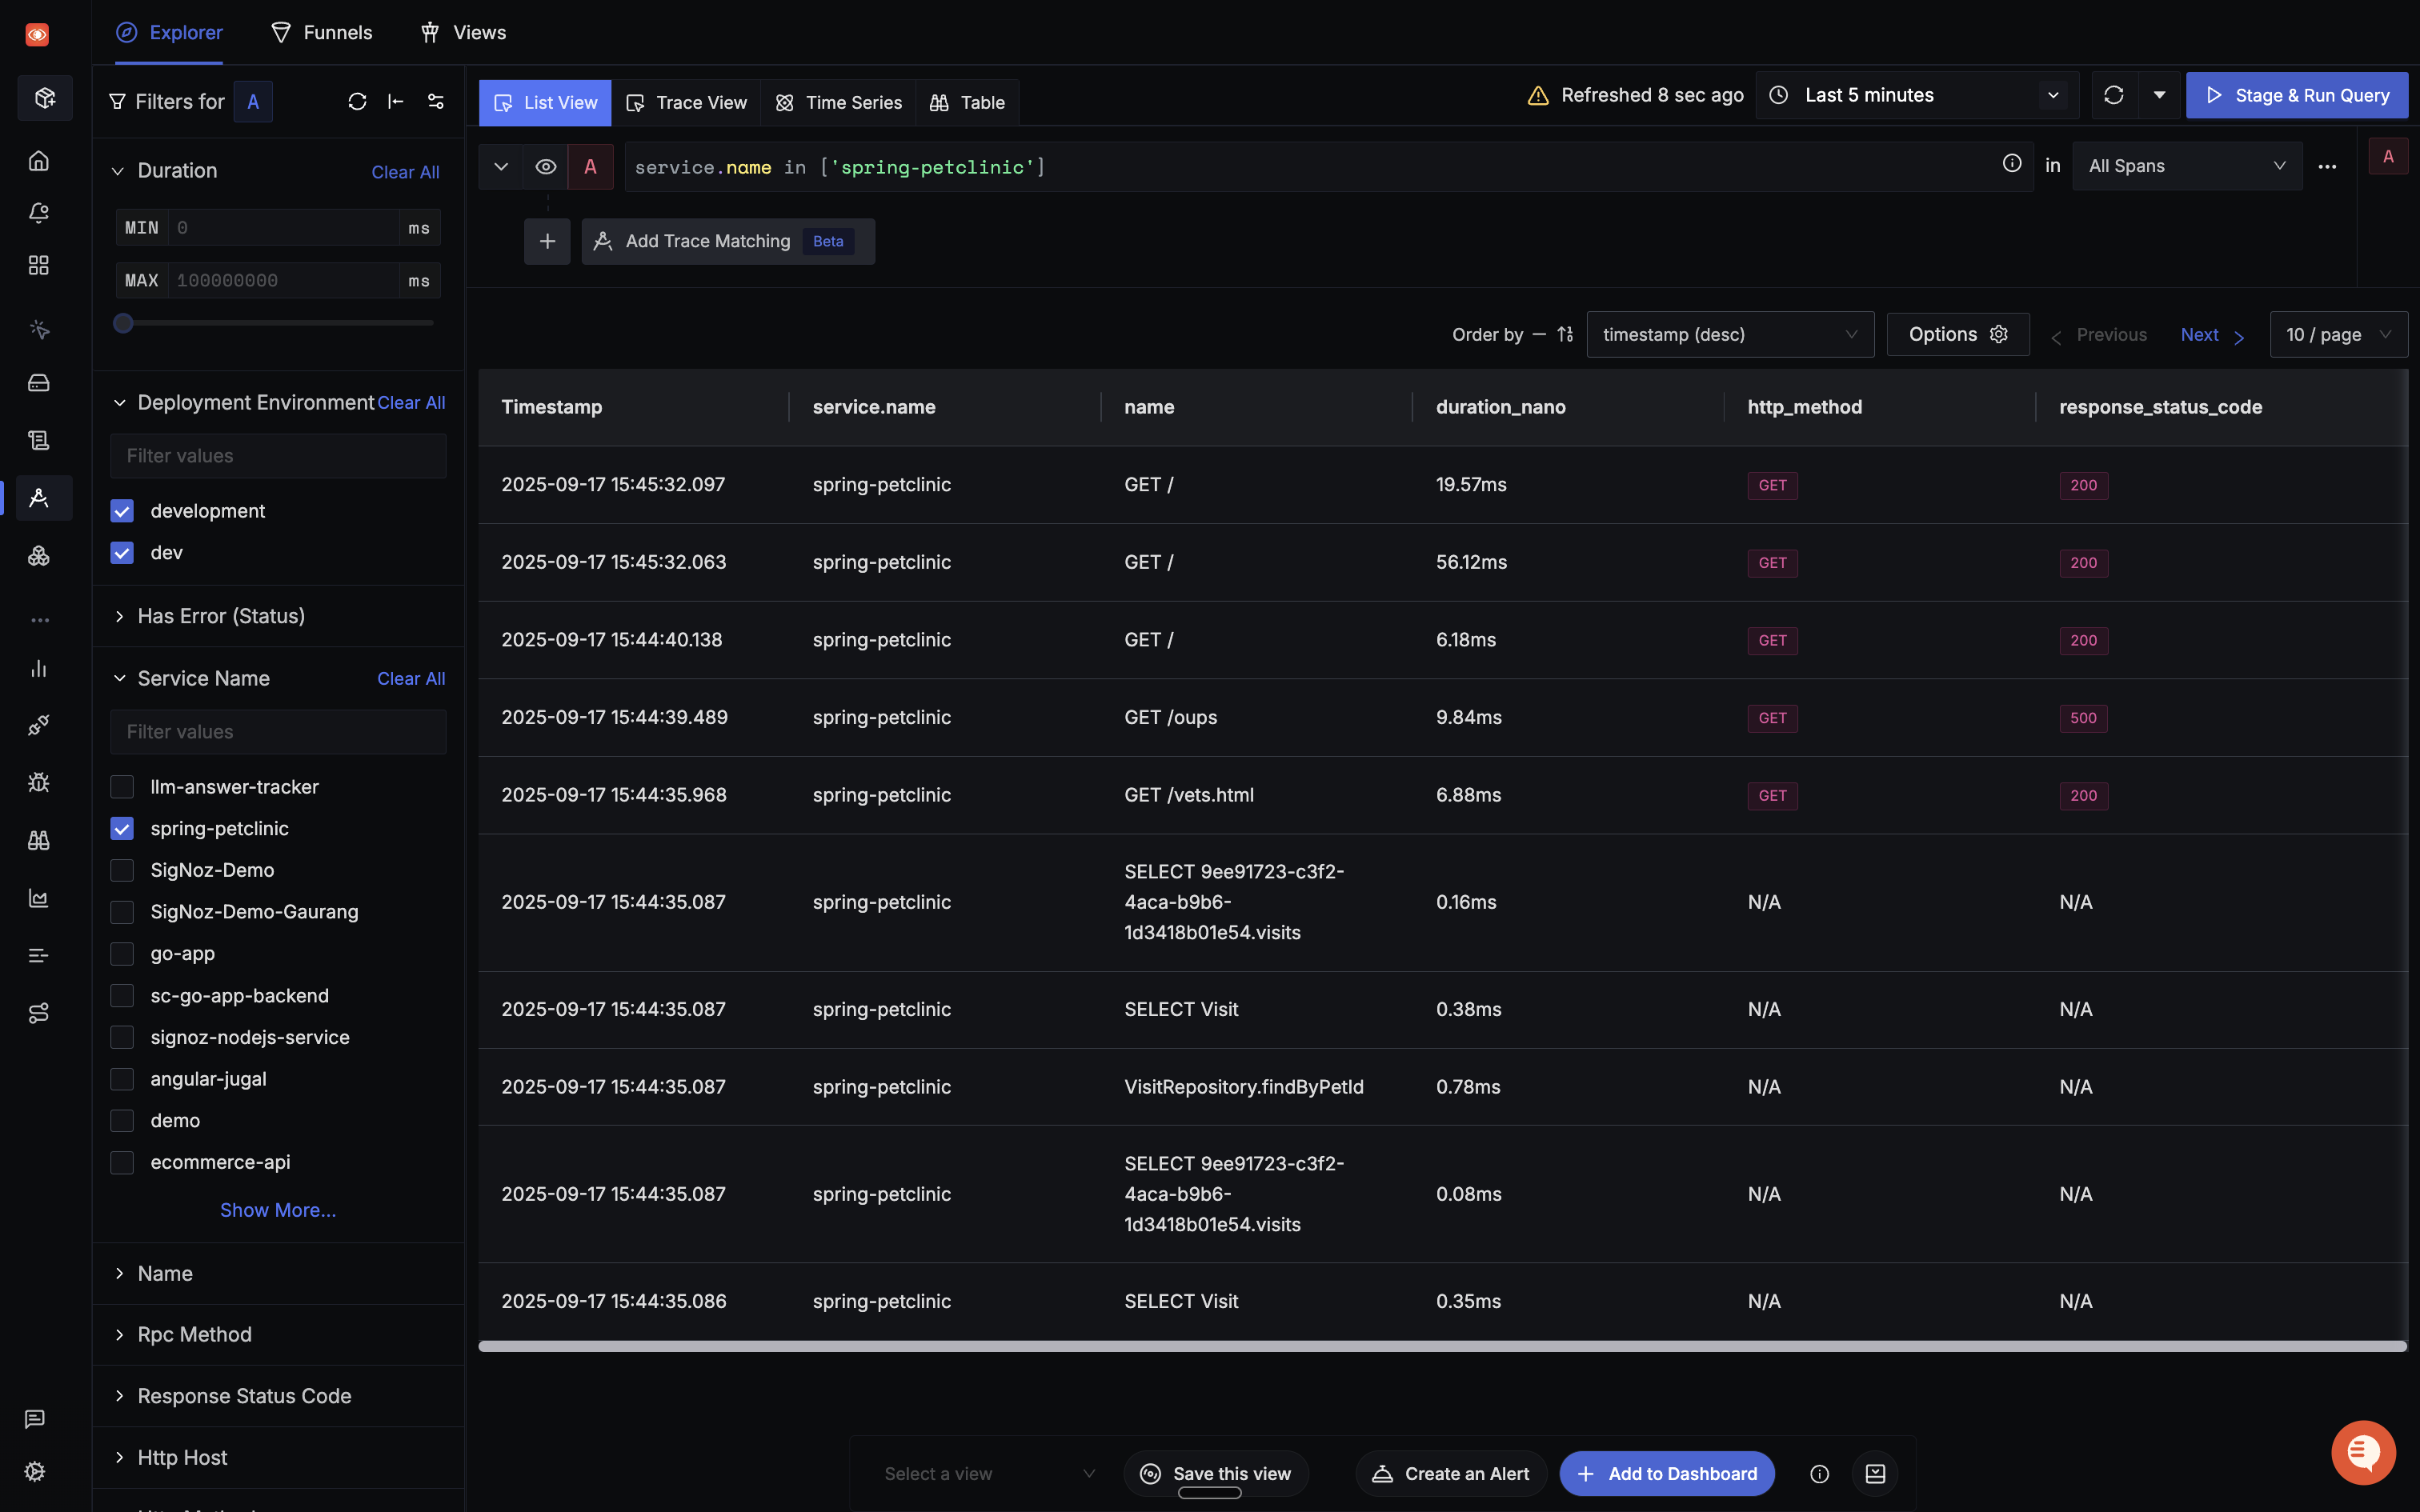
In the Traces tab, you can utilize the ‘Trace Explorer’ to filter traces by tags, choose specific services, set desired duration and status filters, and perform additional actions for refined trace viewing.
Conclusion
The OpenTelemetry Operator proves to be a crucial asset in streamlining observability within a Kubernetes cluster. By simplifying the deployment of OpenTelemetry components, it facilitates the seamless collection of telemetry data. This data can then be efficiently forwarded to SigNoz, a comprehensive open-source backend solution, enabling robust visualization and monitoring capabilities for enhanced operational insights.
FAQs
What Kubernetes versions are supported by the OpenTelemetry Operator?
The OpenTelemetry Operator supports Kubernetes versions 1.19 and later. Always check the official documentation for the most up-to-date compatibility information.
Can the OpenTelemetry Operator manage collectors outside of Kubernetes?
No, the OpenTelemetry Operator is designed to work within Kubernetes clusters. For non-Kubernetes environments, you'll need to use alternative deployment methods.
How does the OpenTelemetry Operator handle version upgrades of collectors?
The operator automatically updates collector instances when you update the OpenTelemetryCollector resource specification. It manages rolling updates to ensure minimal disruption.
Is it possible to use multiple collector instances with different configurations?
Yes, you can create multiple OpenTelemetryCollector resources, each with its own configuration. This allows you to tailor collectors for specific use cases or data types.
What is an OpenTelemetry Operator?
An OpenTelemetry Operator is a Kubernetes Operator that manages OpenTelemetry Collectors and auto-instrumentation of workloads. It simplifies the deployment and management of OpenTelemetry in a Kubernetes environment.
What are the main components of the OpenTelemetry Operator?
The OpenTelemetry Operator provides two Custom Resource Definitions (CRDs):
- OpenTelemetryCollector: For deploying and managing OpenTelemetry Collectors in your Kubernetes cluster.
- Instrumentation: For configuring and injecting OpenTelemetry auto-instrumentation libraries into your workloads.
How does the OpenTelemetry Operator simplify observability in Kubernetes?
The OpenTelemetry Operator automates tasks such as deploying and managing OpenTelemetry Collectors, auto-instrumenting workloads, configuring Collectors and Exporters, and routing telemetry data to multiple destinations.
What are the deployment modes available for OpenTelemetryCollector?
The OpenTelemetryCollector can be deployed in four modes:
- Daemonset
- Sidecar
- StatefulSet
- Deployment (default mode)
How can I auto-instrument a Java application using the OpenTelemetry Operator?
You can auto-instrument a Java application by adding the annotation instrumentation.opentelemetry.io/inject-java: "true" to your pod specification in the Kubernetes deployment manifest. This signals the OpenTelemetry Operator to inject and configure OpenTelemetry auto-instrumentation libraries into the application.
What backend can I use to visualize the telemetry data collected by OpenTelemetry?
You can use SigNoz, an OpenTelemetry-native APM, to visualize and monitor the telemetry data collected by OpenTelemetry. SigNoz provides comprehensive dashboards for metrics, traces, and logs, making it well-suited for analyzing OpenTelemetry data.
How does the OpenTelemetry Operator handle different programming languages?
The OpenTelemetry Operator supports auto-instrumentation for multiple programming languages. In the example provided, it supports Java, Node.js, Python, and .NET. You can specify the auto-instrumentation image for each language in the Instrumentation custom resource.
Getting started with SigNoz
SigNoz Cloud is the easiest way to run SigNoz. Sign up for a free account and get 30 days of unlimited access to all features.

You can also install and self-host SigNoz yourself since it is open-source. With 24,000+ GitHub stars, open-source SigNoz is loved by developers. Find the instructions to self-host SigNoz.
Further Reading
