OpenTelemetry PHP | Monitoring a PHP application with OpenTelemetry
PHP is a widely popular server-side language and enjoys the top spot in terms of market share. Many world-famous organizations like Facebook have their applications written in PHP. WordPress, which powers 43% of all websites, is also built on PHP. In this tutorial, we will use OpenTelemetry to instrument a PHP application for telemetry data.
It’s essential to monitor your PHP application for performance issues and bugs. Application owners need good telemetry data from their application in order to monitor it effectively. That’s where OpenTelemetry comes into the picture. OpenTelmetry provides client libraries for many programming languages, including PHP, which can be used to instrument applications.
What is application instrumentation?
Instrumentation is the process of enabling your application code to generate telemetry data(logs, metrics, and traces). OpenTelemetry provides both auto instrumentation libraries and APIs to manually instrument your application.
OpenTelemetry helps in generating and collecting the telemetry data. The collected data then needs to be sent to a backend analysis tool. OpenTelemetry provides you the freedom to select any backend tool that can help you store and visualize the telemetry data. And that’s where SigNoz comes into the picture.
SigNoz & OpenTelemetry
SigNoz.io is a full-stack open-source application monitoring and observability platform which can be installed within your infra. It provides metrics monitoring, distributed tracing, exceptions monitoring, and custom dashboards - everything under a single pane of glass. You can also set alerts on your critical metrics to keep yourself notified.
SigNoz is built to natively support OpenTelemerty, thus making it a great choice for the OpenTelemetry backend.
Installing SigNoz
SigNoz can be installed on macOS or Linux computers in just three steps by using a simple installation script.
The install script automatically installs Docker Engine on Linux. However, on macOS, you must manually install Docker Engine before running the install script.
git clone -b main https://github.com/SigNoz/signoz.git
cd signoz/deploy/
./install.sh
You can visit our documentation for instructions on how to install SigNoz using Docker Swarm and Helm Charts.

When you are done installing SigNoz, you can access the UI at http://localhost:3301/application
Instrument your PHP app with OpenTelemetry
Step 1: Get sample PHP app
It contains the already instrumented sample boilerplate code. The below mentioned steps will tell us how we did it.
git clone git@github.com:SigNoz/sample-php-app.git
Step 2: Import the required dependencies from OTel PHP library:
use OpenTelemetry\SDK\Trace\SpanExporter\ConsoleSpanExporterFactory;
use OpenTelemetry\SDK\Trace\SpanProcessor\SimpleSpanProcessor;
use OpenTelemetry\SDK\Trace\TracerProvider;
use OpenTelemetry\API\Trace\SpanKind;
Step 3: Initialise the tracer module and create tracer:
File location: src/1-getting-started-console-exporter.php
$tracerProvider =  new TracerProvider(
    new SimpleSpanProcessor(
        (new ConsoleSpanExporterFactory())->create()
    )
);

$tracer = $tracerProvider->getTracer('io.signoz.php.example');
Step 4: Creating spans
Create root span and activate it:
$rootSpan = $tracer->spanBuilder('root')->setSpanKind(SpanKind::KIND_SERVER)->startSpan();
$rootScope = $rootSpan->activate();
Create and activate your first span:
$span1 = $tracer->spanBuilder('foo')->setSpanKind(SpanKind::KIND_SERVER)->startSpan();
$scope1 = $span1->activate();
Create another span:
$span2 = $tracer->spanBuilder('bar')->setSpanKind(SpanKind::KIND_SERVER)->startSpan();
Make sure to end them:
$span2->end();
$span1->end();
$scope1->detach();
Now end the root span:
$rootSpan->end();
$rootScope->detach();
Here’s how it looks when everything is assembled with a bit of error handling:
File location: src/1-getting-started-console-exporter.php
<?php

declare(strict_types=1);
require __DIR__ . '/../vendor/autoload.php';

use OpenTelemetry\SDK\Trace\SpanExporter\ConsoleSpanExporterFactory;
use OpenTelemetry\SDK\Trace\SpanProcessor\SimpleSpanProcessor;
use OpenTelemetry\SDK\Trace\TracerProvider;
use OpenTelemetry\API\Trace\SpanKind;

echo 'Starting ConsoleSpanExporter' . PHP_EOL;

$tracerProvider =  new TracerProvider(
    new SimpleSpanProcessor(
        (new ConsoleSpanExporterFactory())->create()
    )
);

$tracer = $tracerProvider->getTracer('io.signoz.php.example',);

$rootSpan = $tracer->spanBuilder('root')->setSpanKind(SpanKind::KIND_SERVER)->startSpan();
$rootScope = $rootSpan->activate();

try {
    $span1 = $tracer->spanBuilder('foo')->setSpanKind(SpanKind::KIND_SERVER)->startSpan();
    $scope1 = $span1->activate();

    try {
        $span2 = $tracer->spanBuilder('bar')->setSpanKind(SpanKind::KIND_SERVER)->startSpan();
        echo 'OpenTelemetry welcomes PHP' . PHP_EOL;
    } finally {
        $span2->end();
    }
} finally {
    $span1->end();
    $scope1->detach();
}
$rootSpan->end();
$rootScope->detach();
Step 5: Running the PHP application
Run your PHP application with the following command:
# at the root of the dir run
composer install
then,
# cd into the src
php 1-getting-started-console-exporter.php
You’ll see an output like this:
//Output
Starting ConsoleSpanExporter
OpenTelemetry welcomes PHP
[
    {
        "name": "bar",
        "context": {
            "trace_id": "8e447a8a939de0a65c3d2c5255012398",
            "span_id": "b829010efdadb302",
            "trace_state": ""
        },
        "resource": {
            "host.name": "Pranshus-MacBook-Pro.local",
            "host.arch": "arm64",
            "os.type": "darwin",
            "os.description": "21.4.0",
            "os.name": "Darwin",
            "os.version": "Darwin Kernel Version 21.4.0: Fri Mar 18 00:47:26 PDT 2022; root:xnu-8020.101.4~15\/RELEASE_ARM64_T8101",
            "process.pid": 42913,
            "process.executable.path": "\/opt\/homebrew\/Cellar\/php\/8.1.5\/bin\/php",
            "process.command": ".\/src\/1-getting-started-console-exporter.php",
            "process.command_args": [
                ".\/src\/1-getting-started-console-exporter.php"
            ],
            "process.owner": "pranshuchittora",
            "process.runtime.name": "cli",
            "process.runtime.version": "8.1.5",
            "telemetry.sdk.name": "opentelemetry",
            "telemetry.sdk.language": "php",
            "telemetry.sdk.version": "dev-main",
            "service.name": "unknown_service"
        },
        "parent_span_id": "c6b0f081c30f5519",
        "kind": "KIND_SERVER",
        "start": 1652959406327378349,
        "end": 1652959406327383891,
        "attributes": [],
        "status": {
            "code": "Unset",
            "description": ""
        },
        "events": [],
        "links": []
    }
]
[
    {
        "name": "foo",
        "context": {
            "trace_id": "8e447a8a939de0a65c3d2c5255012398",
            "span_id": "c6b0f081c30f5519",
            "trace_state": ""
        },
        "resource": {
            "host.name": "Pranshus-MacBook-Pro.local",
            "host.arch": "arm64",
            "os.type": "darwin",
            "os.description": "21.4.0",
            "os.name": "Darwin",
            "os.version": "Darwin Kernel Version 21.4.0: Fri Mar 18 00:47:26 PDT 2022; root:xnu-8020.101.4~15\/RELEASE_ARM64_T8101",
            "process.pid": 42913,
            "process.executable.path": "\/opt\/homebrew\/Cellar\/php\/8.1.5\/bin\/php",
            "process.command": ".\/src\/1-getting-started-console-exporter.php",
            "process.command_args": [
                ".\/src\/1-getting-started-console-exporter.php"
            ],
            "process.owner": "pranshuchittora",
            "process.runtime.name": "cli",
            "process.runtime.version": "8.1.5",
            "telemetry.sdk.name": "opentelemetry",
            "telemetry.sdk.language": "php",
            "telemetry.sdk.version": "dev-main",
            "service.name": "unknown_service"
        },
        "parent_span_id": "b641f1ef2683f70f",
        "kind": "KIND_SERVER",
        "start": 1652959406327364474,
        "end": 1652959406327551099,
        "attributes": [],
        "status": {
            "code": "Unset",
            "description": ""
        },
        "events": [],
        "links": []
    }
]
[
    {
        "name": "root",
        "context": {
            "trace_id": "8e447a8a939de0a65c3d2c5255012398",
            "span_id": "b641f1ef2683f70f",
            "trace_state": ""
        },
        "resource": {
            "host.name": "Pranshus-MacBook-Pro.local",
            "host.arch": "arm64",
            "os.type": "darwin",
            "os.description": "21.4.0",
            "os.name": "Darwin",
            "os.version": "Darwin Kernel Version 21.4.0: Fri Mar 18 00:47:26 PDT 2022; root:xnu-8020.101.4~15\/RELEASE_ARM64_T8101",
            "process.pid": 42913,
            "process.executable.path": "\/opt\/homebrew\/Cellar\/php\/8.1.5\/bin\/php",
            "process.command": ".\/src\/1-getting-started-console-exporter.php",
            "process.command_args": [
                ".\/src\/1-getting-started-console-exporter.php"
            ],
            "process.owner": "pranshuchittora",
            "process.runtime.name": "cli",
            "process.runtime.version": "8.1.5",
            "telemetry.sdk.name": "opentelemetry",
            "telemetry.sdk.language": "php",
            "telemetry.sdk.version": "dev-main",
            "service.name": "unknown_service"
        },
        "parent_span_id": "",
        "kind": "KIND_SERVER",
        "start": 1652959406327223724,
        "end": 1652959406327563766,
        "attributes": [],
        "status": {
            "code": "Unset",
            "description": ""
        },
        "events": [],
        "links": []
    }
]
Monitor your PHP application with SigNoz
For this, we will be generating spans using a for loop. Also, we will be attaching attributes in each span which can help us collect important metadata that proves helpful during debugging.
Import OTel and Guzzle (for HTTP) dependencies:
File location: src/2-send-trace-to-collector.php
use OpenTelemetry\SDK\Trace\TracerProviderFactory;
use OpenTelemetry\SDK\Common\Attribute\Attributes;
use OpenTelemetry\SDK\Trace\SpanProcessor\SimpleSpanProcessor;
use OpenTelemetry\SDK\Trace\TracerProvider;
We need to define the environment variable for OTLP endpoint. SigNoz uses port 4318 to listen to data collected by OpenTelemetry from PHP applications. Since we have installed SigNoz on localhost, the OTLP endpoint is:
OTEL_EXPORTER_OTLP_ENDPOINT - http://localhost:4318/v1/traces
Define the environment variables:
putenv('OTEL_EXPORTER_OTLP_ENDPOINT=http://localhost:4318/v1/traces');  // SigNoz OTel collector's path
putenv('OTEL_EXPORTER_OTLP_PROTOCOL=http/protobuf');
Optionally you can pass the env variable while running the app.
Initialize the Tracer Provider (using environment variables):
$factory = new TracerProviderFactory();
$tracerProvider = $factory->create();
$tracer = $tracerProvider->getTracer('io.signoz.php.example');
Create and activate your root span:
$root = $span = $tracer->spanBuilder('root')->startSpan();
$rootScope = $span->activate();
Create, initialize, set data, and end spans inside the for loop:
for ($i = 0; $i < 3; $i++) {
    // start a span, register some events
    $span = $tracer->spanBuilder('loop-' . $i)->startSpan();

    $span->setAttribute('remote_ip', '1.2.3.4')
        ->setAttribute('country', 'USA');

    $span->addEvent('found_login' . $i, new Attributes([
        'id' => $i,
        'username' => 'otuser' . $i,
    ]));
    $span->addEvent('generated_session', new Attributes([
        'id' => md5((string) microtime(true)),
    ]));

    $span->end();
}
Don’t forget to end and deactivate the root span:
$root->end();
$rootScope->detach();
Run your PHP application:
> OTEL_SERVICE_NAME=signoz-php-app php ./src/2-send-trace-to-collector.php
Once you run your application, you can interact with it a bit to generate some dummy monitoring data. You can run the above command a few number of times to generate the data.
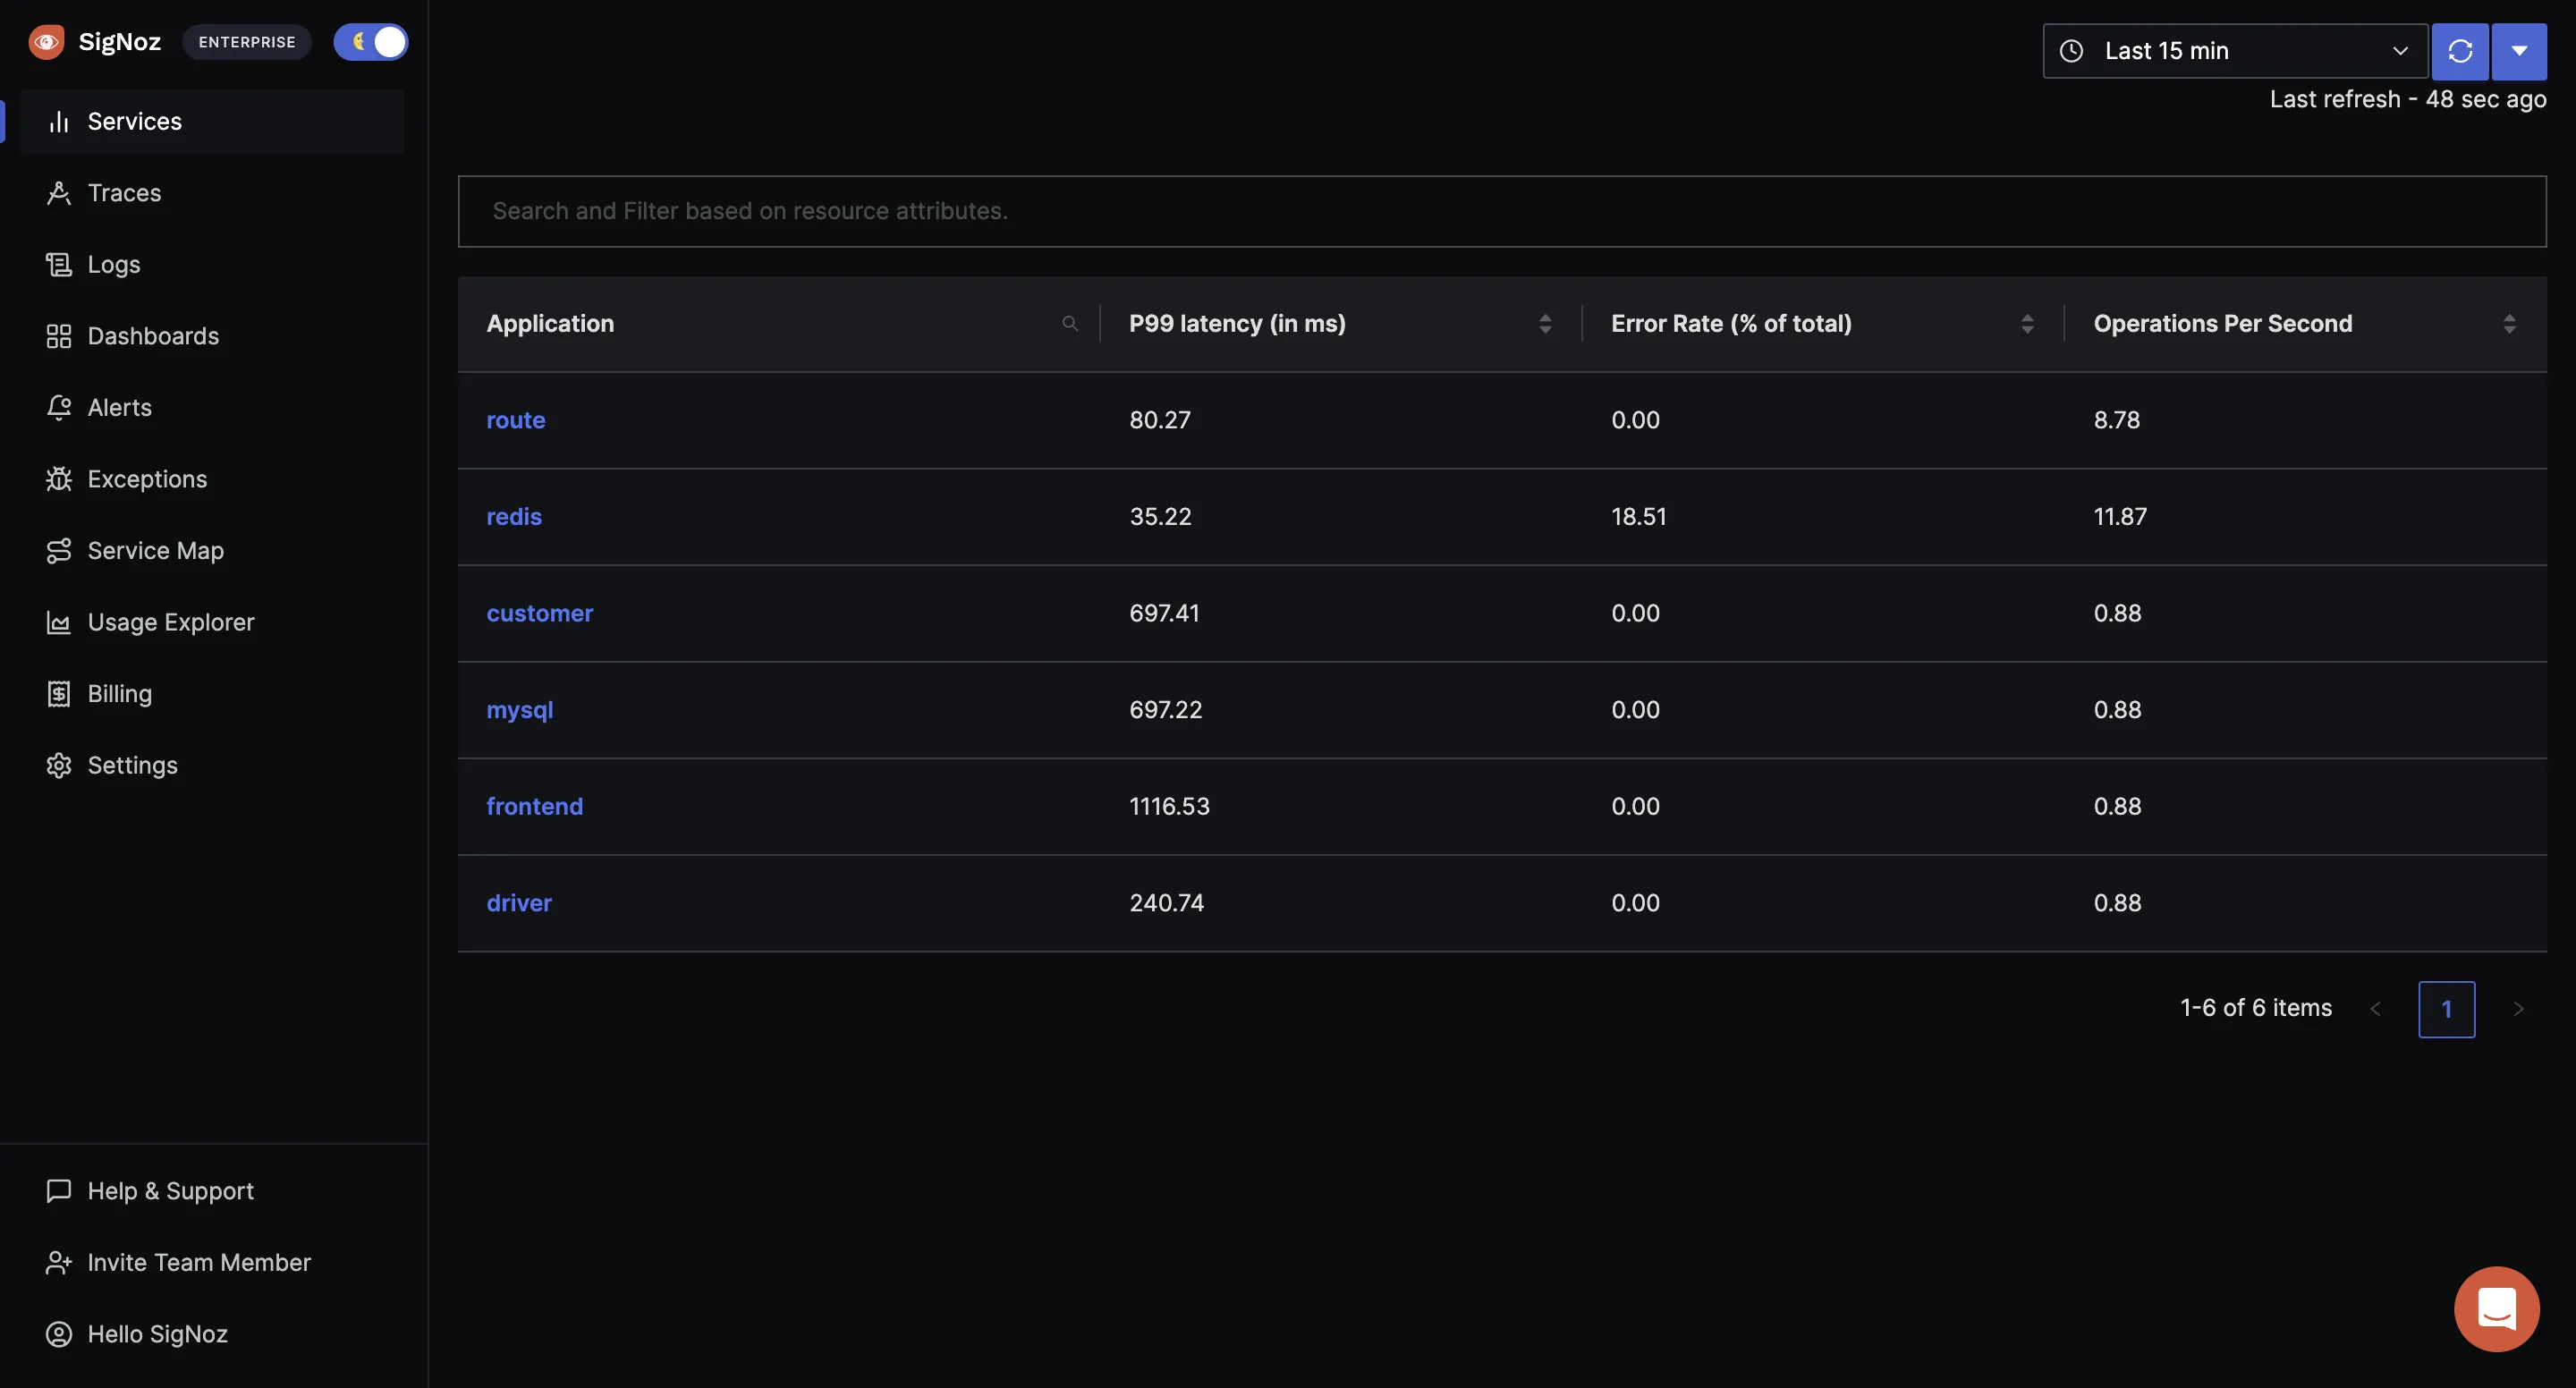
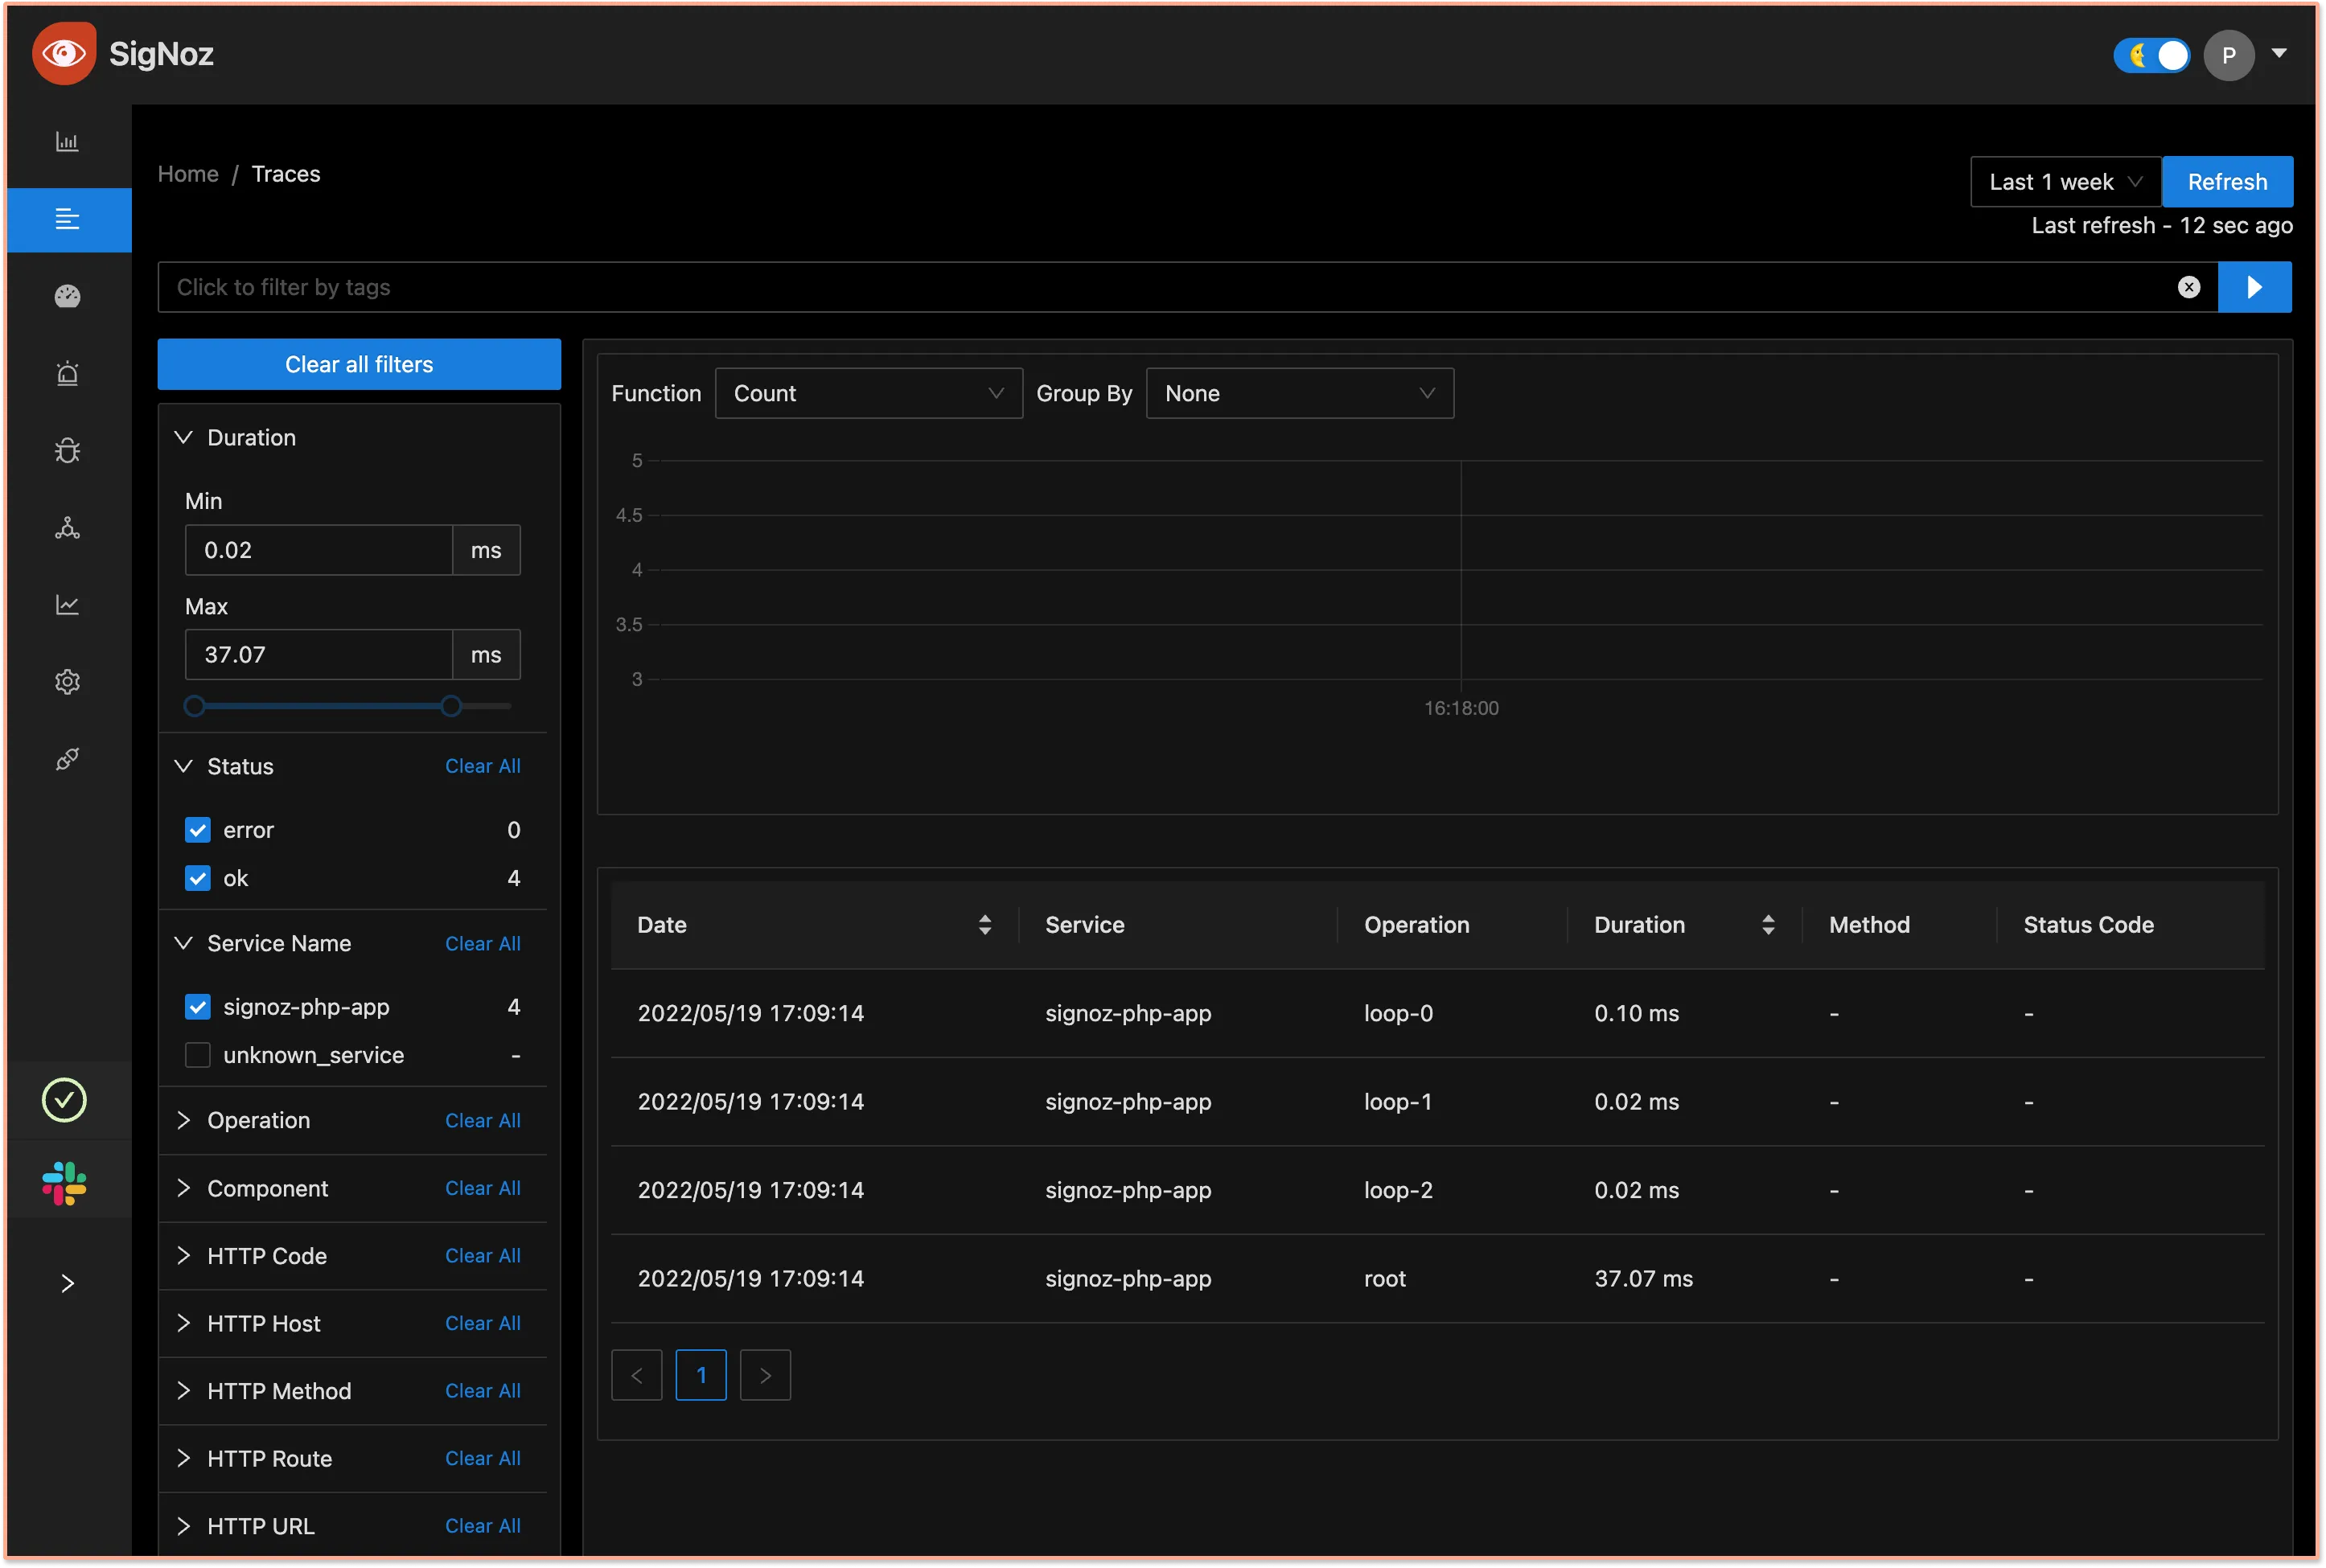
Now open SigNoz UI at: http://localhost:3301/application, and go to the Traces tab, and select the span from service signoz-php-app.
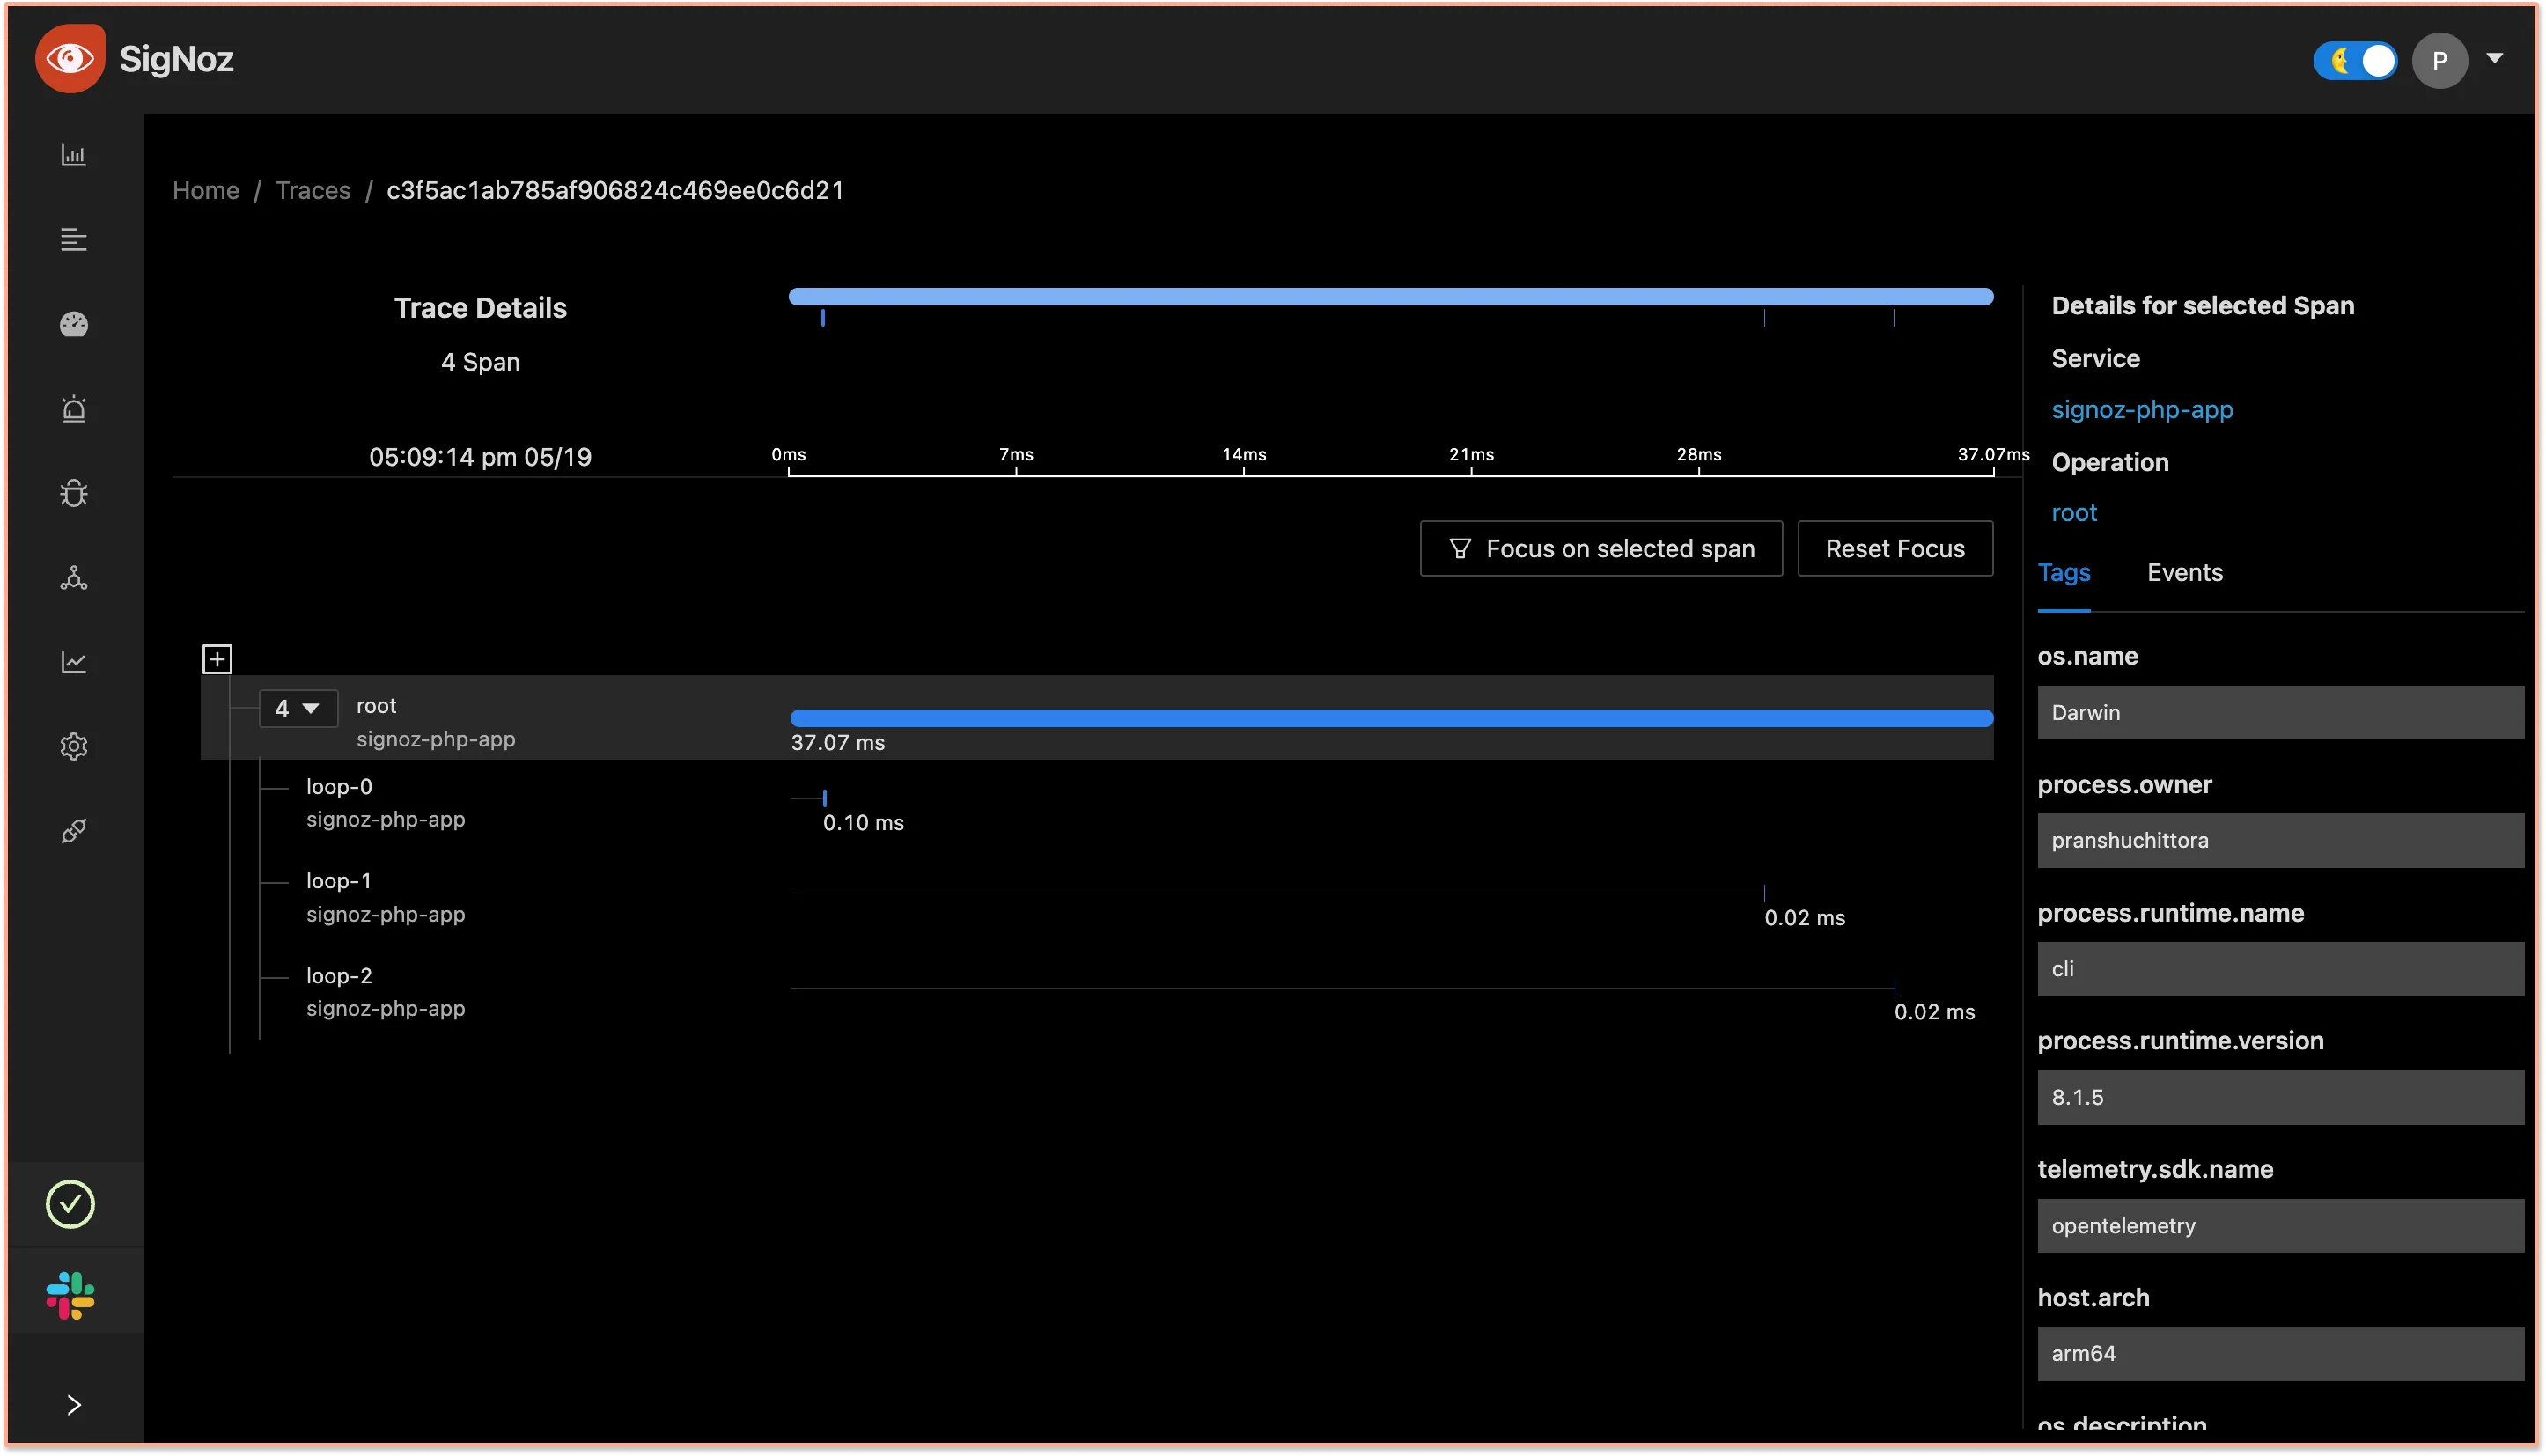
After selecting the span you will land on the Trace Detail Page where you can visualize the entire request with the help of Flamegraphs and Gantt charts. OpenTelemetry captures every component of a software system with the help of attributes(key-value pairs). You can also see these attributes for every span which will help you build more context.
Conclusion
Using OpenTelemetry libraries, you can instrument your PHP applications for setting up observability. You can then use an open-source APM tool like SigNoz to ensure the smooth performance of your PHP applications.
OpenTelemetry is the future for setting up observability for cloud-native apps. It is backed by a huge community and covers a wide variety of technology and frameworks. Using OpenTelemetry, engineering teams can instrument polyglot and distributed applications with peace of mind.
SigNoz is an open-source observability tool that comes with a SaaS-like experience. You can try out SigNoz by visiting its GitHub repo 👇
If you are someone who understands more from video, then you can watch the below video tutorial on the same with SigNoz.
If you have any questions or need any help in setting things up, join our slack community and ping us in #support channel.

Further Reading
