Using SigNoz MCP for the Development and Release Lifecycle
For most engineering teams, observability is a reactive tool. When something breaks in production, an alert fires, and you open your dashboards to figure out what went wrong, it's valuable but means you're always one step behind. The problem has already reached users before you even start investigating.
The development and release lifecycle is actually where most production incidents are born:
- A slow database query that wasn’t caught in staging
- A schema change that introduced a new error type
- A dependency that works fine under light load but falls apart under production traffic
All of these had one thing in common: they were issues that just weren’t caught early enough.
Shifting observability left means bringing the same visibility you use to debug production incidents into the earlier stages of the software lifecycle. You're able to catch and fix problems at the exact moment they're introduced and not after they've reached your users.
The SigNoz MCP server makes this practical. By connecting your AI assistant directly to your SigNoz instance, you can ask questions about your services in plain English from your IDE while you're building a feature in staging, or from your terminal right after a deploy goes out. You don’t need to manually query your telemetry data or sift through dashboards. You can do your investigations earlier in the lifecycle where fixing problems is cheaper and faster.
In this post we'll walk through two specific use cases that bring observability into the development and release lifecycle — catching performance problems during development before they ship to production, and validating deployments immediately after they go out.
The Cost of Finding Problems Late
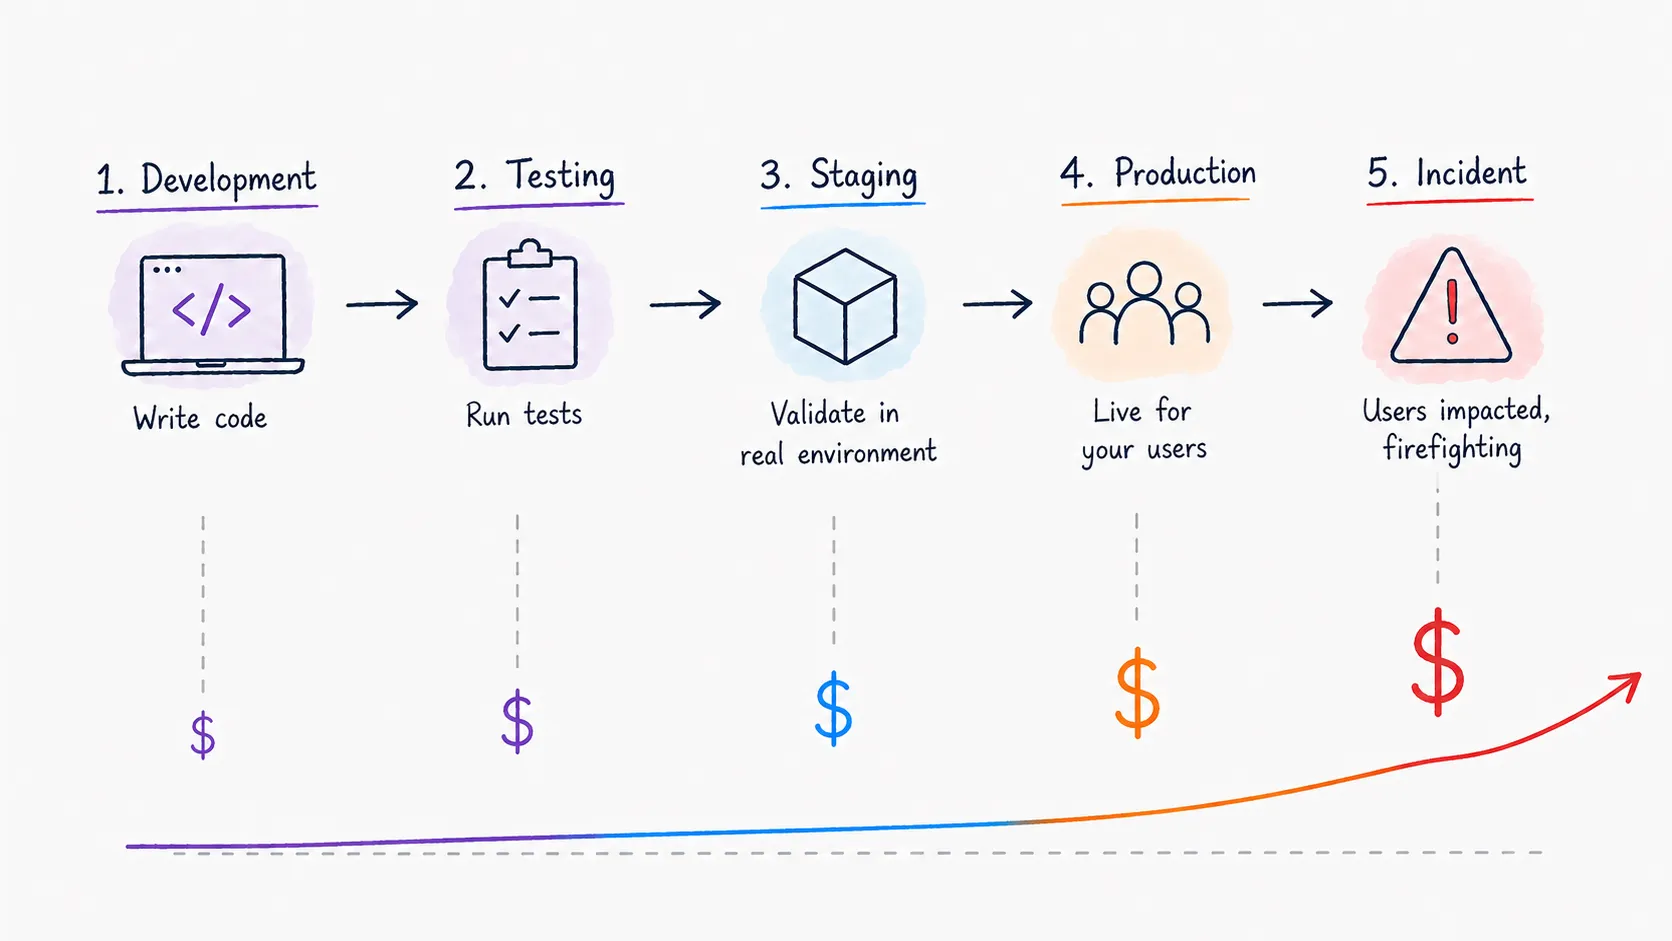
There's a well-known principle in software engineering that the cost of fixing a bug increases by orders of magnitude the later it's found. A problem caught during development takes minutes to fix but that same exact problem caught in production can mean an incident, an on-call engineer paged at 2am, and a postmortem.
Performance problems follow the same pattern, but they're harder to catch early because they often don't look like bugs. The feature works and tests pass, but nobody ran it under realistic production load. And when it is deployed, most teams just have to watch dashboards hoping nothing obvious breaks. But minor degradations don't always show up immediately or clearly enough to catch by eyeballing a panel. By the time problems surface through user complaints or firing alerts, the cost has shifted from a quick fix during development to an active incident response.
Optimizing Performance During Development
Most performance problems have a clear origin point. They trace back to:
- A specific commit
- A specific function
- A specific query
The tricky part is that by the time you have enough production traffic to expose them, you're already in reactive mode.
The solution is to instrument your staging environment the same way you instrument production, and use that telemetry to profile your code while you're still writing it. If your staging environment is sending traces to SigNoz, the MCP gives you a direct line to that data from wherever you're working — your IDE or your terminal — without even having to open up your browser.
You're building a new feature, it feels slow in staging, and instead of shipping it and hoping it's fine under production load, you simply ask the MCP:
Show me the span breakdown for the POST /checkout endpoint in staging for the last 30 minutes.
Which child spans are taking the most time, and are there any optimizations that can be made?
The MCP will show you the span breakdown for the endpoint you're working on:
- Which operations are taking the most time?
- Are there any duplicate database calls?
- Is there unnecessary serialization happening on every request?
Using the SigNoz MCP, the AI assistant’s answer comes back as a structured breakdown of your trace data, providing a clear picture of where the time is going and why. A common finding: an N+1 query adding 3ms per database call is invisible in unit tests but generates 150+ round-trips under realistic load, pushing p99 latency from 80ms to well over a second. The patterns are immediately visible in a span tree in a way they simply aren’t in code review or unit tests.
This turns performance monitoring from a dedicated action that happens after the fact into something that fits naturally into the development workflow. You can catch the problem at the moment it's introduced during development, fix it before it ships, and move on.
Monitoring and Validating After a Deploy
Deploying to production is one of the highest risk moments in the software lifecycle. Even with deep testing and validation, production traffic exposes behavior that controlled environments simply can’t. A deploy that looks clean can introduce subtle issues. For example, a specific endpoint can slow down, or a new error type can affect a subset of users.
The standard practice of watching dashboards after a deploy is a starting point, but it relies on someone knowing which panels to look at and what “normal” really looks like. It's a manual process that scales poorly as the number of services and endpoints grows.
The SigNoz MCP enables post-deployment validation. Instead of eyeballing graphs, you ask:
We deployed at 10:00 AM PST. Compare p99 latency, error rate, and request throughput
for all endpoints in the payments service in the 30 minute window before and after the deploy.
Flag anything that degraded and list any error types that didn't exist before the deploy.
The MCP compares key signals before and after the deploy timestamp across every endpoint:
- p99 latency
- Error rate
- Request throughput
The MCP flags anything that degraded, giving you a structured before-and-after comparison across your entire service in one response.
The MCP also goes even further. You can ask it to compare error types before and after the deploy to surface any new errors that didn't exist before. This is where hidden errors get caught. Rather than just looking at an overall error rate, this will quickly be able to let you know as soon as new errors are introduced to your system.
The result is a repeatable, consistent post-deploy validation process that doesn't depend on someone knowing what to look for or remembering to check the right dashboard. You run the same prompts after every deploy and get a clear signal of whether the deploy is clean or not, and where exactly to inspect.
Putting It Together — Observability Across the Full Lifecycle
The two use cases in this post solve different problems at different stages, but they share the same idea: observability is most valuable when it's part of how you build and ship software, not just how you respond when something goes wrong.
- When you monitor performance during development, you’re using the same traces and span data you’d use to debug a production incident, except you’re doing it earlier in a controlled environment. You’re able to fix the problem while coding rather than during an incident response.
- When you validate a deploy, you’re using the same metrics and error data you’d use during an active investigation, just proactively, before user complaints or alert firings let you know.
The SigNoz MCP makes both of these workflows practical because it removes the manual friction of getting to the data. You don't need to:
- Open a dashboard
- Write a query
- Know which data point to look for
The MCP removes the need to hunt for data by correlating together traces, logs, and metrics in real-time. You describe what you want to know and get a straightforward answer, and that low friction is what makes it realistic to implement these into your normal development and release process rather than treating them as dedicated reactions that only happen after something feels wrong.
In order to catch the fewest production incidents, you don’t have to have the best incident response. You just need to be able to find the problems effectively before they reach production in the first place.
Getting Started
To try these workflows yourself, connect your AI assistant to SigNoz using the MCP server. Setup takes a few minutes and works with any compatible AI assistant.
