Overview
This guide walks you through setting up monitoring and observability for Claude Agent SDK using OpenTelemetry and exporting logs, traces, and metrics to SigNoz. With this integration, you can observe the performance of various models, capture request/response details, and track system-level metrics in SigNoz, giving you real-time visibility into latency, error rates, and usage trends for your Claude Code SDK applications.
Instrumenting Claude Agent SDK in your AI applications with telemetry ensures full observability across your agent workflows, making it easier to debug issues, optimize performance, and understand user interactions. By leveraging SigNoz, you can analyze correlated traces, logs, and metrics in unified dashboards, configure alerts, and gain actionable insights to continuously improve reliability, responsiveness, and user experience.
Prerequisites
- A SigNoz Cloud account with an active ingestion key or Self Hosted SigNoz instance
- Python 3.10+ with
claude-agent-sdkinstalled - For Python:
pipinstalled for managing Python packages - An Anthropic API account with a working API Key
Monitoring Claude Agent SDK
No code auto-instrumentation is recommended for quick setup with minimal code changes. It's ideal when you want to get observability up and running without modifying your application code and are leveraging standard instrumentor libraries.
Step 1: Install the necessary packages in your Python environment.
pip install \
  opentelemetry-distro \
  opentelemetry-exporter-otlp \
  httpx \
  opentelemetry-instrumentation-httpx \
  opentelemetry-instrumentation-system-metrics \
  claude-agent-sdk \
  "langsmith[claude-agent-sdk]"
Step 2: Add Automatic Instrumentation
opentelemetry-bootstrap --action=install
Step 3: Configure logging level
To ensure logs are properly captured and exported, configure the root logger to emit logs at the DEBUG level or higher:
import logging

logging.getLogger().setLevel(logging.DEBUG)
logging.getLogger("httpx").setLevel(logging.DEBUG)
Step 4: Configure Langsmith OTel environment variables
import os

os.environ["LANGSMITH_OTEL_ENABLED"] = "true"
os.environ["LANGSMITH_OTEL_ONLY"] = "true"
os.environ["LANGSMITH_TRACING"] = "true"
Step 5: Enable OTel instrumentation
from langsmith.integrations.claude_agent_sdk import configure_claude_agent_sdk

configure_claude_agent_sdk()
Step 6: Enable token and cost attributes in traces (Optional)
In order to send token usage and cost related attributes in your OTel traces, add the following:
# ===== MONKEY PATCH: Fix token counting and cost tracking for OTEL export =====
# The LangSmith integration stores token counts and cost in metadata, but the OTEL exporter
# expects them as top-level fields (prompt_tokens, completion_tokens, total_tokens, total_cost)
from langsmith.integrations.claude_agent_sdk import _client

# Patch add_usage to set token and cost fields
def fixed_add_usage(self, metrics):
    """Attach token usage and cost details to the current run (with fix for OTEL export)."""
    if not (self.current_run and metrics):
        return

    # Set top-level token fields as object attributes
    if "input_tokens" in metrics:
        object.__setattr__(self.current_run, "prompt_tokens", int(metrics["input_tokens"]))
        self.current_run.extra["prompt_tokens"] = int(metrics["input_tokens"])
    if "output_tokens" in metrics:
        object.__setattr__(self.current_run, "completion_tokens", int(metrics["output_tokens"]))
        self.current_run.extra["completion_tokens"] = int(metrics["output_tokens"])
    if "total_tokens" in metrics:
        object.__setattr__(self.current_run, "total_tokens", int(metrics["total_tokens"]))
        self.current_run.extra["total_tokens"] = int(metrics["total_tokens"])

    # Set total_cost field if available
    if "total_cost" in metrics:
        object.__setattr__(self.current_run, "total_cost", float(metrics["total_cost"]))
        self.current_run.extra["total_cost"] = float(metrics["total_cost"])

    # Also store in metadata for backwards compatibility
    meta = self.current_run.extra.setdefault("metadata", {}).setdefault(
        "usage_metadata", {}
    )
    meta.update(metrics)

_client.TurnLifecycle.add_usage = fixed_add_usage

# Patch SerializedRunOperation.deserialize_run_info to move tokens and cost from extra to top level
from langsmith._internal._operations import SerializedRunOperation
original_deserialize = SerializedRunOperation.deserialize_run_info

def patched_deserialize_run_info(self):
    """Deserialize run info and move token and cost fields from extra to top level for OTEL."""
    run_info = original_deserialize(self)

    # If tokens and cost are in extra, move them to top level for OTEL exporter
    if "extra" in run_info:
        for field in ['prompt_tokens', 'completion_tokens', 'total_tokens', 'total_cost']:
            if field in run_info["extra"]:
                run_info[field] = run_info["extra"][field]

    return run_info

SerializedRunOperation.deserialize_run_info = patched_deserialize_run_info

# Patch OTEL exporter to also export total_cost
from langsmith._internal.otel import _otel_exporter

original_set_span_attributes = _otel_exporter.OTELExporter._set_span_attributes

def patched_set_span_attributes(self, span, run_info, op):
    """Set span attributes including total_cost."""
    # Call original method to set all standard attributes
    original_set_span_attributes(self, span, run_info, op)

    # Add total_cost as a custom attribute if available
    if run_info.get("total_cost") is not None:
        total_cost = run_info["total_cost"]
        span.set_attribute("gen_ai.usage.cost", float(total_cost))

_otel_exporter.OTELExporter._set_span_attributes = patched_set_span_attributes
# ===== END MONKEY PATCH =====
Step 7: Create an example Claude Agent SDK workflow
import asyncio
from claude_agent_sdk import query, ClaudeAgentOptions, ClaudeSDKClient


async def main():
    options = ClaudeAgentOptions(
        model="claude-sonnet-4-6",
        system_prompt="You are a friendly assistant who helps with answering questions by searching the web for up-to-date information.",
        allowed_tools=["WebSearch"],
    )

    async with ClaudeSDKClient(options=options) as client:
        await client.query("What is SigNoz and how does it compare to other observability tools?")

        async for message in client.receive_response():
            print(message)

asyncio.run(main())
📌 Note: Before running this code, ensure that you have set the environment variable
ANTHROPIC_API_KEYwith your generated API key.
Step 8: Run your application with auto-instrumentation
Run your application with the following environment variables set. This configures OpenTelemetry to export traces, logs, and metrics to SigNoz Cloud and enables automatic log correlation:
OTEL_RESOURCE_ATTRIBUTES="service.name=<service_name>" \
OTEL_EXPORTER_OTLP_ENDPOINT="https://ingest.<region>.signoz.cloud:443" \
OTEL_EXPORTER_OTLP_HEADERS="signoz-ingestion-key=<your-ingestion-key>" \
OTEL_EXPORTER_OTLP_PROTOCOL=grpc \
OTEL_TRACES_EXPORTER=otlp \
OTEL_METRICS_EXPORTER=otlp \
OTEL_LOGS_EXPORTER=otlp \
OTEL_PYTHON_LOG_CORRELATION=true \
OTEL_PYTHON_LOGGING_AUTO_INSTRUMENTATION_ENABLED=true \
opentelemetry-instrument <your_run_command>
<service_name>is the name of your service<region>: Your SigNoz Cloud region<your-ingestion-key>: Your SigNoz ingestion key- Replace
<your_run_command>with the actual command you would use to run your application. In this case we would use:python main.py
Using self-hosted SigNoz? Most steps are identical. To adapt this guide, update the endpoint and remove the ingestion key header as shown in Cloud → Self-Hosted.
Code-based manual instrumentation gives you fine-grained control over your telemetry configuration. Use this approach when you need to customize resource attributes, sampling strategies, or integrate with existing observability infrastructure.
Step 1: Install additional OpenTelemetry dependencies
pip install \
  opentelemetry-api \
  opentelemetry-sdk \
  opentelemetry-exporter-otlp \
  httpx \
  opentelemetry-instrumentation-httpx \
  opentelemetry-instrumentation-system-metrics \
  claude-agent-sdk \
  "langsmith[claude-agent-sdk]"
Step 2: Set up Traces
from opentelemetry.sdk.resources import Resource
from opentelemetry.sdk.trace import TracerProvider
from opentelemetry.sdk.trace.export import BatchSpanProcessor
from opentelemetry.exporter.otlp.proto.http.trace_exporter import OTLPSpanExporter
from opentelemetry import trace
from langsmith.integrations.claude_agent_sdk import configure_claude_agent_sdk
import os


resource = Resource.create({"service.name": "<service_name>"})
provider = TracerProvider(resource=resource)
span_exporter = OTLPSpanExporter(
    endpoint= os.getenv("OTEL_EXPORTER_TRACES_ENDPOINT"),
    headers={"signoz-ingestion-key": os.getenv("SIGNOZ_INGESTION_KEY")},
)
processor = BatchSpanProcessor(span_exporter)
provider.add_span_processor(processor)
trace.set_tracer_provider(provider)

# Start instrumenting Claude Agent SDK
configure_claude_agent_sdk()
<service_name>is the name of your serviceOTEL_EXPORTER_TRACES_ENDPOINT→ SigNoz Cloud trace endpoint with appropriate region:https://ingest.<region>.signoz.cloud:443/v1/tracesSIGNOZ_INGESTION_KEY→ Your SigNoz ingestion key
Using self-hosted SigNoz? Most steps are identical. To adapt this guide, update the endpoint and remove the ingestion key header as shown in Cloud → Self-Hosted.
Step 3: Setup Logs
from opentelemetry.sdk.resources import Resource
from opentelemetry._logs import set_logger_provider
from opentelemetry.sdk._logs import LoggerProvider, LoggingHandler
from opentelemetry.sdk._logs.export import BatchLogRecordProcessor
from opentelemetry.exporter.otlp.proto.http._log_exporter import OTLPLogExporter
import os
import logging

resource = Resource.create({"service.name": "<service_name>"})
logger_provider = LoggerProvider(resource=resource)
set_logger_provider(logger_provider)

otlp_log_exporter = OTLPLogExporter(
    endpoint= os.getenv("OTEL_EXPORTER_LOGS_ENDPOINT"),
    headers={"signoz-ingestion-key": os.getenv("SIGNOZ_INGESTION_KEY")},
)
logger_provider.add_log_record_processor(
    BatchLogRecordProcessor(otlp_log_exporter)
)

# Set logging levels
logging.getLogger().setLevel(logging.DEBUG)
logging.getLogger('httpx').setLevel(logging.DEBUG)

# Attach OTel logging handler to root logger
handler = LoggingHandler(level=logging.DEBUG, logger_provider=logger_provider)
logging.basicConfig(level=logging.DEBUG, handlers=[handler])

logger = logging.getLogger(__name__)
<service_name>is the name of your serviceOTEL_EXPORTER_LOGS_ENDPOINT→ SigNoz Cloud endpoint with appropriate region:https://ingest.<region>.signoz.cloud:443/v1/logsSIGNOZ_INGESTION_KEY→ Your SigNoz ingestion key
Using self-hosted SigNoz? Most steps are identical. To adapt this guide, update the endpoint and remove the ingestion key header as shown in Cloud → Self-Hosted.
Step 4: Setup Metrics
from opentelemetry.sdk.resources import Resource
from opentelemetry.sdk.metrics import MeterProvider
from opentelemetry.exporter.otlp.proto.http.metric_exporter import OTLPMetricExporter
from opentelemetry.sdk.metrics.export import PeriodicExportingMetricReader
from opentelemetry import metrics
from opentelemetry.instrumentation.system_metrics import SystemMetricsInstrumentor
from opentelemetry.instrumentation.httpx import HTTPXClientInstrumentor
import os

resource = Resource.create({"service.name": "<service_name>"})
metric_exporter = OTLPMetricExporter(
    endpoint= os.getenv("OTEL_EXPORTER_METRICS_ENDPOINT"),
    headers={"signoz-ingestion-key": os.getenv("SIGNOZ_INGESTION_KEY")},
)
reader = PeriodicExportingMetricReader(metric_exporter)
metric_provider = MeterProvider(metric_readers=[reader], resource=resource)
metrics.set_meter_provider(metric_provider)

meter = metrics.get_meter(__name__)

# turn on out-of-the-box metrics
SystemMetricsInstrumentor().instrument()
HTTPXClientInstrumentor().instrument()
<service_name>is the name of your serviceOTEL_EXPORTER_METRICS_ENDPOINT→ SigNoz Cloud endpoint with appropriate region:https://ingest.<region>.signoz.cloud:443/v1/metricsSIGNOZ_INGESTION_KEY→ Your SigNoz ingestion key
Using self-hosted SigNoz? Most steps are identical. To adapt this guide, update the endpoint and remove the ingestion key header as shown in Cloud → Self-Hosted.
📌 Note: SystemMetricsInstrumentor provides system metrics (CPU, memory, etc.), and HTTPXClientInstrumentor provides outbound HTTP request metrics such as request duration. If you want to add custom metrics to your Claude Agent SDK application, see Python Custom Metrics.
Step 5: Enable token and cost attributes in traces (Optional)
In order to send token usage and cost related attributes in your OTel traces, add the following:
# ===== MONKEY PATCH: Fix token counting and cost tracking for OTEL export =====
# The LangSmith integration stores token counts and cost in metadata, but the OTEL exporter
# expects them as top-level fields (prompt_tokens, completion_tokens, total_tokens, total_cost)
from langsmith.integrations.claude_agent_sdk import _client

# Patch add_usage to set token and cost fields
def fixed_add_usage(self, metrics):
    """Attach token usage and cost details to the current run (with fix for OTEL export)."""
    if not (self.current_run and metrics):
        return

    # Set top-level token fields as object attributes
    if "input_tokens" in metrics:
        object.__setattr__(self.current_run, "prompt_tokens", int(metrics["input_tokens"]))
        self.current_run.extra["prompt_tokens"] = int(metrics["input_tokens"])
    if "output_tokens" in metrics:
        object.__setattr__(self.current_run, "completion_tokens", int(metrics["output_tokens"]))
        self.current_run.extra["completion_tokens"] = int(metrics["output_tokens"])
    if "total_tokens" in metrics:
        object.__setattr__(self.current_run, "total_tokens", int(metrics["total_tokens"]))
        self.current_run.extra["total_tokens"] = int(metrics["total_tokens"])

    # Set total_cost field if available
    if "total_cost" in metrics:
        object.__setattr__(self.current_run, "total_cost", float(metrics["total_cost"]))
        self.current_run.extra["total_cost"] = float(metrics["total_cost"])

    # Also store in metadata for backwards compatibility
    meta = self.current_run.extra.setdefault("metadata", {}).setdefault(
        "usage_metadata", {}
    )
    meta.update(metrics)

_client.TurnLifecycle.add_usage = fixed_add_usage

# Patch SerializedRunOperation.deserialize_run_info to move tokens and cost from extra to top level
from langsmith._internal._operations import SerializedRunOperation
original_deserialize = SerializedRunOperation.deserialize_run_info

def patched_deserialize_run_info(self):
    """Deserialize run info and move token and cost fields from extra to top level for OTEL."""
    run_info = original_deserialize(self)

    # If tokens and cost are in extra, move them to top level for OTEL exporter
    if "extra" in run_info:
        for field in ['prompt_tokens', 'completion_tokens', 'total_tokens', 'total_cost']:
            if field in run_info["extra"]:
                run_info[field] = run_info["extra"][field]

    return run_info

SerializedRunOperation.deserialize_run_info = patched_deserialize_run_info

# Patch OTEL exporter to also export total_cost
from langsmith._internal.otel import _otel_exporter

original_set_span_attributes = _otel_exporter.OTELExporter._set_span_attributes

def patched_set_span_attributes(self, span, run_info, op):
    """Set span attributes including total_cost."""
    # Call original method to set all standard attributes
    original_set_span_attributes(self, span, run_info, op)

    # Add total_cost as a custom attribute if available
    if run_info.get("total_cost") is not None:
        total_cost = run_info["total_cost"]
        span.set_attribute("gen_ai.usage.cost", float(total_cost))

_otel_exporter.OTELExporter._set_span_attributes = patched_set_span_attributes
# ===== END MONKEY PATCH =====
Step 6: Run an example Claude Agent SDK workflow
📌 Note: Ensure you have completed the steps above (traces, logs, and metrics configuration) before running this code. All OpenTelemetry instrumentation must be initialized first.
import asyncio
from claude_agent_sdk import query, ClaudeAgentOptions, ClaudeSDKClient


async def main():
    options = ClaudeAgentOptions(
        model="claude-sonnet-4-6",
        system_prompt="You are a friendly assistant who helps with answering questions by searching the web for up-to-date information.",
        allowed_tools=["WebSearch"],
    )

    async with ClaudeSDKClient(options=options) as client:
        await client.query("What is SigNoz and how does it compare to other observability tools?")

        async for message in client.receive_response():
            print(message)

asyncio.run(main())
📌 Note: Before running this code, ensure that you have set the environment variable
ANTHROPIC_API_KEYwith your generated API key.
View Traces, Logs, and Metrics in SigNoz
Your Claude Agent SDK usage should now automatically emit traces, logs, and metrics.
You should be able to view traces in Signoz Cloud under the traces tab:

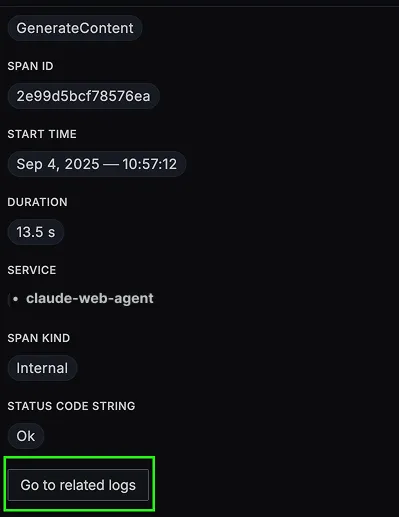
When you click on a trace in SigNoz, you'll see a detailed view of the trace, including all associated spans, along with their events and attributes.

You should be able to view logs in Signoz Cloud under the logs tab. You can also view logs by clicking on the “Related Logs” button in the trace view to see correlated logs:

When you click on any of these logs in SigNoz, you'll see a detailed view of the log, including attributes:

You should be able to see Claude Agent SDK related metrics in Signoz Cloud under the metrics tab:

When you click on any of these metrics in SigNoz, you'll see a detailed view of the metric, including attributes:

Troubleshooting
If you don't see your telemetry data:
- Verify network connectivity - Ensure your application can reach SigNoz Cloud endpoints
- Check ingestion key - Verify your SigNoz ingestion key is correct
- Wait for data - OpenTelemetry batches data before sending, so wait 10-30 seconds after making API calls
- Try a console exporter — Enable a console exporter locally to confirm that your application is generating telemetry data before it’s sent to SigNoz
Next Steps
You can also check out our custom Claude Agent SDK dashboard here which provides specialized visualizations for monitoring your Claude Agent SDK usage in applications. The dashboard includes pre-built charts specifically tailored for LLM usage, along with import instructions to get started quickly.

Additional resources:
- Set up alerts for high latency or error rates
- Learn more about querying traces
- Explore log correlation
