Overview
This integration helps you monitor key AWS RDS PostgreSQL metrics and logs, view them with an out-of-the-box dashboards, and parse PostgreSQL logs for better querying and aggregation.
SigNoz Cloud users: You can also use the One-Click AWS Integration for automated setup with pre-built dashboards.
Prerequisites
Before you begin, ensure you have the following:
- AWS Credentials and Permissions:
- Set up proper AWS credentials (e.g.,
AWS_ACCESS_KEY_IDandAWS_SECRET_ACCESS_KEYenvironment variables). - Required IAM permissions:
cloudwatch:ListMetricscloudwatch:GetMetricStatisticscloudwatch:GetMetricDatalogs:DescribeLogGroupslogs:FilterLogEvents
- Java Runtime Environment (JRE) 11+:
- Required for the CloudWatch Exporter.
- Alternative: Use the Docker image.
- OpenTelemetry Collector:
- Install an OTEL Collector (v0.88.0+) if not already done.
- Ensure you can provide config files to the collector and set environment variables and command line flags used for running it.
- PostgreSQL Server Access:
- The OTEL collector must have client access to the Postgres server (optional if only collecting CloudWatch metrics).
Collecting RDS PostgreSQL Metrics
Step 1: Set up the Prometheus CloudWatch Exporter
Download the exporter:
curl -sLSO https://github.com/prometheus/cloudwatch_exporter/releases/download/v0.15.5/cloudwatch_exporter-0.15.5-jar-with-dependencies.jarConfigure the Prometheus exporter Save the following config for collecting AWS RDS metrics in a file named
aws-rds-postgres-metrics.yamland update the region key with relevant value.
---
region: us-east-1
metrics:
 - aws_namespace: AWS/RDS
   aws_metric_name: BinLogDiskUsage
   aws_dimensions: [DBInstanceIdentifier]
   aws_statistics: [Average]

 - aws_namespace: AWS/RDS
   aws_metric_name: BurstBalance
   aws_dimensions: [DBInstanceIdentifier]
   aws_statistics: [Average]

 - aws_namespace: AWS/RDS
   aws_metric_name: CheckpointLag
   aws_dimensions: [DBInstanceIdentifier]
   aws_statistics: [Average, Maximum]

 - aws_namespace: AWS/RDS
   aws_metric_name: ConnectionAttempts
   aws_dimensions: [DBInstanceIdentifier]
   aws_statistics: [Average, Maximum]

 - aws_namespace: AWS/RDS
   aws_metric_name: CPUUtilization
   aws_dimensions: [DBInstanceIdentifier]
   aws_statistics: [Average, Maximum]

 - aws_namespace: AWS/RDS
   aws_metric_name: DatabaseConnections
   aws_dimensions: [DBInstanceIdentifier]
   aws_statistics: [Average, Maximum]

 - aws_namespace: AWS/RDS
   aws_metric_name: DiskQueueDepth
   aws_dimensions: [DBInstanceIdentifier]
   aws_statistics: [Average]

 - aws_namespace: AWS/RDS
   aws_metric_name: DiskQueueDepthLogVolume
   aws_dimensions: [DBInstanceIdentifier]
   aws_statistics: [Average]

 - aws_namespace: AWS/RDS
   aws_metric_name: EBSByteBalance%
   aws_dimensions: [DBInstanceIdentifier]
   aws_statistics: [Average]

 - aws_namespace: AWS/RDS
   aws_metric_name: EBSIOBalance%
   aws_dimensions: [DBInstanceIdentifier]
   aws_statistics: [Average]

 - aws_namespace: AWS/RDS
   aws_metric_name: FreeableMemory
   aws_dimensions: [DBInstanceIdentifier]
   aws_statistics: [Average, Maximum]

 - aws_namespace: AWS/RDS
   aws_metric_name: FreeLocalStorage
   aws_dimensions: [DBInstanceIdentifier]
   aws_statistics: [Average]

 - aws_namespace: AWS/RDS
   aws_metric_name: FreeStorageSpace
   aws_dimensions: [DBInstanceIdentifier]
   aws_statistics: [Average]

 - aws_namespace: AWS/RDS
   aws_metric_name: FreeStorageSpaceLogVolume
   aws_dimensions: [DBInstanceIdentifier]
   aws_statistics: [Average]

 - aws_namespace: AWS/RDS
   aws_metric_name: MaximumUsedTransactionIDs
   aws_dimensions: [DBInstanceIdentifier]
   aws_statistics: [Average]

 - aws_namespace: AWS/RDS
   aws_metric_name: NetworkReceiveThroughput
   aws_dimensions: [DBInstanceIdentifier]
   aws_statistics: [Average, Maximum]

 - aws_namespace: AWS/RDS
   aws_metric_name: NetworkTransmitThroughput
   aws_dimensions: [DBInstanceIdentifier]
   aws_statistics: [Average, Maximum]

 - aws_namespace: AWS/RDS
   aws_metric_name: OldestReplicationSlotLag
   aws_dimensions: [DBInstanceIdentifier]
   aws_statistics: [Average, Maximum]

 - aws_namespace: AWS/RDS
   aws_metric_name: ReadIOPS
   aws_dimensions: [DBInstanceIdentifier]
   aws_statistics: [Average, Maximum]

 - aws_namespace: AWS/RDS
   aws_metric_name: ReadIOPSLocalStorage
   aws_dimensions: [DBInstanceIdentifier]
   aws_statistics: [Average, Maximum]

 - aws_namespace: AWS/RDS
   aws_metric_name: ReadIOPSLogVolume
   aws_dimensions: [DBInstanceIdentifier]
   aws_statistics: [Average, Maximum]

 - aws_namespace: AWS/RDS
   aws_metric_name: ReadLatency
   aws_dimensions: [DBInstanceIdentifier]
   aws_statistics: [Average, Maximum]

 - aws_namespace: AWS/RDS
   aws_metric_name: ReadLatencyLocalStorage
   aws_dimensions: [DBInstanceIdentifier]
   aws_statistics: [Average, Maximum]

 - aws_namespace: AWS/RDS
   aws_metric_name: ReadLatencyLogVolume
   aws_dimensions: [DBInstanceIdentifier]
   aws_statistics: [Average, Maximum]

 - aws_namespace: AWS/RDS
   aws_metric_name: ReadThroughput
   aws_dimensions: [DBInstanceIdentifier]
   aws_statistics: [Average, Maximum]

 - aws_namespace: AWS/RDS
   aws_metric_name: ReadThroughputLogVolume
   aws_dimensions: [DBInstanceIdentifier]
   aws_statistics: [Average, Maximum]

 - aws_namespace: AWS/RDS
   aws_metric_name: ReplicaLag
   aws_dimensions: [DBInstanceIdentifier]
   aws_statistics: [Average, Maximum]

 - aws_namespace: AWS/RDS
   aws_metric_name: ReplicationChannelLag
   aws_dimensions: [DBInstanceIdentifier]

 - aws_namespace: AWS/RDS
   aws_metric_name: ReplicationSlotDiskUsage
   aws_dimensions: [DBInstanceIdentifier]
   aws_statistics: [Average]

 - aws_namespace: AWS/RDS
   aws_metric_name: TransactionLogsDiskUsage
   aws_dimensions: [DBInstanceIdentifier]
   aws_statistics: [Average]

 - aws_namespace: AWS/RDS
   aws_metric_name: TransactionLogsGeneration
   aws_dimensions: [DBInstanceIdentifier]
   aws_statistics: [Average]

 - aws_namespace: AWS/RDS
   aws_metric_name: WriteIOPS
   aws_dimensions: [DBInstanceIdentifier]
   aws_statistics: [Average, Maximum]

 - aws_namespace: AWS/RDS
   aws_metric_name: WriteLatency
   aws_dimensions: [DBInstanceIdentifier]
   aws_statistics: [Average, Maximum]

 - aws_namespace: AWS/RDS
   aws_metric_name: WriteThroughput
   aws_dimensions: [DBInstanceIdentifier]
   aws_statistics: [Average, Maximum]

 - aws_namespace: AWS/RDS
   aws_metric_name: SwapUsage
   aws_dimensions: [DBInstanceIdentifier]
   aws_statistics: [Average, Maximum]

 - aws_namespace: AWS/RDS
   aws_metric_name: DBLoad
   aws_dimensions: [DBInstanceIdentifier]
   aws_statistics: [Average, Maximum]

 - aws_namespace: AWS/RDS
   aws_metric_name: DBLoadCPU
   aws_dimensions: [DBInstanceIdentifier]
   aws_statistics: [Average, Maximum]

 - aws_namespace: AWS/RDS
   aws_metric_name: DBLoadNonCPU
   aws_dimensions: [DBInstanceIdentifier]
   aws_statistics: [Average, Maximum]
- Run the following command:
java -jar cloudwatch_exporter-0.15.5-jar-with-dependencies.jar 9106 aws-rds-postgres-metrics.yaml
- Verify the CloudWatch metrics
Visit http://localhost:9106/metrics and confirm the aws_rds_* metrics are available.
Step 2: Create the OTEL Collector Config File
Create postgres-metrics-collection-config.yaml:
receivers:
  postgresql:
    # The endpoint of the postgresql server. Whether using TCP or Unix sockets, this value should be host:port. If transport is set to unix, the endpoint will internally be translated from host:port to /host.s.PGSQL.port
    endpoint: ${env:POSTGRESQL_ENDPOINT}
    # The frequency at which to collect metrics from the Postgres instance.
    collection_interval: 60s
    # The username used to access the postgres instance
    username: ${env:POSTGRESQL_USERNAME}
    # The password used to access the postgres instance
    password: ${env:POSTGRESQL_PASSWORD}
    # The list of databases for which the receiver will attempt to collect statistics. If an empty list is provided, the receiver will attempt to collect statistics for all non-template databases
    databases: ["pgtestdb"]
    # # Defines the network to use for connecting to the server. Valid Values are `tcp` or `unix`
    # transport: tcp
    tls:
      insecure_skip_verify: true
    #   ca_file: /etc/ssl/certs/ca-certificates.crt
    #   cert_file: /etc/ssl/certs/postgres.crt
    #   key_file: /etc/ssl/certs/postgres.key
    metrics:
      postgresql.database.locks:
        enabled: true
      postgresql.deadlocks:
        enabled: true
      postgresql.sequential_scans:
        enabled: true

  prometheus:
    config:
      scrape_configs:
        - job_name: 'aws-cloudwatch-metrics'
          scrape_timeout: 120s
          scrape_interval: 300s
          static_configs:
            - targets: ['0.0.0.0:9106']

exporters:
  # export to local collector
  otlp/local:
    endpoint: "localhost:4317"
    tls:
      insecure: true
  # export to SigNoz cloud
  otlp/signoz:
    endpoint: "${env:OTLP_DESTINATION_ENDPOINT}"
    tls:
      insecure: false
    headers:
      "signoz-ingestion-key": "${env:SIGNOZ_INGESTION_KEY}"

service:
  pipelines:
    metrics/postgresql:
      receivers: [postgresql, prometheus]
      processors: []
      exporters: [otlp/signoz]
Step 3: Set Environment Variables
# The accessible endpoint where PostgreSQL server is running
export POSTGRESQL_ENDPOINT="<postgres-server-endpoint>"

export POSTGRESQL_USERNAME="<username>"

# The password to use for accessing postgres instance
export POSTGRESQL_PASSWORD="<PASSWORD>"

# region specific SigNoz cloud ingestion endpoint
export OTLP_DESTINATION_ENDPOINT="ingest.<region>.signoz.cloud:443"

# your SigNoz ingestion key
export SIGNOZ_INGESTION_KEY="<your-ingestion-key>"
Verify these values:
<postgres-server-endpoint>: The hostname and port of your PostgreSQL RDS instance (e.g.,mydb.xxxx.us-east-1.rds.amazonaws.com:5432)<username>: Your PostgreSQL database username<PASSWORD>: Your PostgreSQL database password<region>: Your SigNoz Cloud region<your-ingestion-key>: Your SigNoz ingestion key
Step 4: Use the Collector Config File
Add the following flag to your collector run command:
--config postgres-metrics-collection-config.yaml
Note: The collector can use multiple config files by specifying multiple --config flags.
Collecting RDS Logs
The log collection of RDS instance requires specifying the list of log group names. From the AWS CloudWatch console, please find the log group(s) relevant to the integration.
Step 1: Create the Collector Config File
Create postgres-logs-collection-config.yaml:
receivers:
  awscloudwatch/rds_postgres_logs:
    region: us-east-1
    logs:
      poll_interval: 1m
      groups:
        named:
          # replace with your RDS log group name
          /aws/rds/:

processors:
  attributes/add_source_postgres:
    actions:
      - key: source
        value: "rds_postgres"
        action: insert
  batch:
    send_batch_size: 10000
    send_batch_max_size: 11000
    timeout: 10s

exporters:
  otlp/postgres_logs:
    endpoint: "${env:OTLP_DESTINATION_ENDPOINT}"
    tls:
      insecure: false
    headers:
      "signoz-ingestion-key": "${env:SIGNOZ_INGESTION_KEY}"

service:
  pipelines:
    logs/postgres:
      receivers: [awscloudwatch/rds_postgres_logs]
      processors: [attributes/add_source_postgres, batch]
      exporters: [otlp/postgres_logs]
Step 2: Set Environment Variables
# region specific SigNoz cloud ingestion endpoint
export OTLP_DESTINATION_ENDPOINT="ingest.<region>.signoz.cloud:443"

# your SigNoz ingestion key
export SIGNOZ_INGESTION_KEY="<your-ingestion-key>"
Verify these values:
<region>: Your SigNoz Cloud region<your-ingestion-key>: Your SigNoz ingestion key
Step 3: Run the Collector
Add to your collector run command:
--config postgres-logs-collection-config.yaml
Note: The collector can use multiple config files by specifying multiple --config flags.
Connect AWS RDS (PostgreSQL)
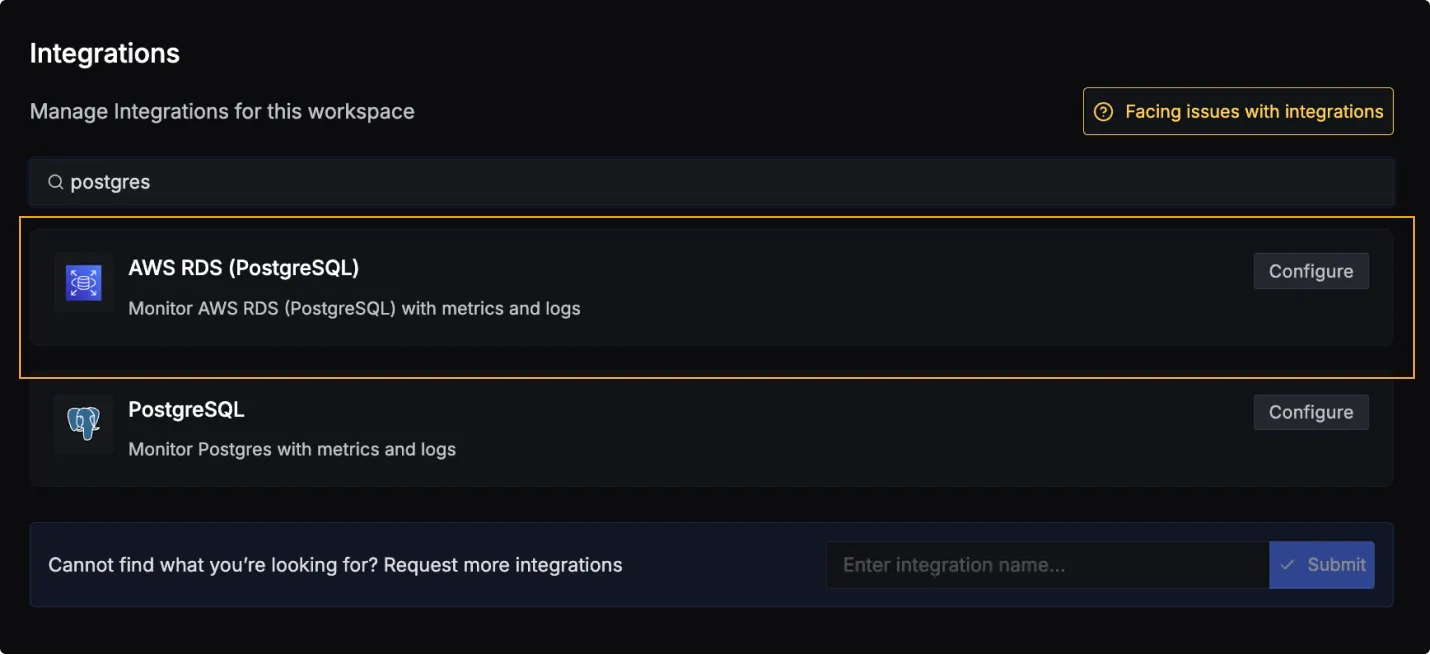
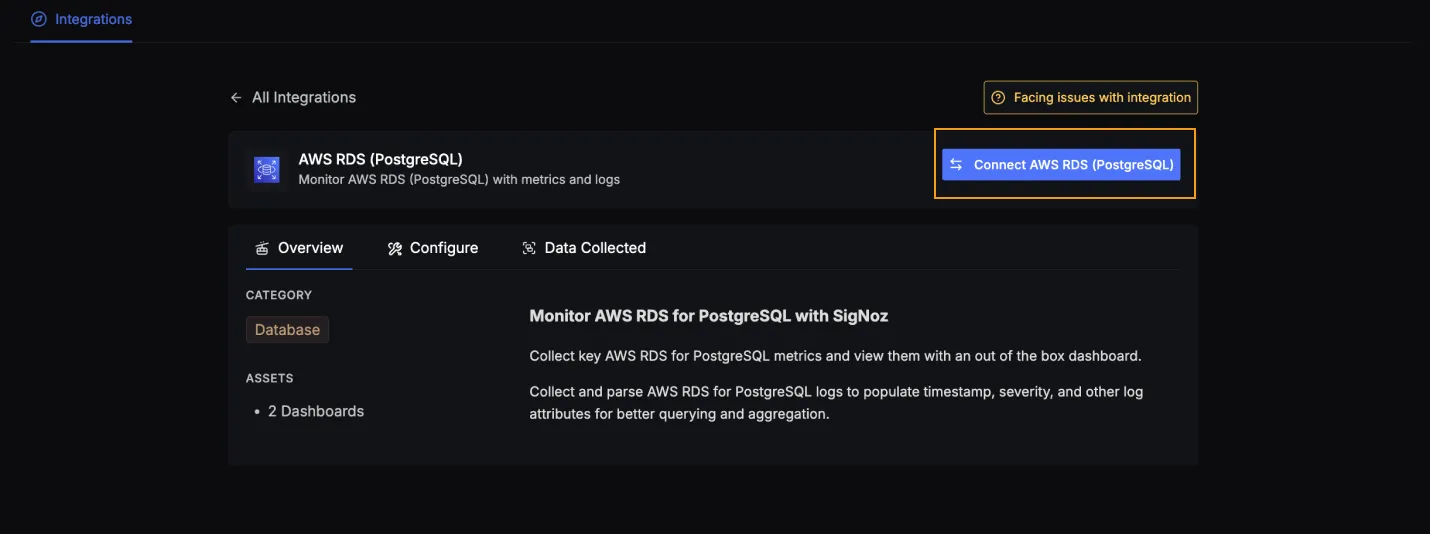
Once you're done with setting up AWS RDS (PostgreSQL) for collecting metrics and logs, head over to the intergrations tab in SigNoz and search for the AWS RDS (PostgreSQL) integration.
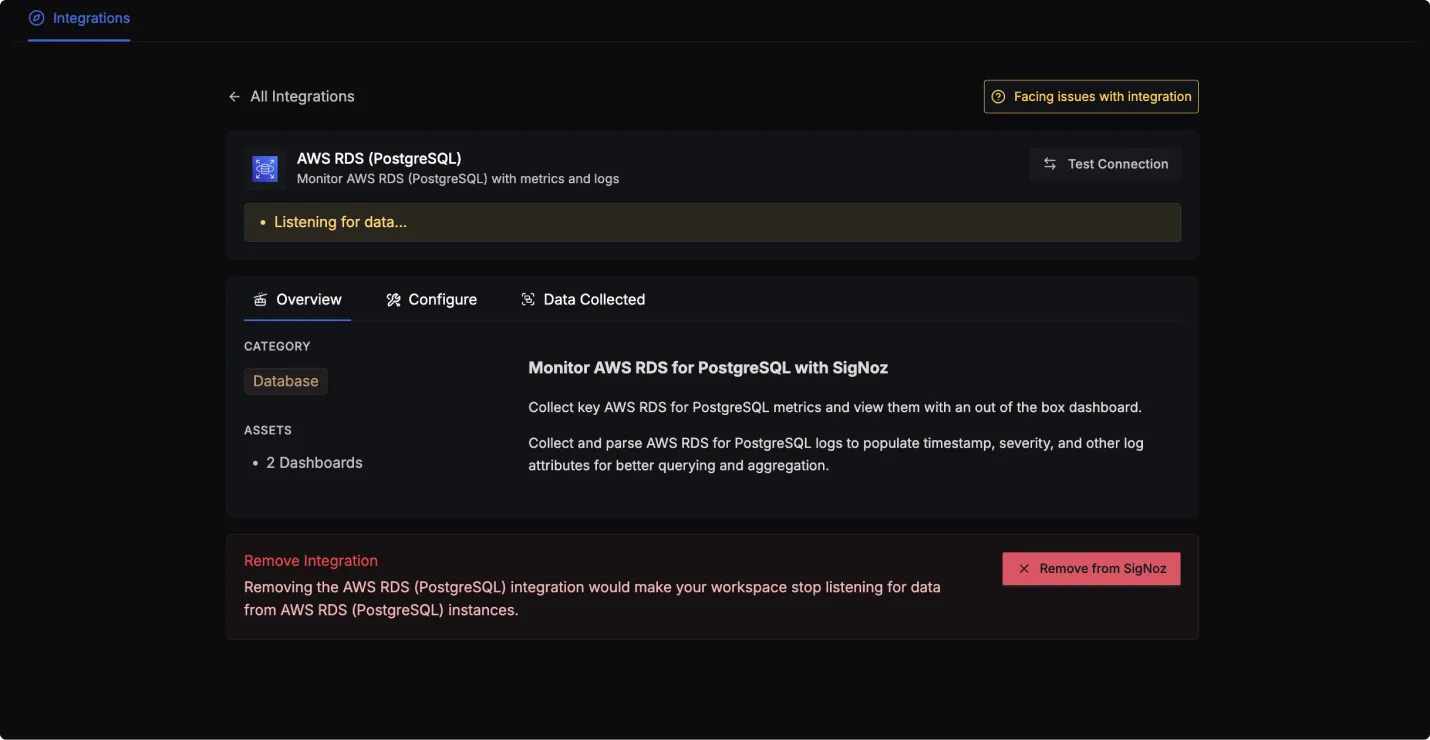
Click on the Connect AWS RDS (PostgreSQL) Button, and select I have already configured, this will start listening for data from your AWS RDS (PostgreSQL) instance. To stop this, you can select the Remove from SigNoz button.
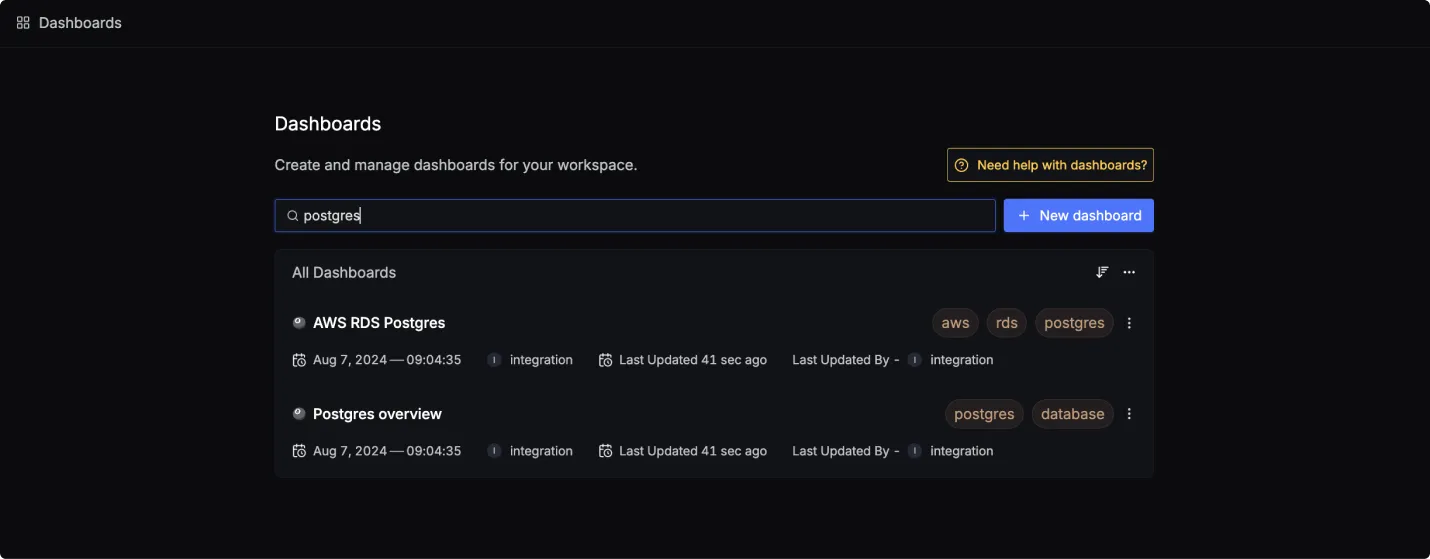
AWS RDS (PostgreSQL) dashboard
Once SigNoz has started listening to your AWS RDS (PostgreSQL) data, head over to the Dashboards tab and search for postgres, this will show you two newly created dashboard which shows different AWS RDS (PostgreSQL) metrics.
Dashboard asset
You can also manually create the above Dashboards by importing the JSON files available here. To learn how to create Dashboards, checkout this documentation.
Data Collected
When you switch to the Data Collected tab of your AWS RDS (PostgreSQL) Integrations, it shows you details about the different logs attributes and the metrics types that you can monitor for your AWS RDS (PostgreSQL) instance. The tables below gives you a list of the different logs attributes and metrics available.
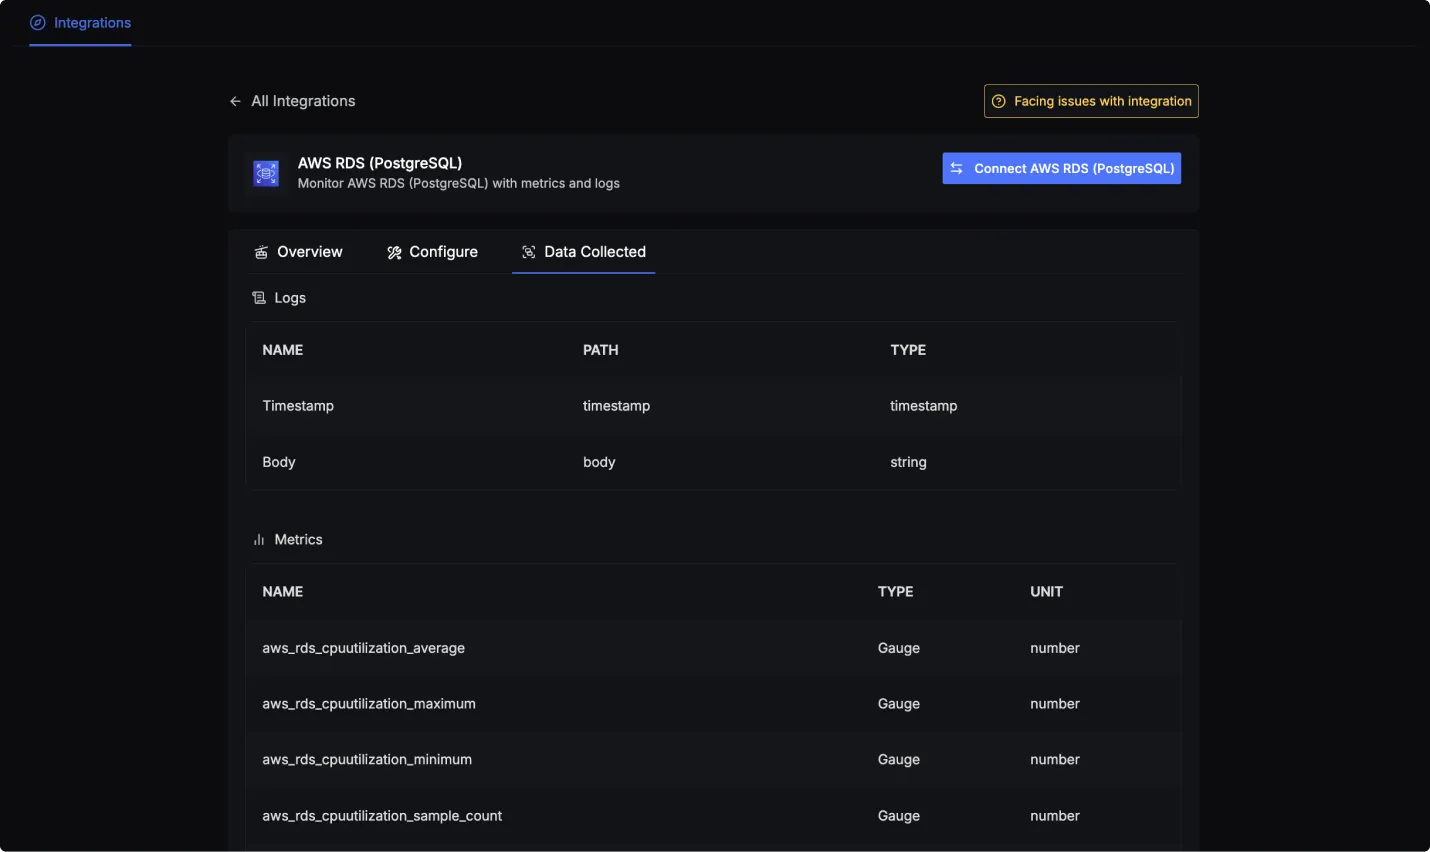
AWS RDS (PostgreSQL) log attributes
- Name: The name of the log attribute.
- Path: The specific location or attribute within a log entry where the corresponding data can be found.
- Type: The data type of the log attribute.
| Name | Path | Type |
|---|---|---|
| Timestamp | timestamp | timestamp |
| Body | body | string |
AWS RDS (PostgreSQL) metrics
- Name: The name of the metric.
- Type: The type of the metric (e.g., Sum, Gauge).
- Unit: The unit of measurement for the metric.
- Description: A brief description of what the metric represents.
To find a complete list of metrics you can checkout this link or the Data Collected tab.
