Zerolog is a high-performance, zero-allocation JSON logger for Go. This document explains how to collect log data from Zerolog and enable proper trace correlation and visualize it in SigNoz.
Prerequisites
- Application logs that are recorded to a log file
- A Golang application instrumented to send traces to SigNoz (if you want trace correlation)
Setup
Send logs to SigNoz
For application running in a VM, follow this document to get zerolog logs from your log file to SigNoz.
For application running in a Kubernetes, follow this document to get zerolog logs from your Kubernetes pods to SigNoz.
For application running in a Docker container, follow this document to get zerolog logs from your Docker containers to SigNoz.
Once you have done the setup, you should see your logs in Logs Explorer.
Correlate logs with traces
You can correlate your zerolog logs with your application traces to enable better observability and debugging.
We will be creating certain packages to correlate logs with traces by automatically injecting trace and span IDs into your log entries. Here's how the package structure will look:
└── pkg
    ├── context
    │   └── context.go
    ├── logger
    │   └── logger.go
    ├── middleware
    │   └── logging.go
    └── tracing
        └── tracing.go
Step 1: Create a trace-aware logger
This logger will automatically extract trace context from requests and add trace_id and span_id fields to your log entries. It provides both console and file logging capabilities with proper trace correlation.
pkg/logger/logger.go
package logger

import (
	"os"
	"time"

	"github.com/rs/zerolog"
	"go.opentelemetry.io/otel/trace"
)

var log zerolog.Logger

// Init initializes the logger to write to the console.
func Init() {
	zerolog.TimeFieldFormat = time.RFC3339
	zerolog.SetGlobalLevel(zerolog.InfoLevel)

	// Configure console writer with color
	consoleWriter := zerolog.ConsoleWriter{
		Out:        os.Stdout,
		TimeFormat: time.RFC3339,
	}

	log = zerolog.New(consoleWriter).With().Timestamp().Logger()
}

// InitWithWriter initializes the logger with a custom writer.
func InitWithWriter(writer zerolog.LevelWriter) {
	zerolog.TimeFieldFormat = time.RFC3339
	zerolog.SetGlobalLevel(zerolog.InfoLevel)

	log = zerolog.New(writer).With().Timestamp().Logger()
}

// GetLogger returns a logger instance with trace ID if available
func GetLogger(ctx trace.SpanContext) *zerolog.Logger {
	logger := log.With()

	// Add trace ID if available
	if ctx.HasTraceID() {
		logger = logger.Str("trace_id", ctx.TraceID().String())
	}

	// Add span ID if available
	if ctx.HasSpanID() {
		logger = logger.Str("span_id", ctx.SpanID().String())
	}

	l := logger.Logger()
	return &l
}

// GetGlobalLogger returns the global logger instance
func GetGlobalLogger() *zerolog.Logger {
	return &log
}
Step 2: Create middleware for web frameworks
This middleware intercepts HTTP requests to extract trace context and creates trace-aware loggers for each request. We're using Gin as the reference framework, if you're using a different framework, you can modify the code according to this document.
pkg/middleware/logging.go
package middleware

import (
	"time"

	"<module-name>/pkg/logger"

	"github.com/gin-gonic/gin"
	"go.opentelemetry.io/otel/trace"
)

// LoggerKey is the key used to store the logger in the Gin context
const LoggerKey = "trace_logger"

// LoggingMiddleware returns a gin middleware that logs requests with trace information
func LoggingMiddleware() gin.HandlerFunc {
	return func(c *gin.Context) {
		// Start timer
		start := time.Now()

		// Get trace context and create logger
		spanCtx := trace.SpanContextFromContext(c.Request.Context())
		traceLogger := logger.GetLogger(spanCtx)

		// Store logger in context
		c.Set(LoggerKey, traceLogger)

		// Process request
		c.Next()

		// Log request details
		traceLogger.Info().
			Str("method", c.Request.Method).
			Str("path", c.Request.URL.Path).
			Int("status", c.Writer.Status()).
			Dur("latency", time.Since(start)).
			Str("client_ip", c.ClientIP()).
			Msg("Request processed")
	}
}
- The
<module-name>is the name of the module that you have defined in yourgo.modfile.
Step 3: Initialize OpenTelemetry tracer
This sets up the OpenTelemetry infrastructure to export traces to SigNoz via OTLP. It configures the tracer provider with proper resource attributes and handles connection failures gracefully.
pkg/tracing/tracing.go
package tracing

import (
	"context"
	"log"
	"os"
	"strings"

	"go.opentelemetry.io/otel"
	"go.opentelemetry.io/otel/attribute"
	"go.opentelemetry.io/otel/exporters/otlp/otlptrace"
	"go.opentelemetry.io/otel/exporters/otlp/otlptrace/otlptracegrpc"
	"go.opentelemetry.io/otel/sdk/resource"
	sdktrace "go.opentelemetry.io/otel/sdk/trace"
	semconv "go.opentelemetry.io/otel/semconv/v1.4.0"
	"google.golang.org/grpc"
	"google.golang.org/grpc/credentials/insecure"
)

// InitTracer initializes the OpenTelemetry tracer
func InitTracer(serviceName string) func() {
	ctx := context.Background()

	// Get environment variables
	endpoint := os.Getenv("OTEL_EXPORTER_OTLP_ENDPOINT")
	if endpoint == "" {
		endpoint = "localhost:4317" // default endpoint
	}

	// Create OTLP exporter with non-blocking connection
	conn, err := grpc.Dial(endpoint,
		grpc.WithTransportCredentials(insecure.NewCredentials()),
		// Remove WithBlock to make it non-blocking
	)
	if err != nil {
		log.Printf("Warning: Failed to create gRPC connection to collector: %v", err)
		// Return a no-op cleanup function
		return func() {}
	}

	exporter, err := otlptrace.New(ctx, otlptracegrpc.NewClient(otlptracegrpc.WithGRPCConn(conn)))
	if err != nil {
		log.Printf("Warning: Failed to create trace exporter: %v", err)
		// Return a no-op cleanup function
		return func() {}
	}

	// Create resource with service information
	res, err := resource.New(ctx,
		resource.WithAttributes(
			semconv.ServiceNameKey.String(serviceName),
			attribute.String("environment", strings.ToLower(os.Getenv("ENV"))),
		),
	)
	if err != nil {
		log.Printf("Warning: Failed to create resource: %v", err)
		// Return a no-op cleanup function
		return func() {}
	}

	// Create trace provider
	tp := sdktrace.NewTracerProvider(
		sdktrace.WithSampler(sdktrace.AlwaysSample()),
		sdktrace.WithBatcher(exporter),
		sdktrace.WithResource(res),
	)

	// Set global trace provider
	otel.SetTracerProvider(tp)

	// Return cleanup function
	return func() {
		if err := tp.Shutdown(ctx); err != nil {
			log.Printf("Error shutting down tracer provider: %v", err)
		}
	}
}
OTEL_EXPORTER_OTLP_ENDPOINTis the endpoint where the collector is running, by default it's taken aslocalhost:4317in the above code.
Step 4: Create logger context helper
This utility function retrieves the trace-aware logger from the request context, making it easy to access correlated logging throughout your application. It falls back to the global logger if no trace context is available.
pkg/context/context.go
package context

import (
	"<module-name>/pkg/logger"

	"github.com/gin-gonic/gin"
	"github.com/rs/zerolog"
)

// LoggerKey is the key used to store the logger in the Gin context
const LoggerKey = "trace_logger"

// Logger returns the trace-aware logger from the Gin context
func Logger(c *gin.Context) *zerolog.Logger {
	if logger, exists := c.Get(LoggerKey); exists {
		return logger.(*zerolog.Logger)
	}
	return logger.GetGlobalLogger()
}
- The
<module-name>is the name of the module that you have defined in yourgo.modfile.
Step 5: Using the trace aware logger in your application
This code demonstrates how to wire everything together by initializing the logger with both console and file output (app.log), setting up OpenTelemetry tracing, and configuring Gin with the necessary middleware for trace correlation.
main.go
package main

import (
	"os"
	"time"

	"<module-name>/pkg/context"
	"<module-name>/pkg/logger"
	"<module-name>/pkg/middleware"
	"<module-name>/pkg/tracing"

	"github.com/gin-gonic/gin"
	"github.com/rs/zerolog"
	"go.opentelemetry.io/contrib/instrumentation/github.com/gin-gonic/gin/otelgin"
)

func main() {
	// Configure logger outputs
	consoleWriter := zerolog.ConsoleWriter{
		Out:        os.Stdout,
		TimeFormat: time.RFC3339,
	}

	// Create or open log file for persistent logging
	file, err := os.OpenFile("app.log", os.O_CREATE|os.O_WRONLY|os.O_APPEND, 0666)
	if err != nil {
		log := zerolog.New(consoleWriter).With().Timestamp().Logger()
		log.Fatal().Err(err).Msg("Failed to open log file")
	}

	// Setup multi-level writer for both console and file output
	multi := zerolog.MultiLevelWriter(consoleWriter, file)

	// Initialize logger with the multi-writer
	logger.InitWithWriter(multi)
	log := logger.GetGlobalLogger()

	// Initialize OpenTelemetry tracer for sending traces to SigNoz
	cleanup := tracing.InitTracer("<service-name>")
	defer cleanup()

	// Create Gin router
	r := gin.New()

	// Add middleware stack
	r.Use(gin.Recovery())                            // Panic recovery middleware
	r.Use(otelgin.Middleware("<service-name>"))      // OpenTelemetry tracing middleware
	r.Use(middleware.LoggingMiddleware())            // Custom trace-aware logging middleware

	// Example route using trace-aware logger
	//This is just for reference, modify it according to your application
	r.GET("/ping", func(c *gin.Context) {
		context.Logger(c).Info().Msg("hello")
		c.JSON(200, gin.H{
			"message": "pong",
		})
	})

	// Start the server
	log.Info().Msg("Starting server on :8080")
	if err := r.Run(":8080"); err != nil {
		log.Fatal().Err(err).Msg("Failed to start server")
	}
}
- The
<module-name>is the name of the module that you have defined in yourgo.modfile. - The
<service-name>should be replaced with your actual service name (e.g., "user-service", "payment-api", etc.).
Visualise correlated logs and traces
Once you have your logs and traces showing up in SigNoz, you can use logs pipeline to extract the span_id and trace_id from the log body to attributes using the trace parser.
Let's say, this is an example log from our setup that contains the trace_id and span_id in the body:
{
  "body": "{\"level\":\"info\",\"trace_id\":\"95db539ae3400511c3afe5fbfce7bb36\",\"span_id\":\"e8f3b29fca420c9e\",\"method\":\"GET\",\"path\":\"/users/45\",\"status\":404,\"latency\":0.009166,\"client_ip\":\"::1\",\"time\":\"2025-08-19T16:06:45+05:30\",\"message\":\"Request processed\"}",
  "date": "2025-08-19T10:36:45.504706Z",
  "id": "0hehZ2k1O2ebOEqzDXsWeZL01w4",
  "timestamp": "2025-08-19T10:36:45.504706Z",
  "attributes": {
    "log.file.name": "app.log"
  },
  "resources": {
    "signoz.workspace.key.id": "01982bf9-3376-79cb-a309-22404a54e644"
  },
  "scope": {},
  "severity_text": "",
  "severity_number": 0,
  "scope_name": "",
  "scope_version": "",
  "span_id": "",
  "trace_flags": 0,
  "trace_id": ""
}
To set up trace correlation, we can use logs pipelines:
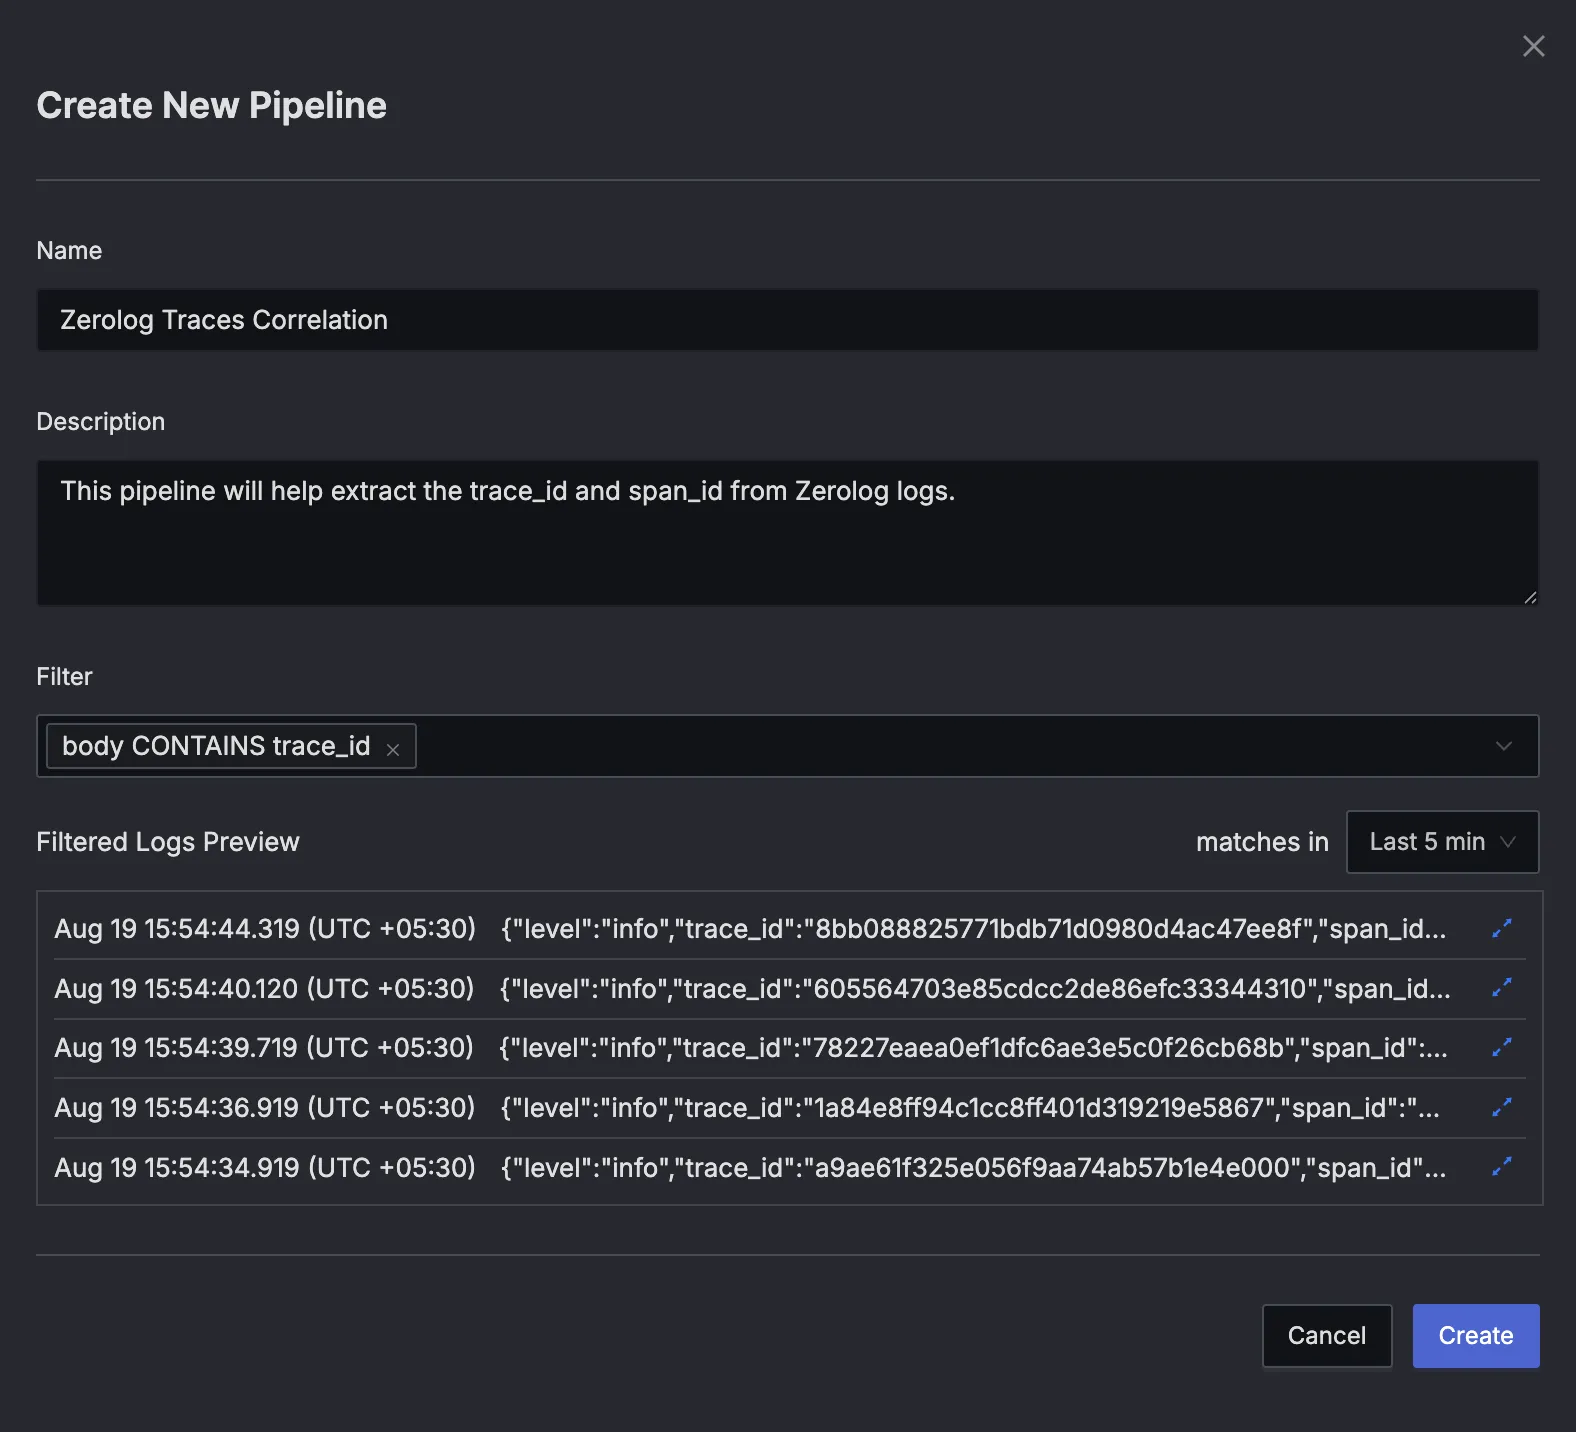
Step 1: Create a new pipeline:
Go to the Logs Pipeline section in SigNoz and create a new pipeline.
In the filter section, specify that the body contains trace_id to target relevant logs.
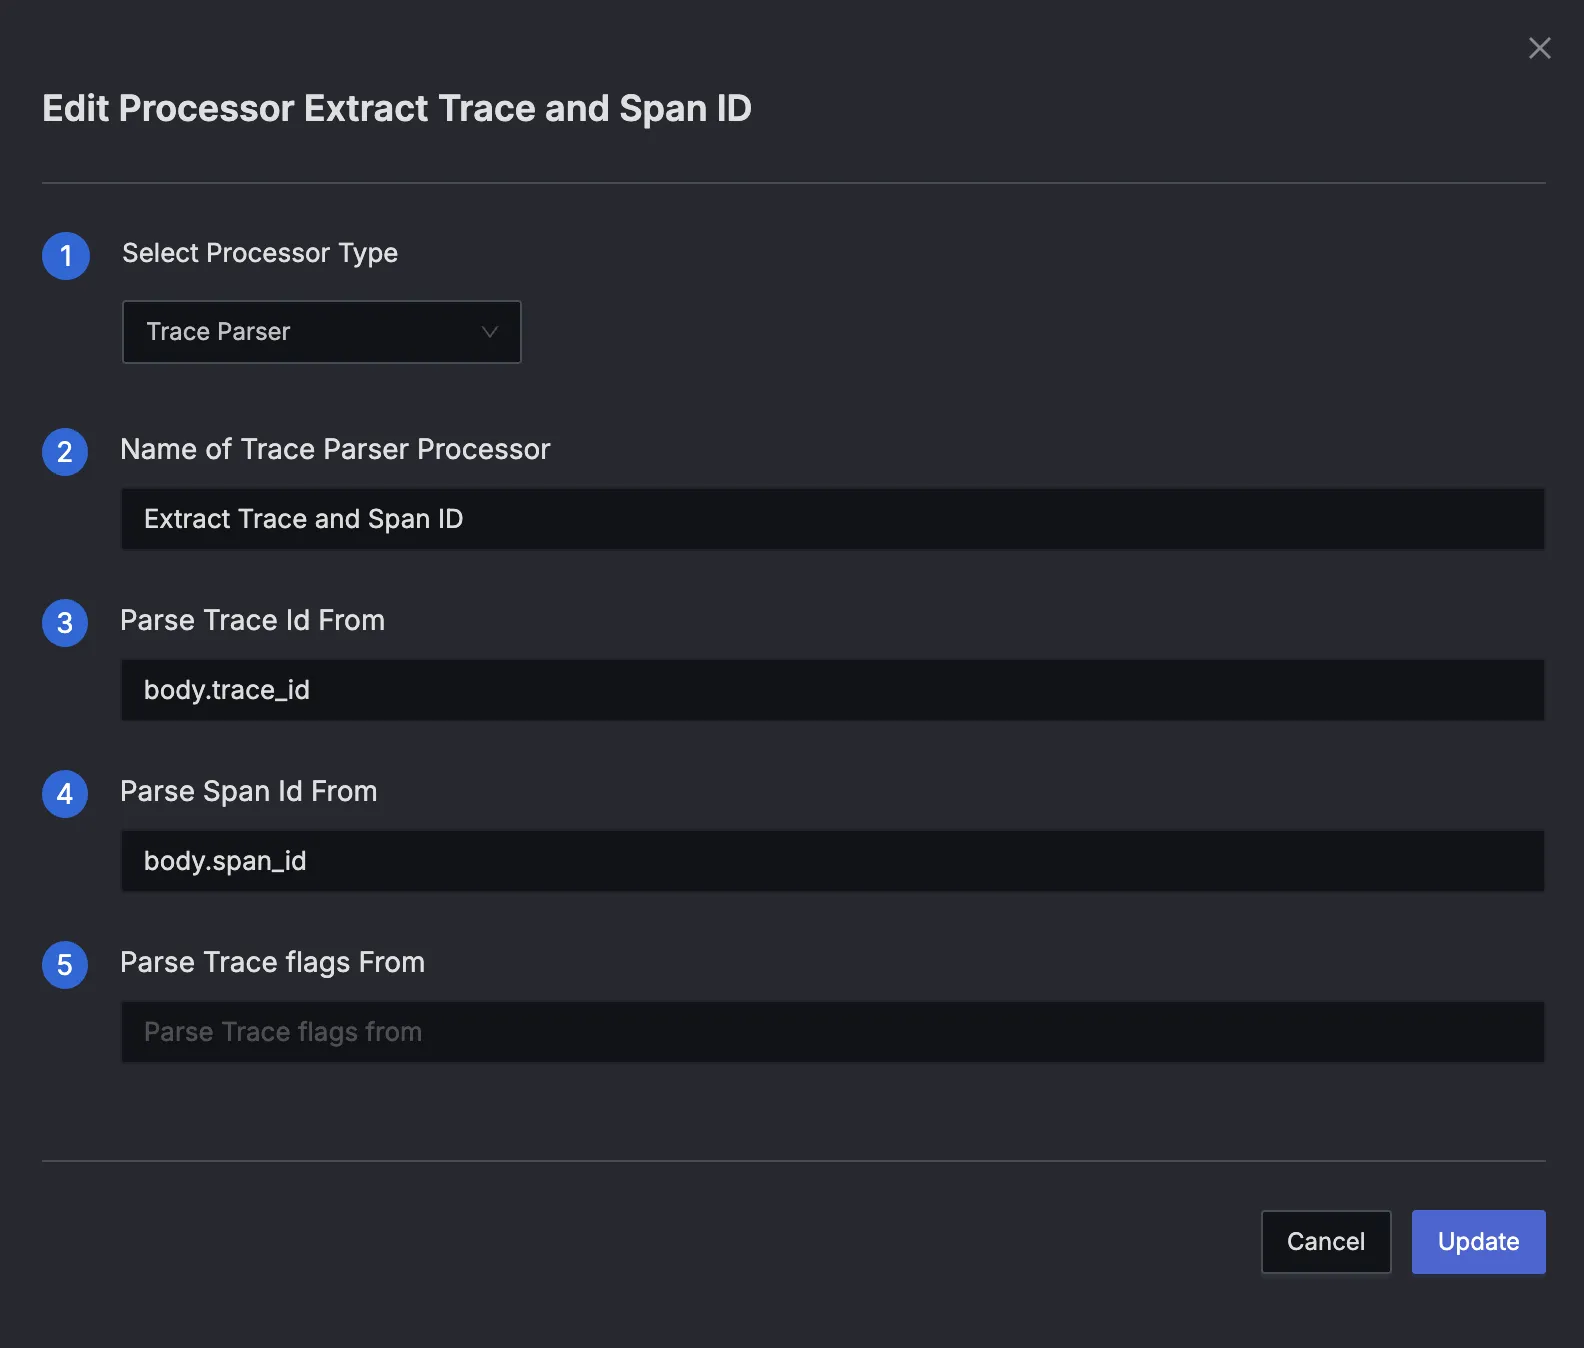
Step 2: Configure trace parser:
Add a trace parser processor with the following configuration:
- Trace ID field:
body.trace_id - Span ID field:
body.span_id
Step 3: Save and activate:
Once you save this pipeline, all your logs will have the span_id and trace_id extracted to attributes.
Final output sample log will look like:
{
  "body": "{\"level\":\"info\",\"trace_id\":\"95db539ae3400511c3afe5fbfce7bb36\",\"span_id\":\"e8f3b29fca420c9e\",\"method\":\"GET\",\"path\":\"/users/45\",\"status\":404,\"latency\":0.009166,\"client_ip\":\"::1\",\"time\":\"2025-08-19T16:06:45+05:30\",\"message\":\"Request processed\"}",
  "date": "2025-08-19T10:36:45.504706Z",
  "id": "0hehZ2k1O2ebOEqzDXsWeZL01w4",
  "timestamp": "2025-08-19T10:36:45.504706Z",
  "attributes": {
    "log.file.name": "app.log"
  },
  "resources": {
    "signoz.workspace.key.id": "01982bf9-3376-79cb-a309-22404a54e644"
  },
  "scope": {},
  "severity_text": "",
  "severity_number": 0,
  "scope_name": "",
  "scope_version": "",
  "span_id": "e8f3b29fca420c9e",
  "trace_flags": 0,
  "trace_id": "95db539ae3400511c3afe5fbfce7bb36"
}
You can now directly jump from traces to logs or logs to traces using the correlation buttons in the SigNoz UI.

Checkout this guide for more details about how to extract trace information from your logs.
Troubleshooting
Logs not appearing in SigNoz
- Check your ingestion key and endpoint are correct
- Ensure your application has network access to SigNoz
- Check for any errors in application logs
Missing trace_id or span_id in logs
- Ensure OpenTelemetry tracing is properly initialized
- Verify the middleware is extracting trace context correctly
- Check that you're using the trace-aware logger from context, not the global logger
Demo repository
For a complete working example of an application with correlated zerolog logs and application traces, checkout this repository.
