Logs are unstructured data, and analyzing them can be challenging. SigNoz provides the Grok Parser to parse unstructured logs using pre-defined patterns, making it simple to quickly analyze and extract information from your logs.
Prerequisites
- You are sending logs to SigNoz.
- You have access to the Logs Pipelines section in SigNoz UI.
Learn more about SigNoz Logs Pipelines.
About Grok Parser
Grok works by combining text patterns into something that matches your logs. It uses pre-defined patterns for common data types like IP addresses, timestamps, and numbers, and allows you to assign named captures to them.
The Concept:
Instead of writing a complex regex for an IP address (like \d{1,3}\.\d{1,3}\.\d{1,3}\.\d{1,3}), you simply use %{IP:ip_address}. The syntax is %{PATTERN_NAME:capture_name}.
Example Log
Throughout this guide, we'll use the following example of a standard web access log:
127.0.0.1 - - [27/Dec/2025:10:00:00 +0000] "GET /api/v1/users HTTP/1.1" 200 1234
Desired Outcome
After parsing, we want to extract specific information into structured attributes.
| Attribute | Value |
|---|---|
client_ip | 127.0.0.1 |
timestamp | 27/Dec/2025:10:00:00 +0000 |
method | GET |
request | /api/v1/users |
response_code | 200 |
bytes | 1234 |
The final processed log should look like this:
{
  "body": "127.0.0.1 - - [27/Dec/2025:10:00:00 +0000] \"GET /api/v1/users HTTP/1.1\" 200 1234",
  "attributes": {
    "client_ip": "127.0.0.1",
    "timestamp": "27/Dec/2025:10:00:00 +0000",
    "method": "GET",
    "request": "/api/v1/users",
    "response_code": "200",
    "bytes": "1234"
  }
}
Creating a Pipeline
Before you can parse logs, you need to create a pipeline that will filter and process them.
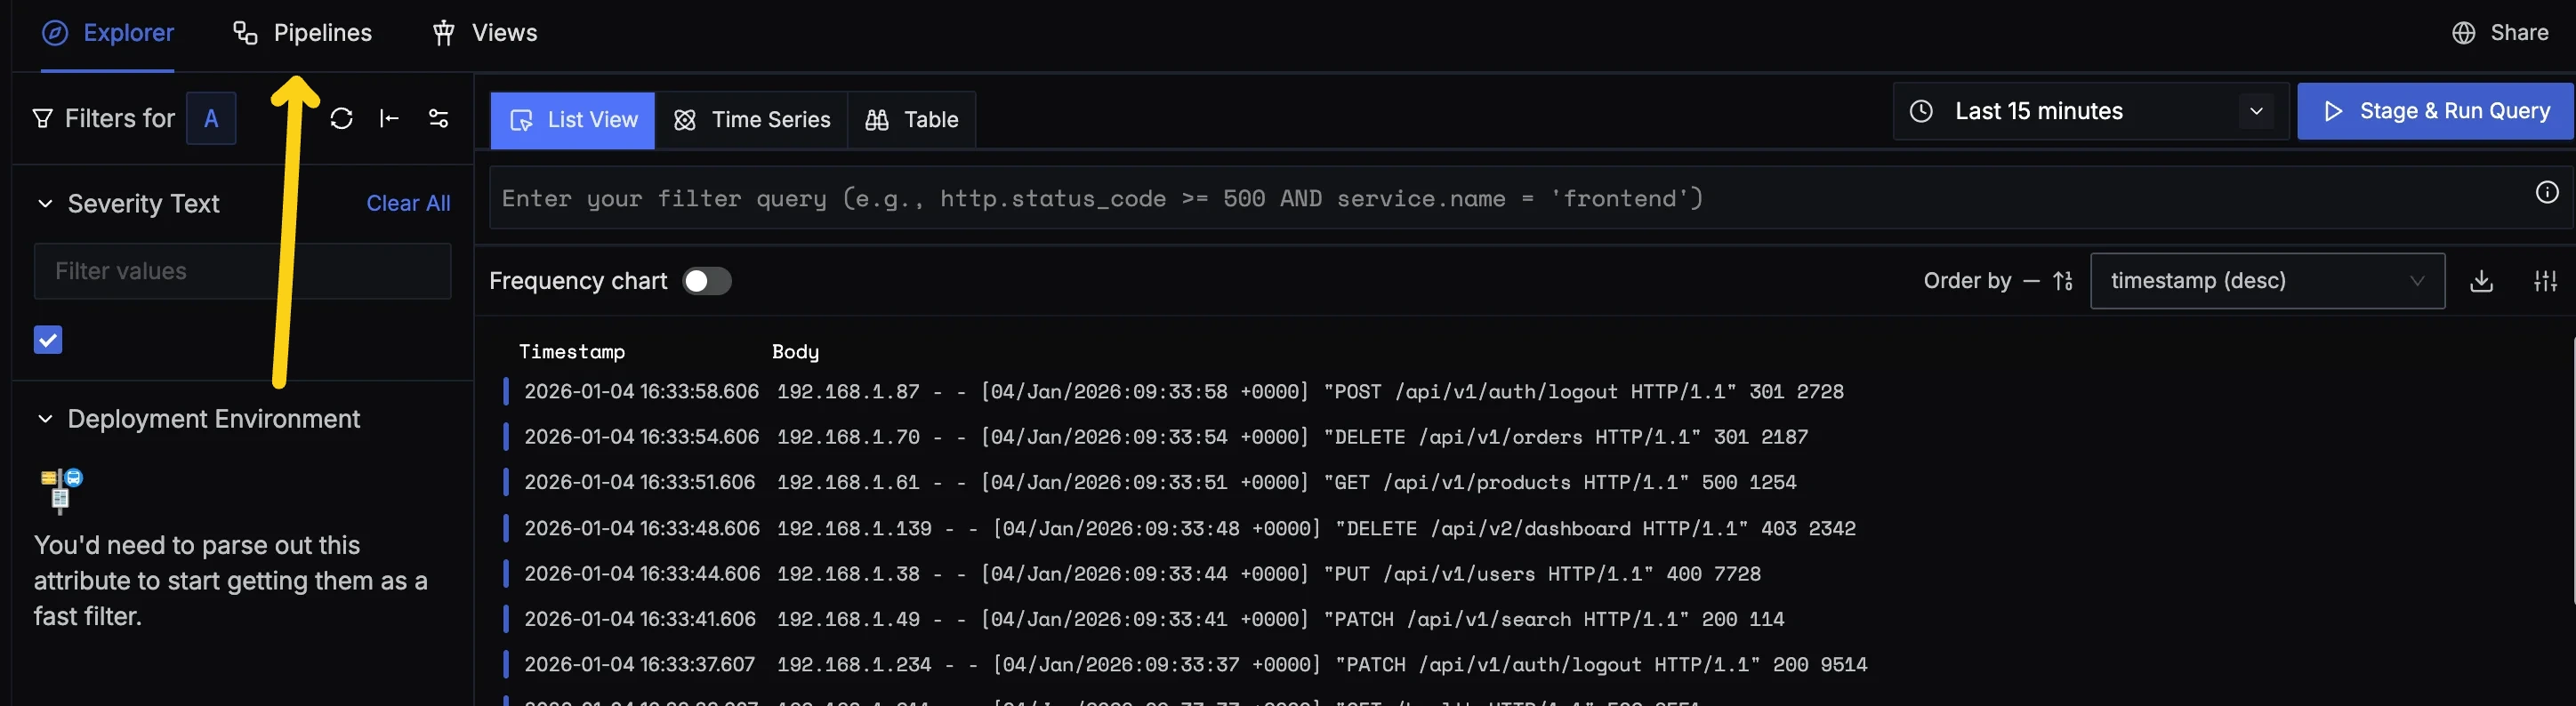
Step 1: Navigate to Pipelines Page
In SigNoz, go to Logs → Pipelines
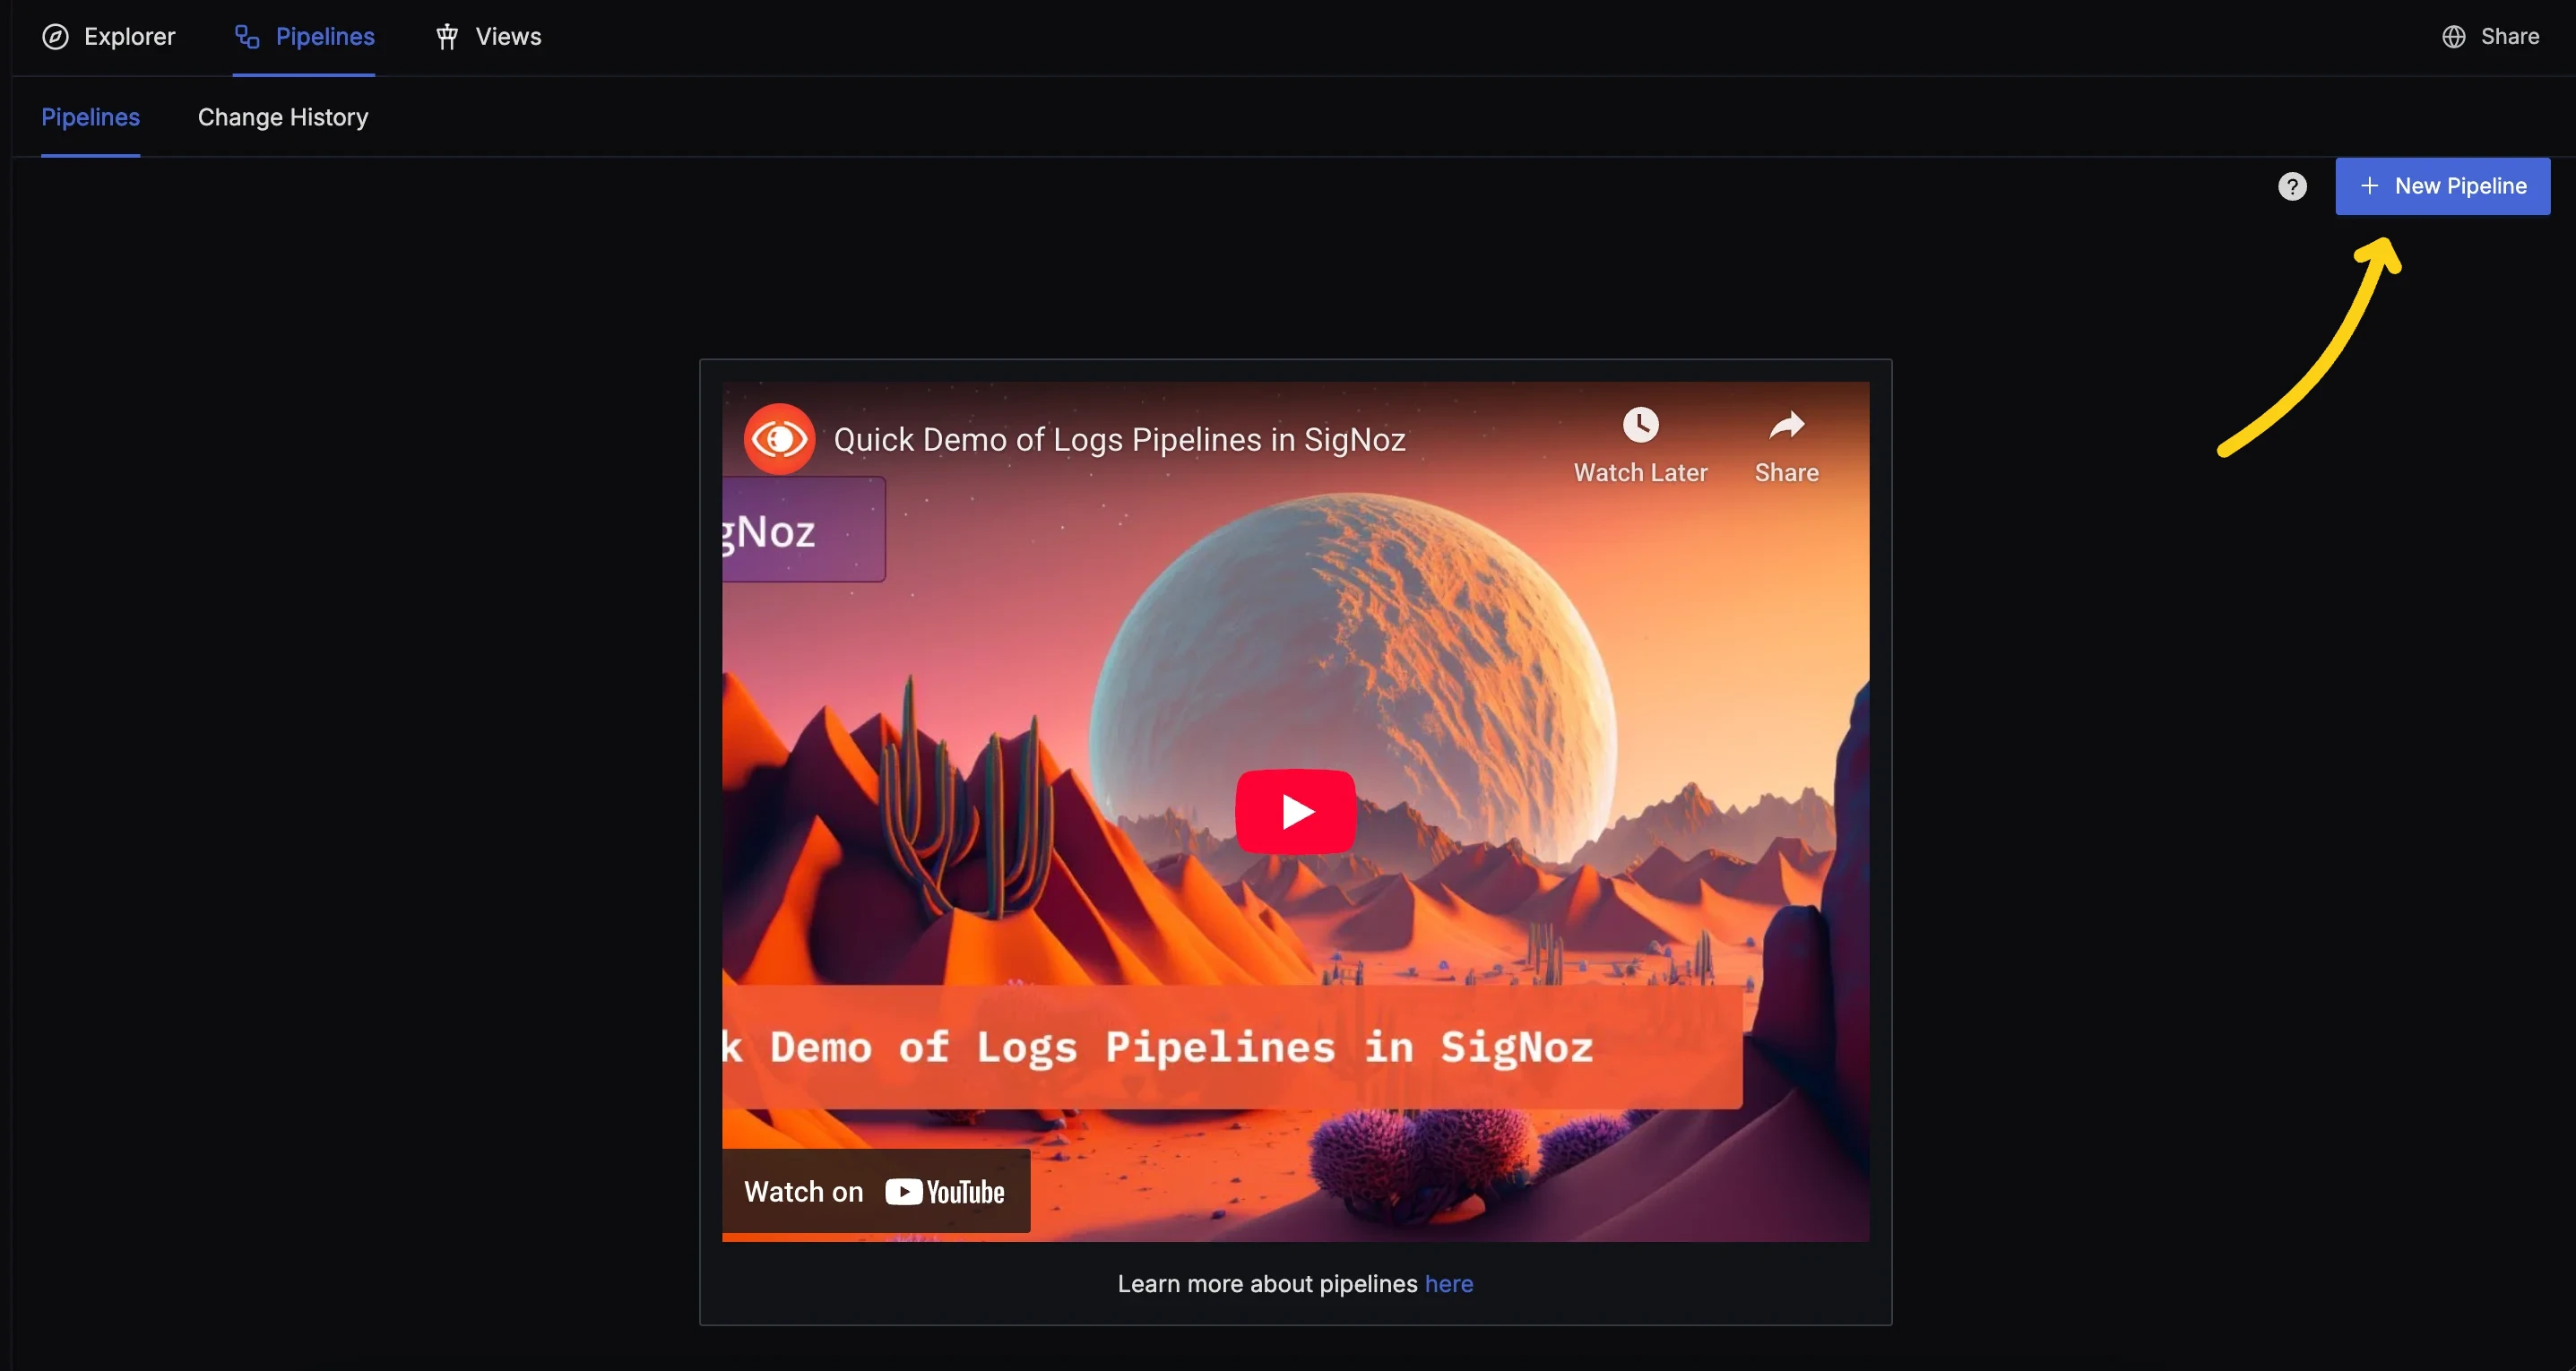
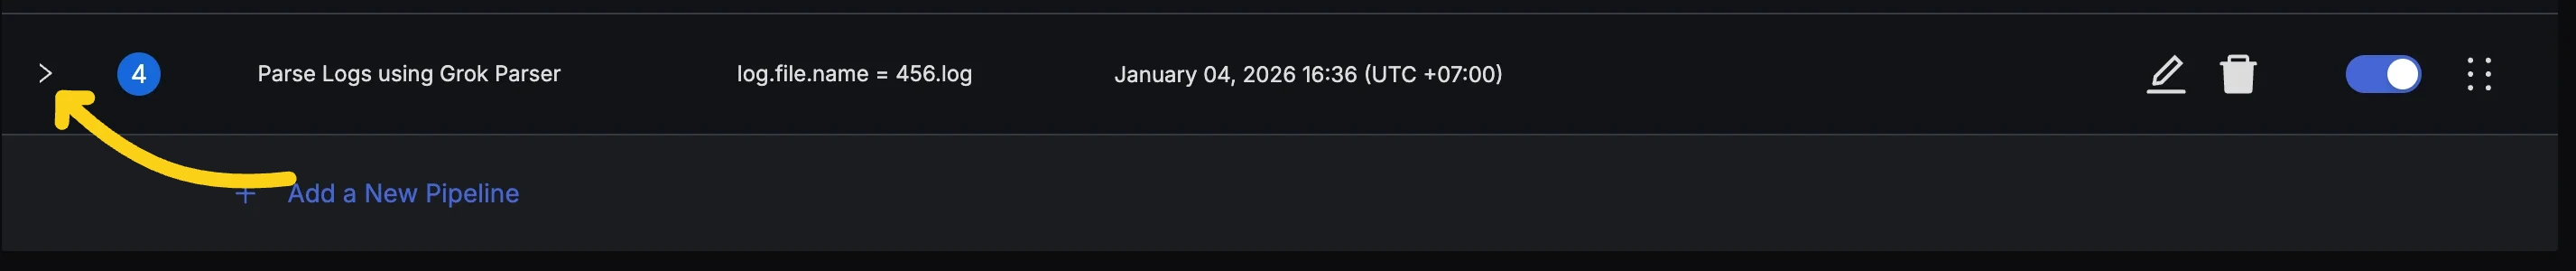
Step 2: Create a New Pipeline
- If you do not have existing pipelines, press the "New Pipeline" button.
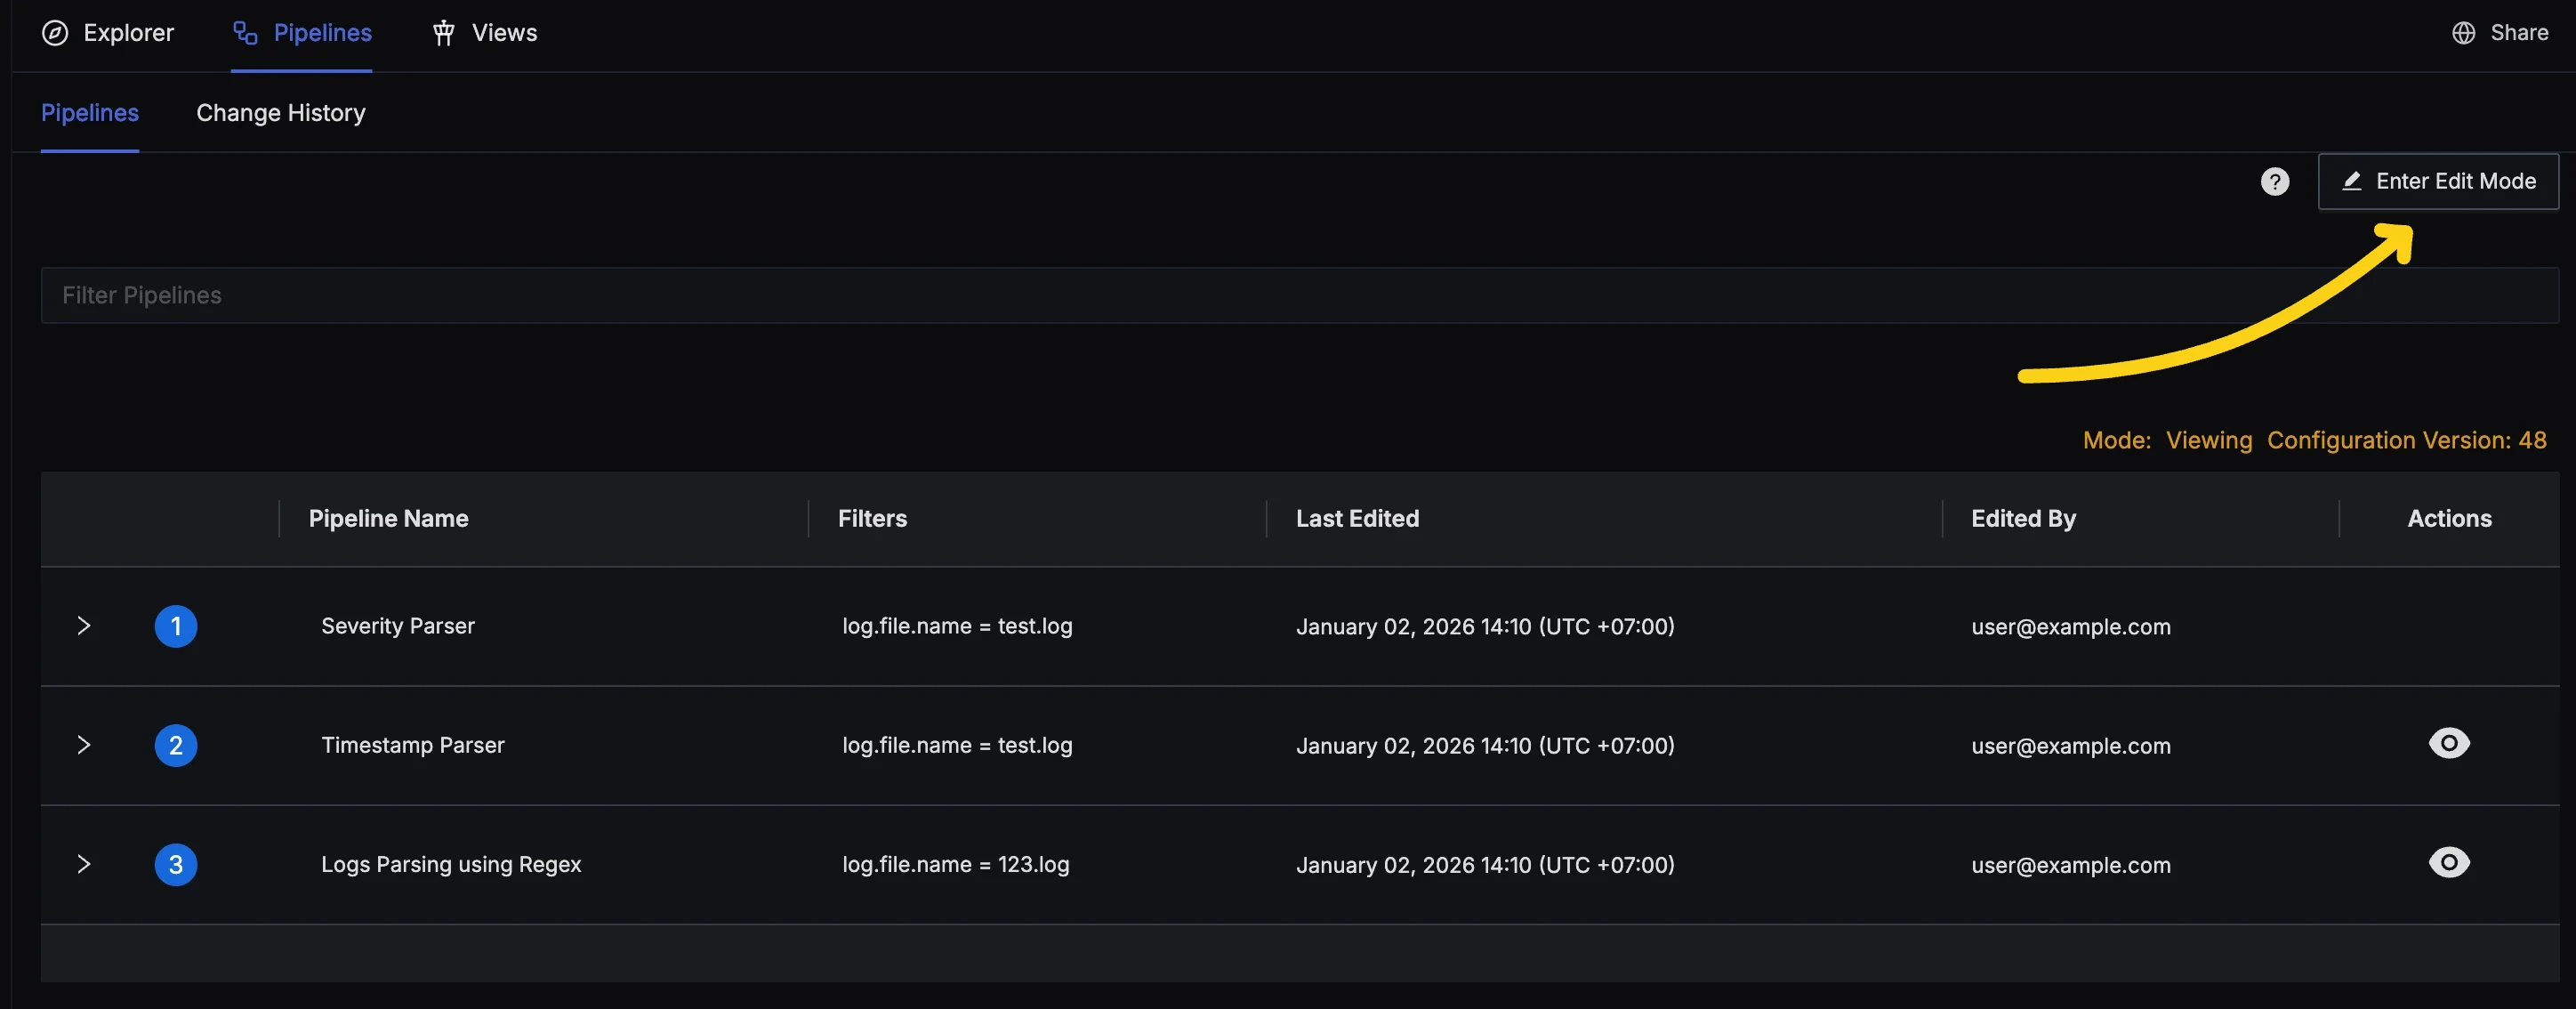
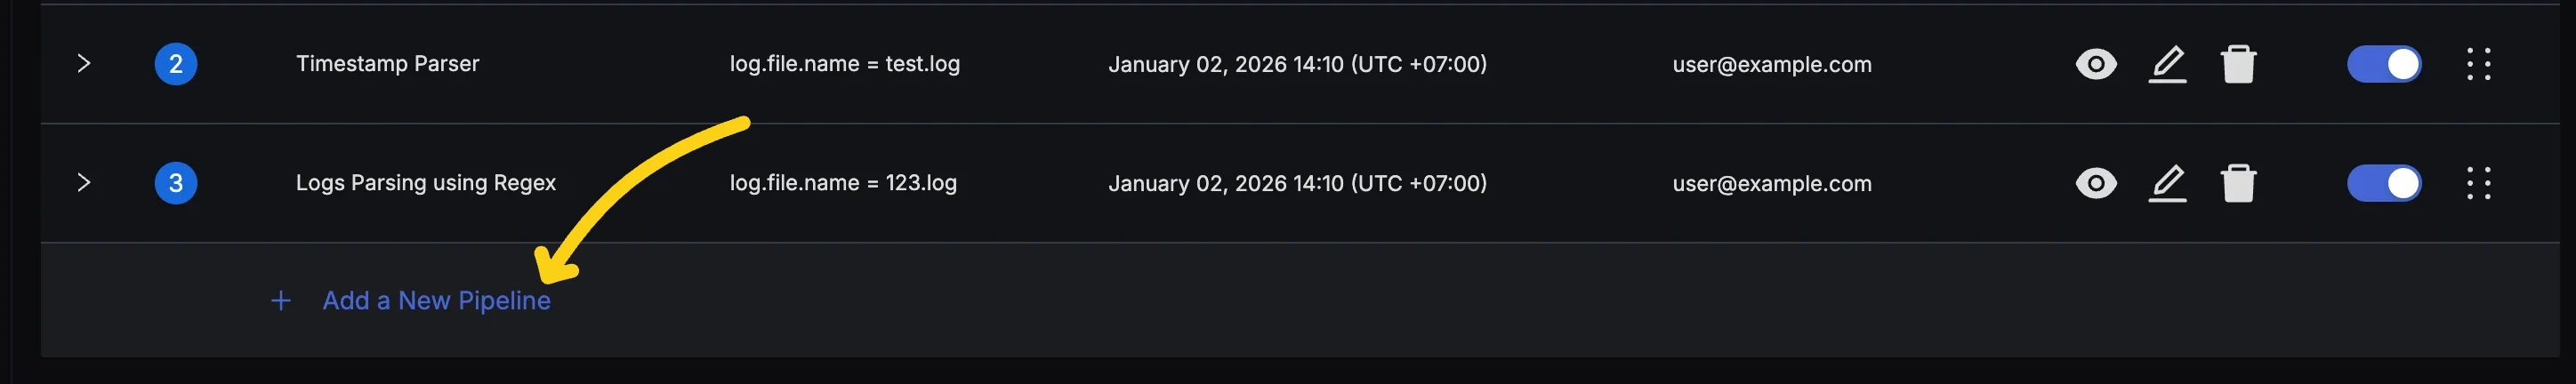
- If you already have some pipelines, press the "Enter Edit Mode" button and then click the "Add a New Pipeline" button at the bottom of the list.
Step 3: Configure the Pipeline
Provide details about the pipeline in the Create Pipeline Dialog:
- Name: Provide a descriptive pipeline name.
- Description: Add a detailed description for your pipeline (optional).
- Filter: Use the filter field to select the logs you want to process. For example,
service.name = my-apporlog.file.name = access.log. - Filtered Logs Preview: Verify that the logs you want to process are selected.
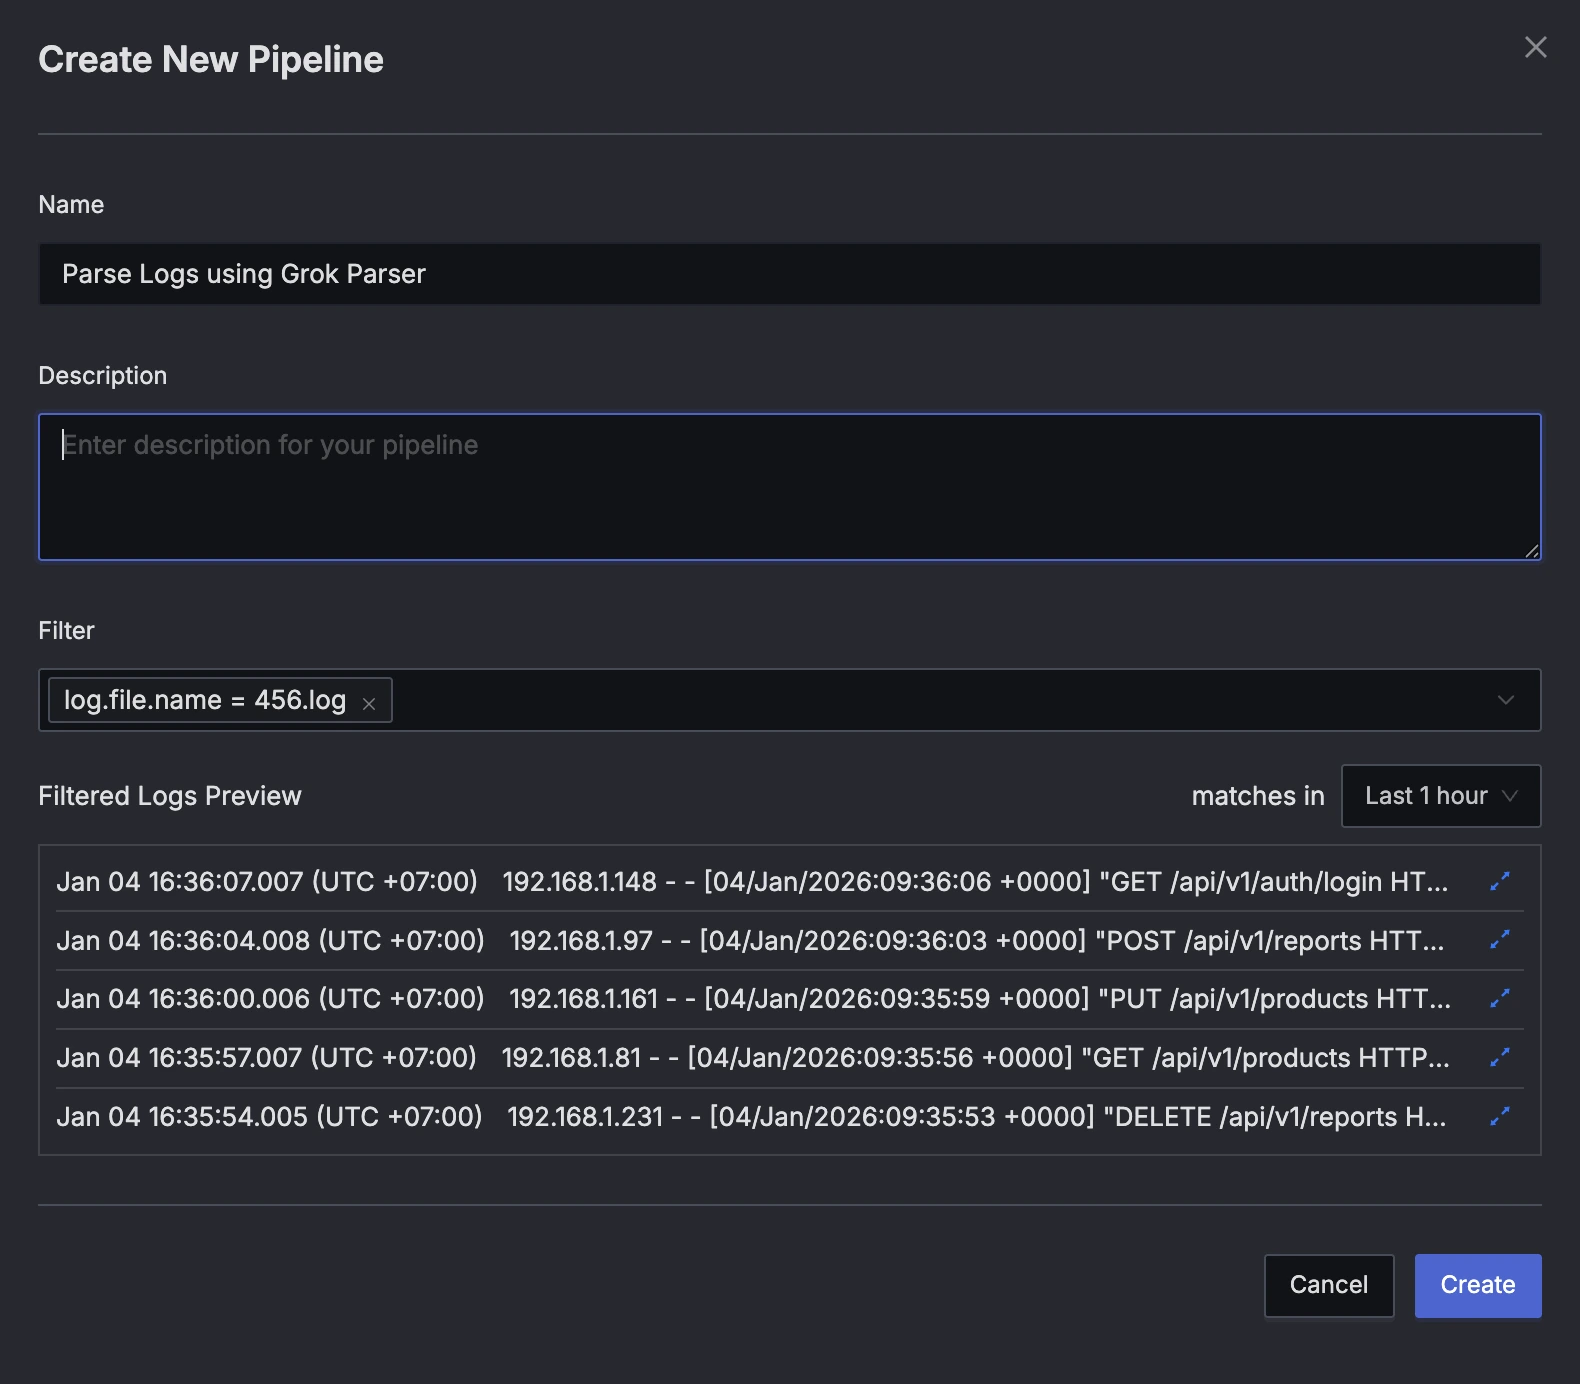
Press the "Create" button to create the pipeline.
Configuring Grok Parser
Now that we have a pipeline, we will add the Grok Parser processor to extract attributes from our log line.
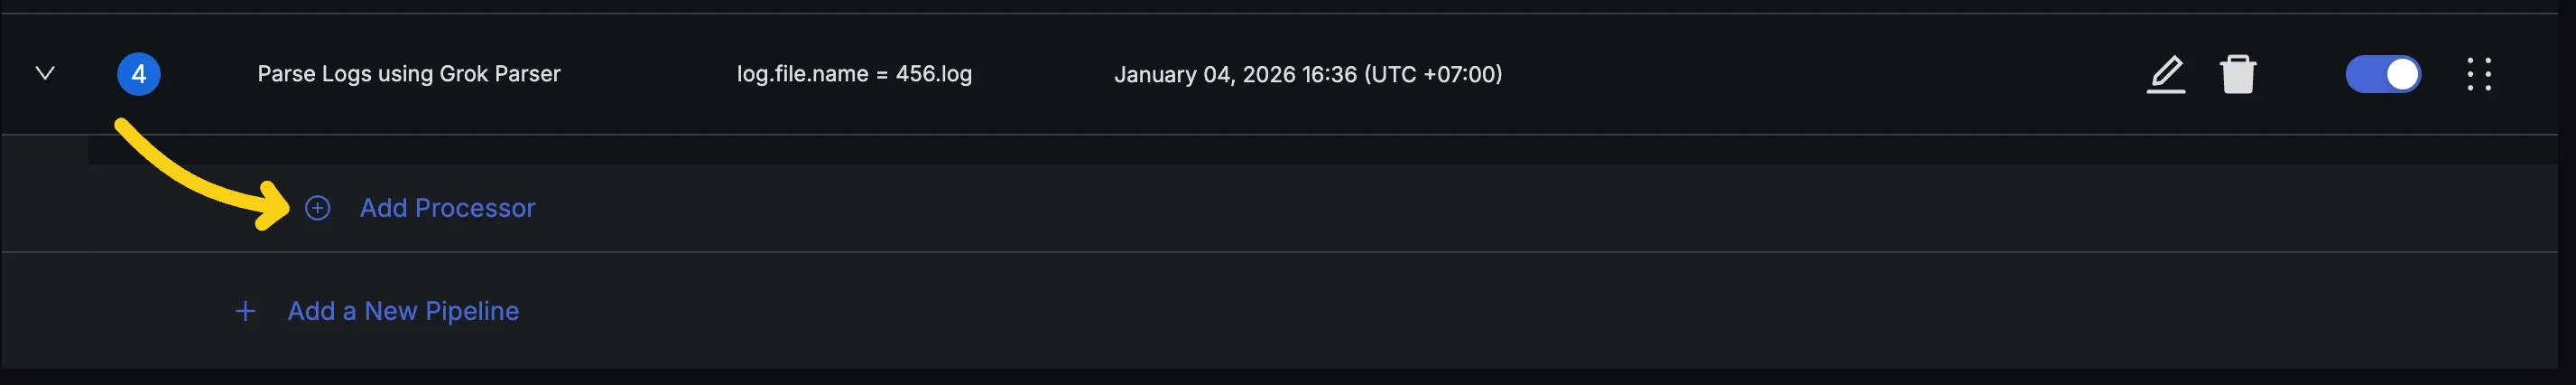
Step 1: Add a Processor
Expand your pipeline and click the "Add Processor" button.
Step 2: Configure Grok Parser
We will now configure the processor to parse the log message.
Before Parsing
At this stage, your log typically contains the raw message in the body field:
{
  "body": "127.0.0.1 - - [27/Dec/2025:10:00:00 +0000] \"GET /api/v1/users HTTP/1.1\" 200 1234"
}
Processor Configuration
Select Grok Parser and configure the fields:
- Name:
access_log_parser - Parse From:
body(This is where the raw message resides) - Parse To:
attributes(We want to add extracted values directly to log attributes) - Pattern:
%{IP:client_ip} %{USER:ident} %{USER:auth} \[%{HTTPDATE:timestamp}\] "%{WORD:method} %{URIPATHPARAM:request} HTTP/%{NUMBER:http_version}" %{NUMBER:response_code} %{NUMBER:bytes}
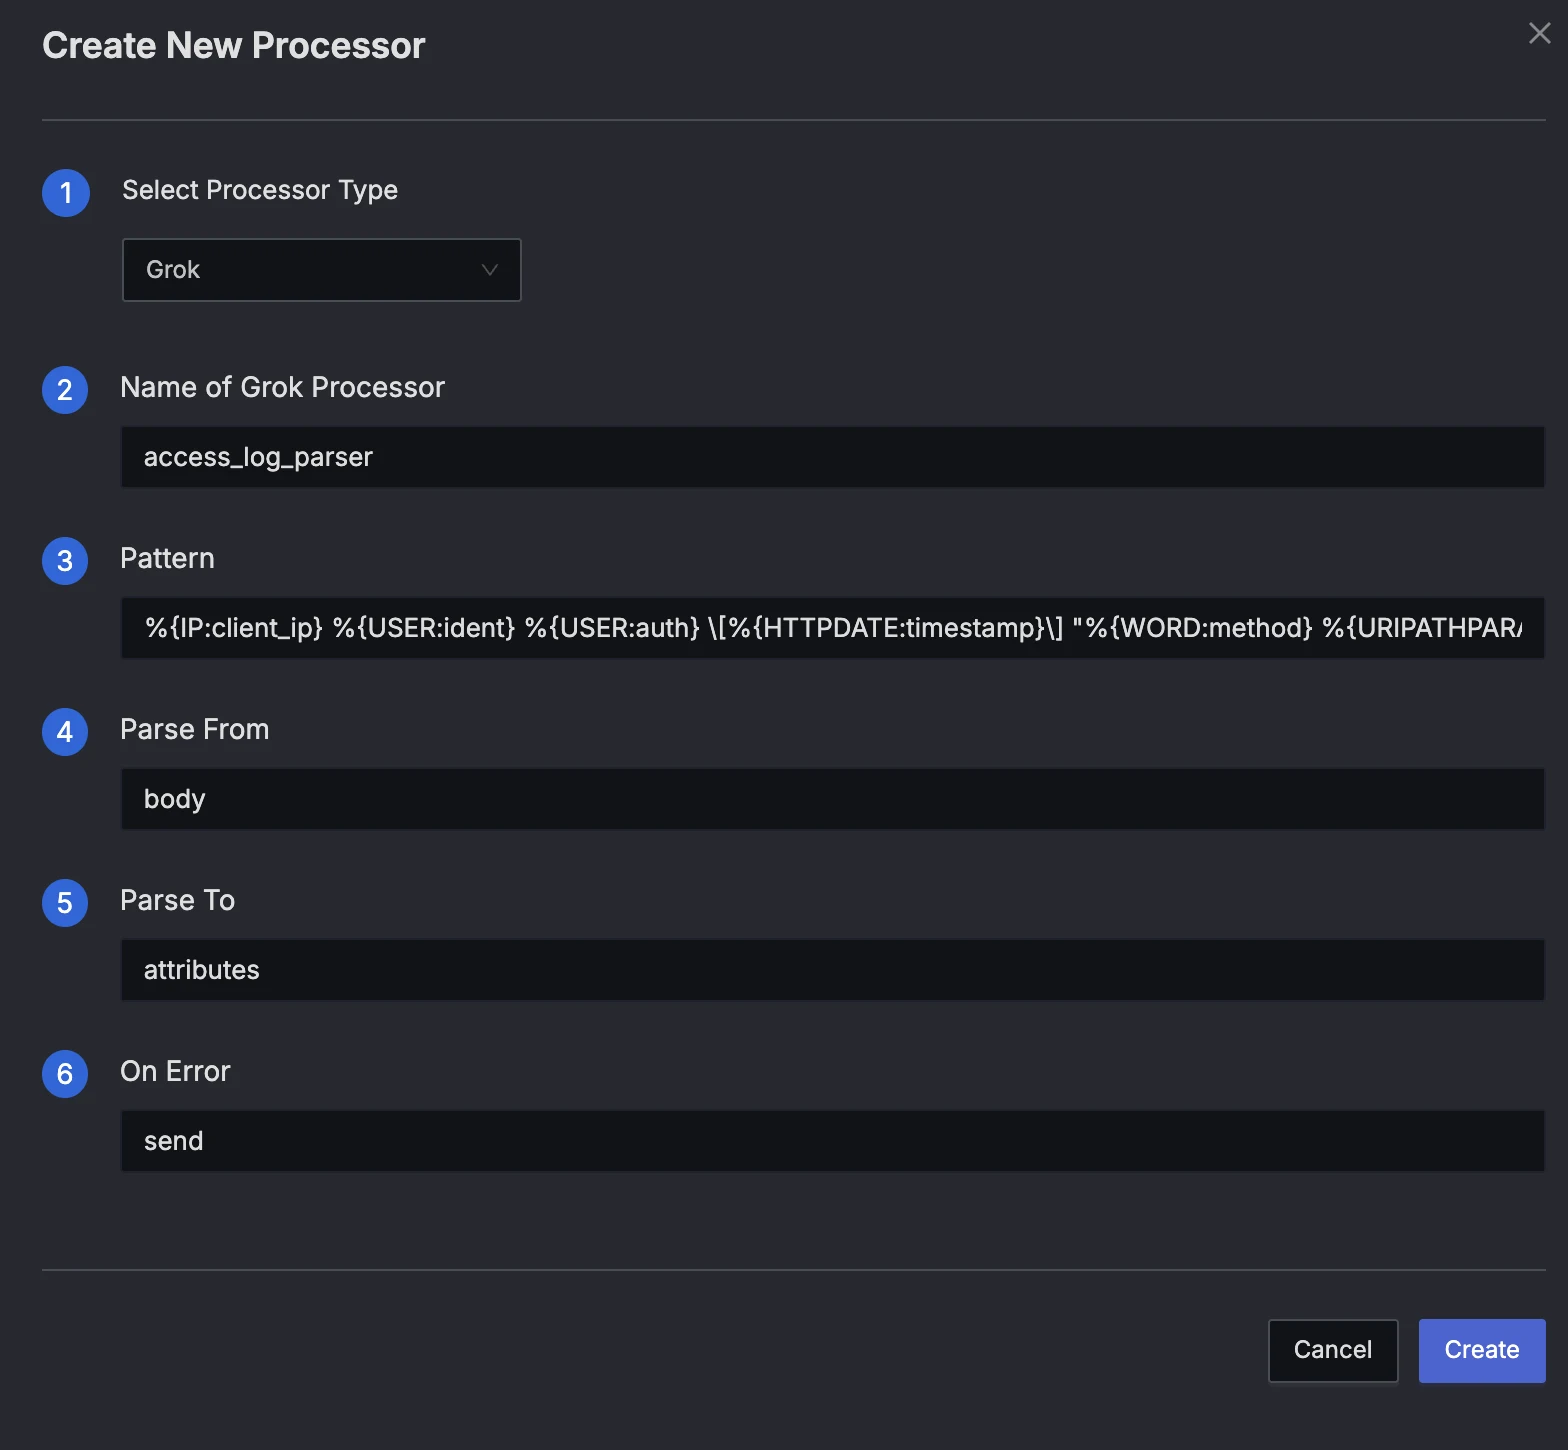
Press "Create" to add the processor.
After Parsing
Once the processor is applied, the log structure changes. The captured groups from the Grok pattern are added as keys in the attributes object.
{
  "body": "127.0.0.1 - - [27/Dec/2025:10:00:00 +0000] \"GET /api/v1/users HTTP/1.1\" 200 1234",
  "attributes": {
    "client_ip": "127.0.0.1",
    "ident": "-",
    "auth": "-",
    "timestamp": "27/Dec/2025:10:00:00 +0000",
    "method": "GET",
    "request": "/api/v1/users",
    "http_version": "1.1",
    "response_code": "200",
    "bytes": "1234"
  }
}
Key Observations
- The original
bodyremains unchanged. - New fields like
client_ip,method, andresponse_codeare now available inattributes, making them queryable in SigNoz.
Simulate and Validate
Before deploying, use the Simulate feature to test your parser:
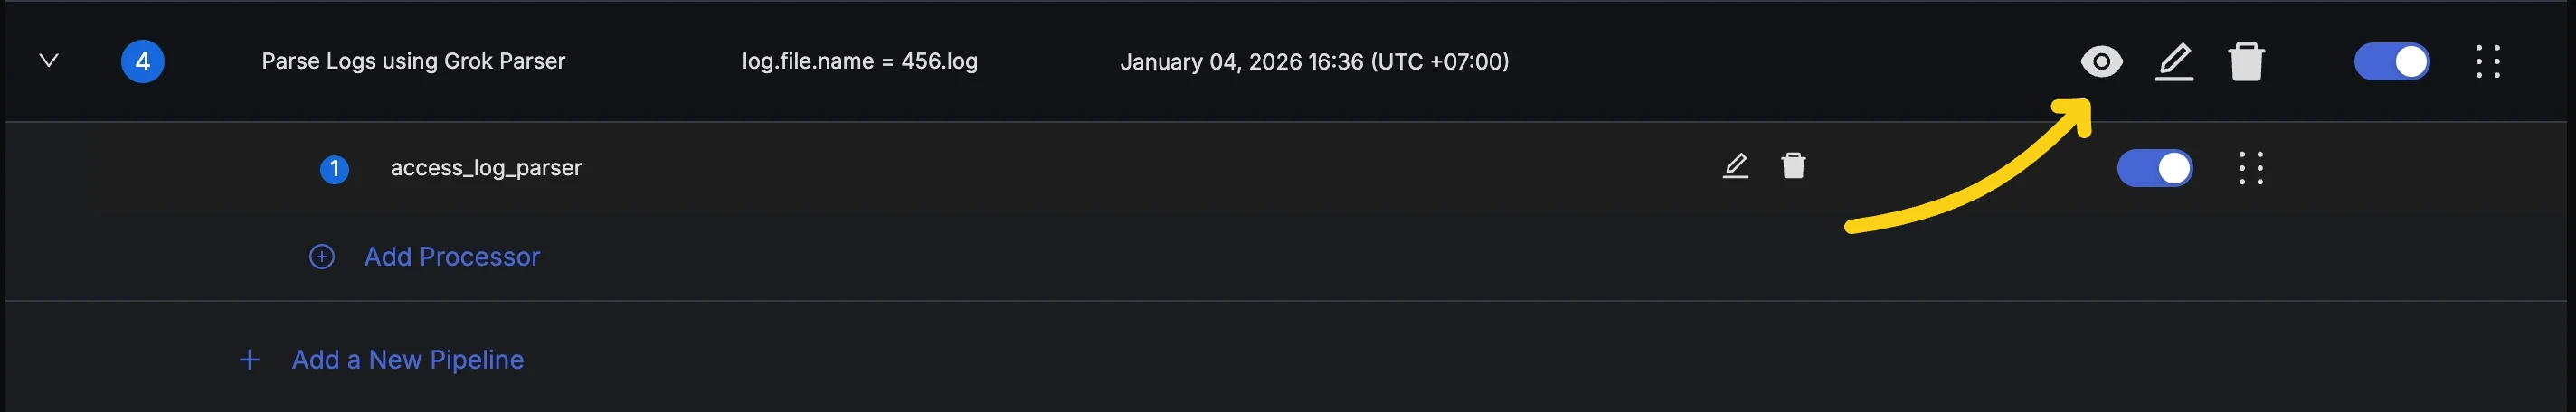
- Click the "eye" icon in the actions column for the pipeline to open the Pipeline Preview Dialog.
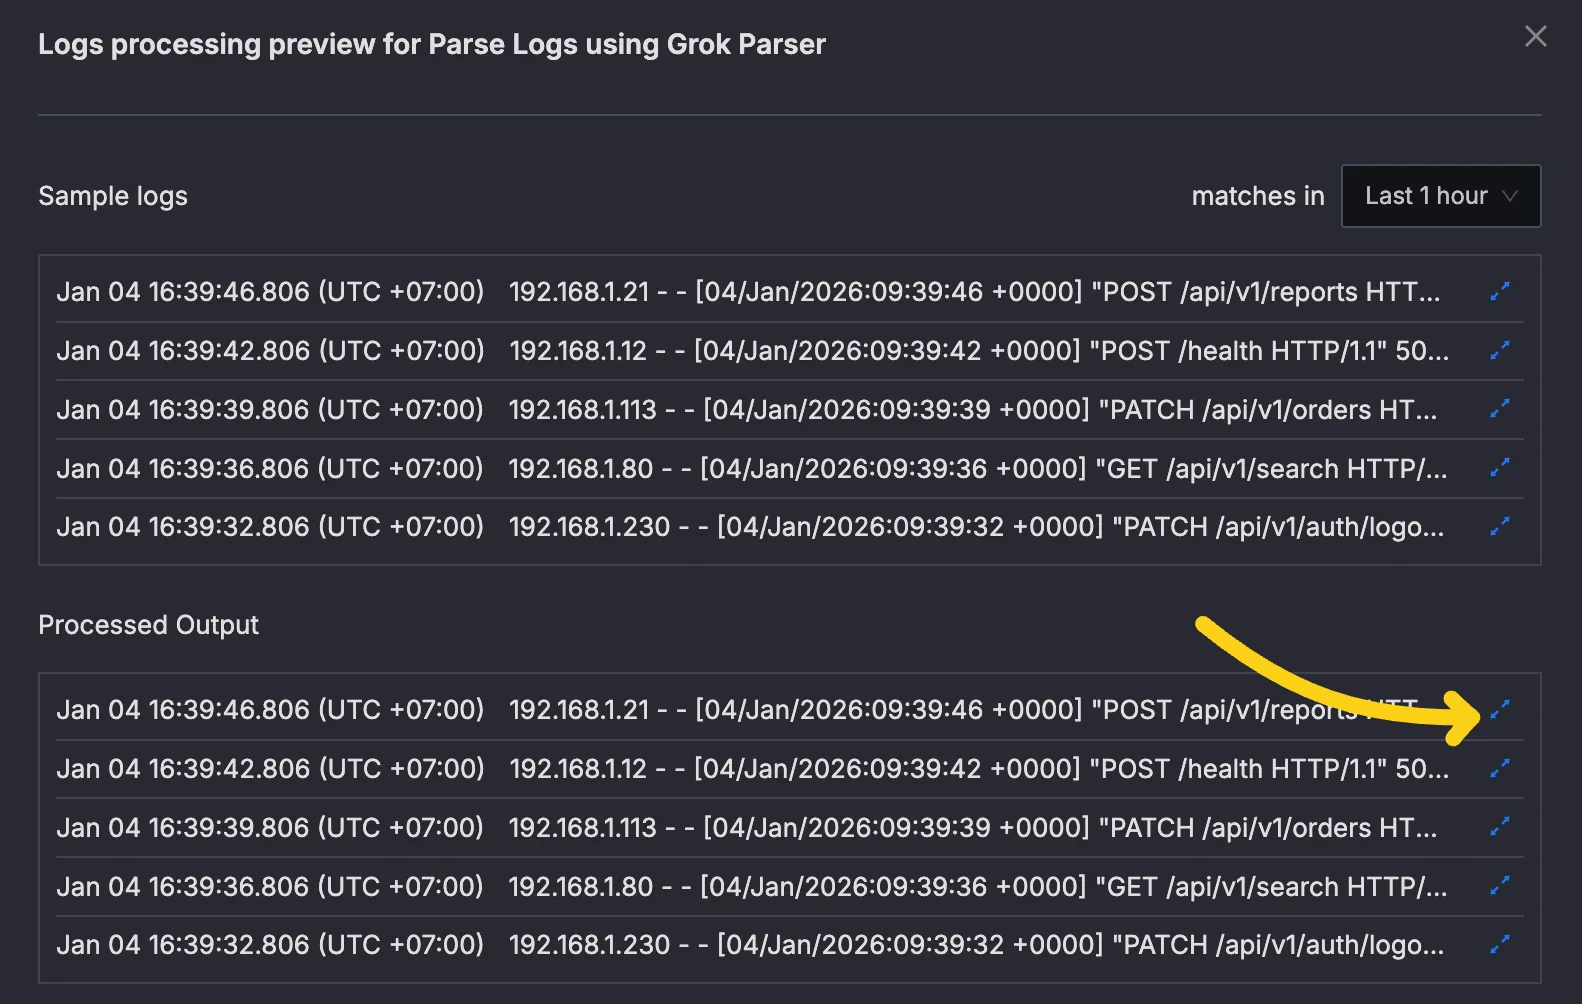
- Press the "Simulate Processing" button to see the output.
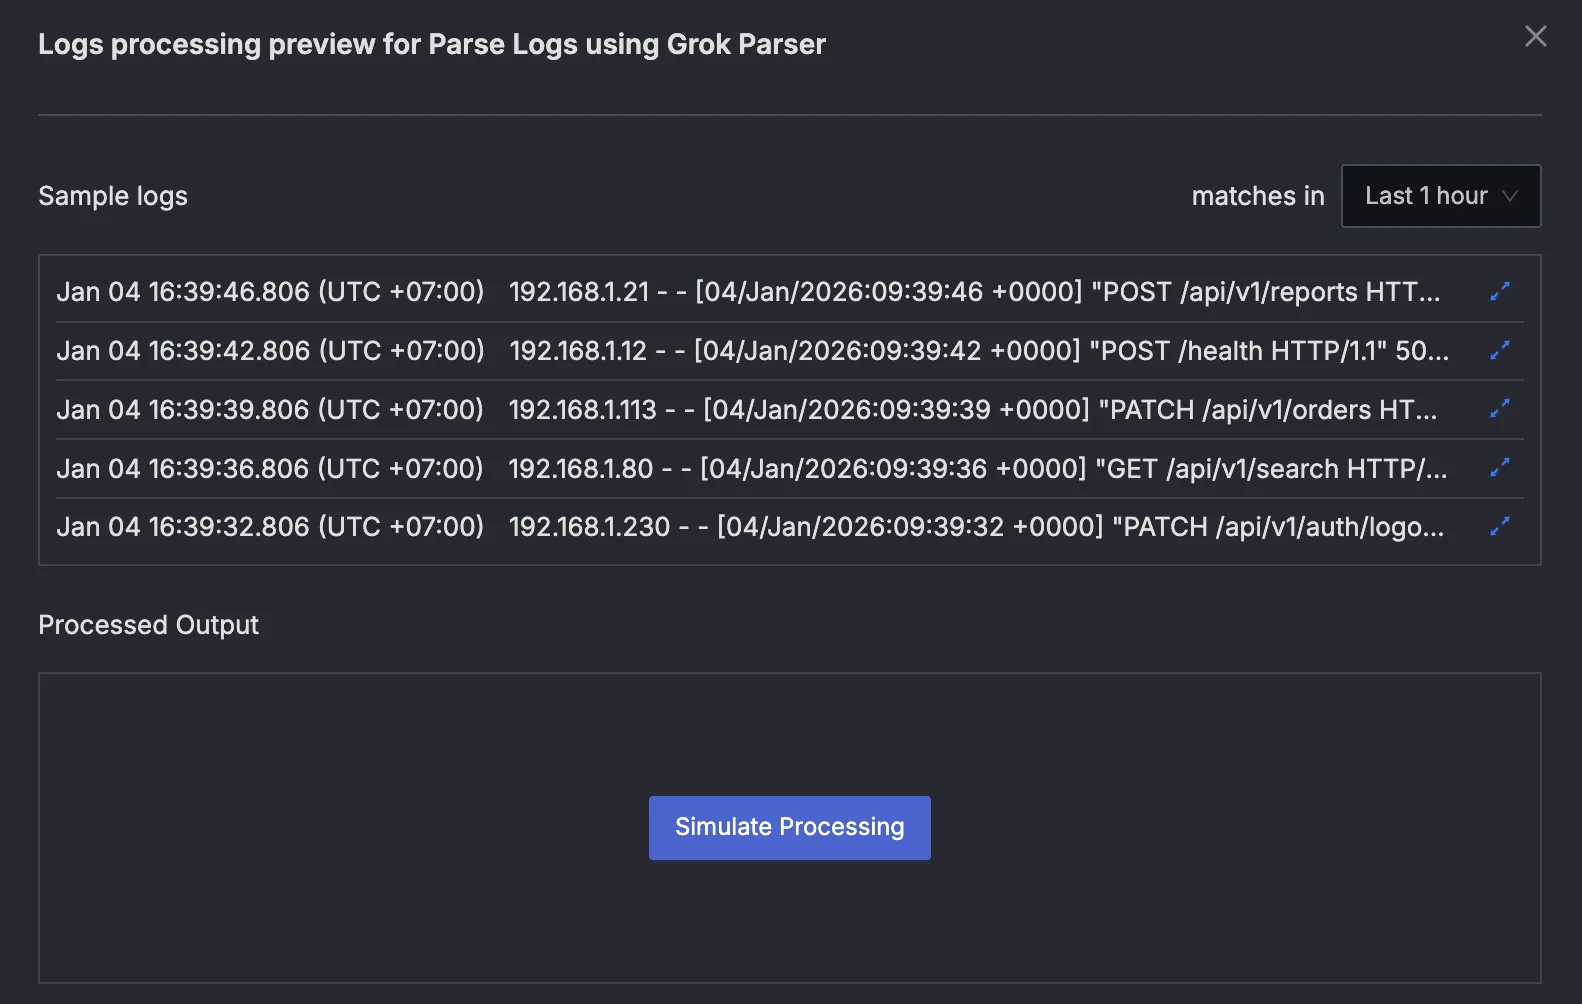
- Click the expand button next to processed log line to view the log details.
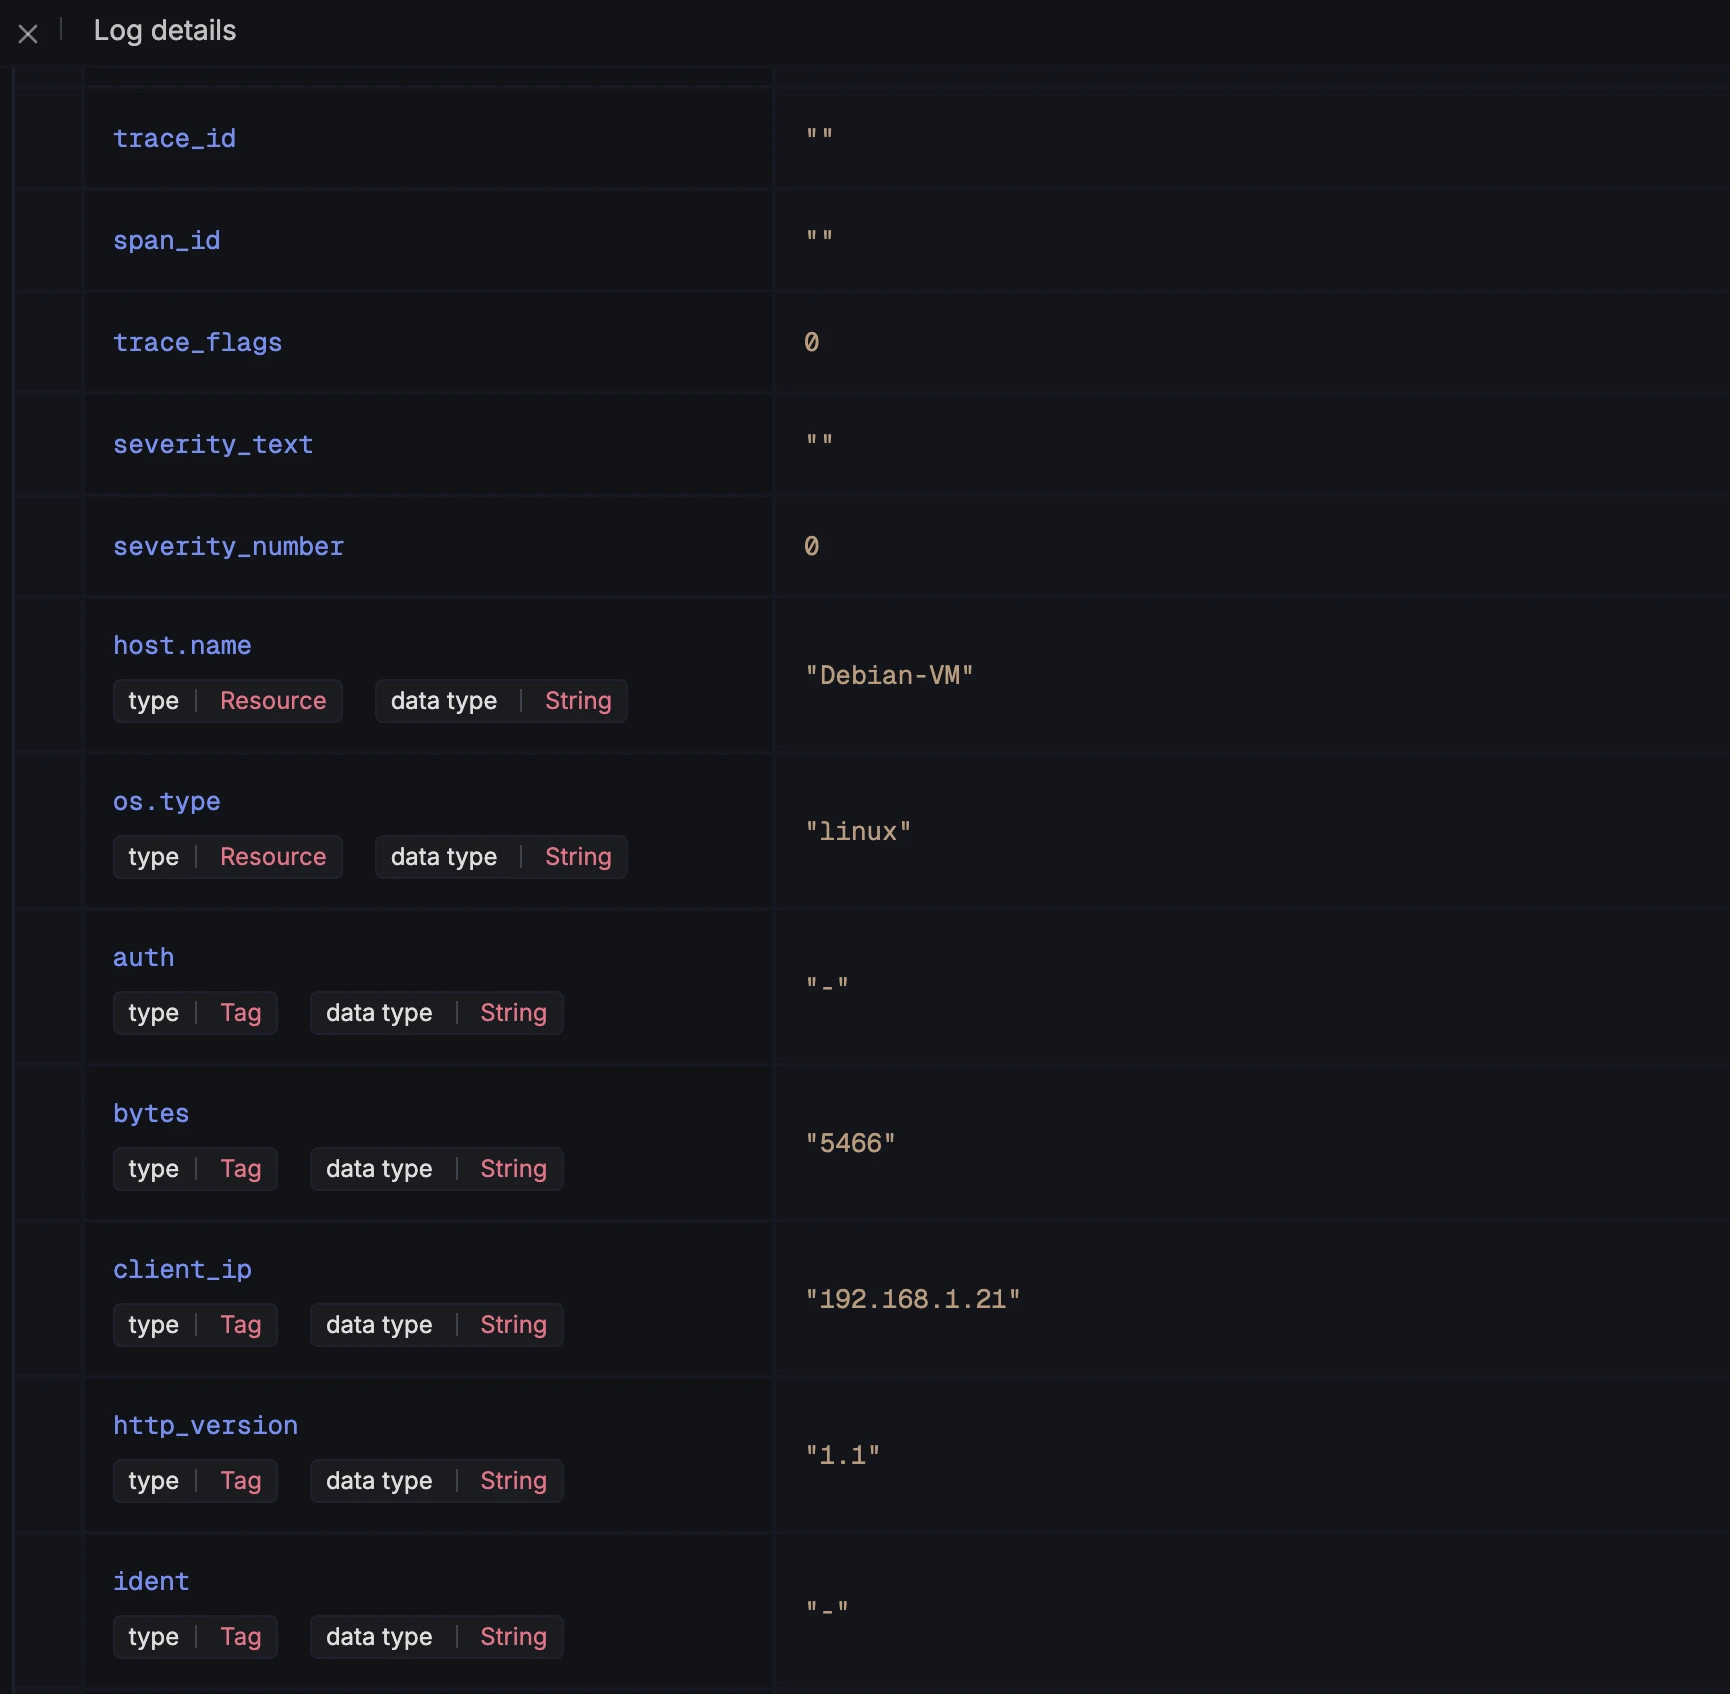
- Verify that the extracted attributes (
client_ip,method,response_code) appear correctly.
Deploy the Pipeline
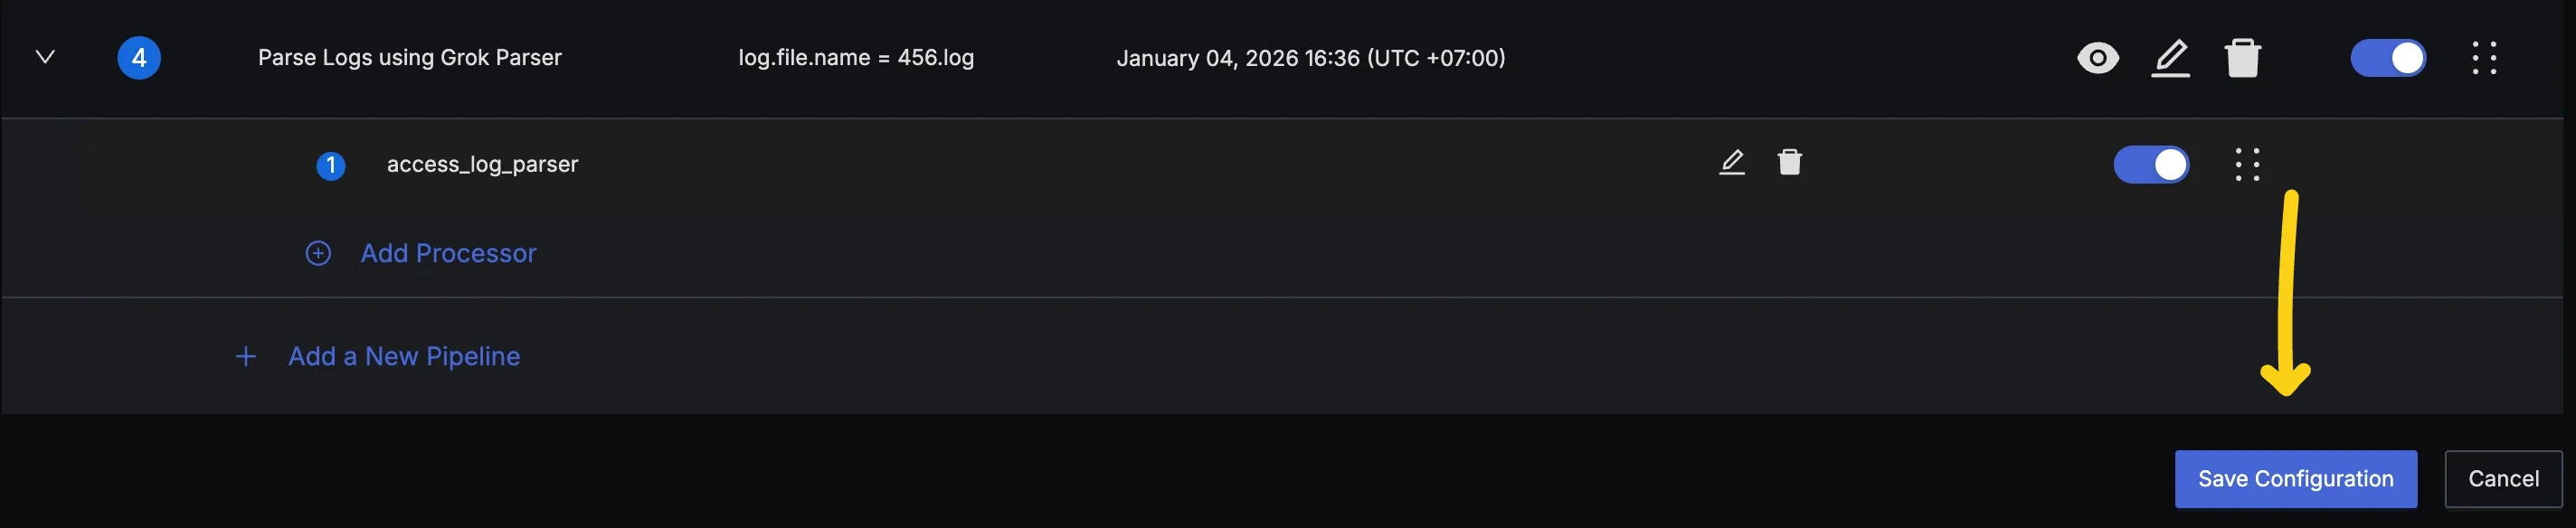
After verifying the simulated logs in Pipeline Preview Dialog, your pipeline is ready.
- Press the Save Configuration button at the bottom of the pipelines list. This will store the latest state of your pipelines and deploy them for pre-processing.
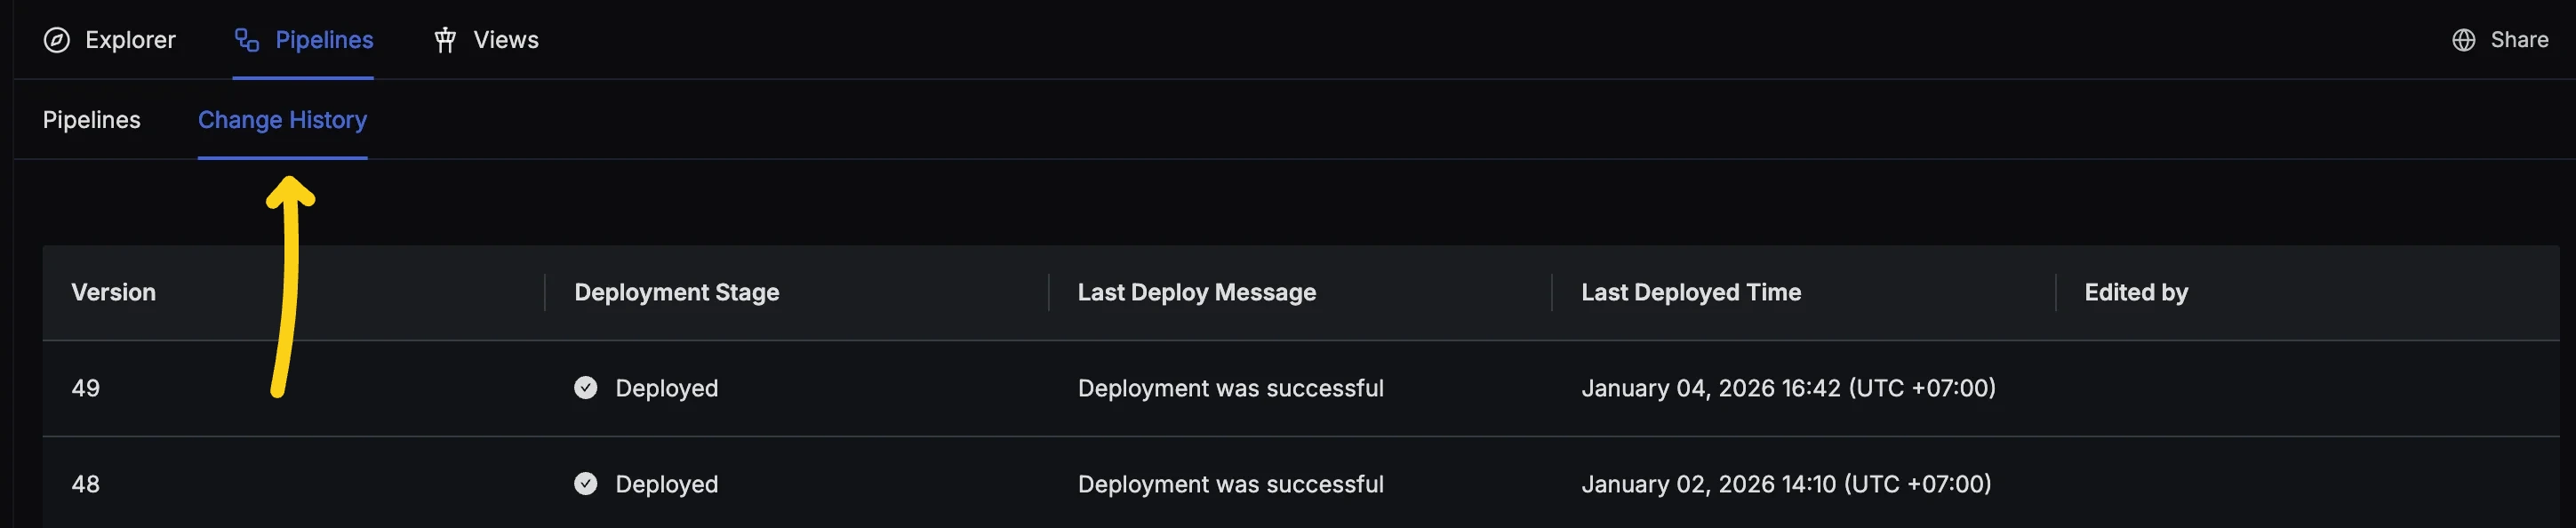
- You can track the deployment status using the Change History tab at the top of pipelines.
Final Output
Once deployed, your incoming logs will be transformed automatically.
{
  "body": "127.0.0.1 - - [27/Dec/2025:10:00:00 +0000] \"GET /api/v1/users HTTP/1.1\" 200 1234",
  "attributes": {
    "client_ip": "127.0.0.1",
    "ident": "-",
    "auth": "-",
    "timestamp": "27/Dec/2025:10:00:00 +0000",
    "method": "GET",
    "request": "/api/v1/users",
    "http_version": "1.1",
    "response_code": "200",
    "bytes": "1234"
  }
}
Related Guides
Troubleshooting
Parser not matching any logs
- Use the Simulate feature in the pipeline editor to test with real log entries.
- Check that
Parse Frompoints to the correct field (bodyvsattributes.message). - Test patterns with Grok Debugger .
Extracted attributes not appearing
- Ensure the pipeline is deployed after saving.
- Check pipeline order—parsers should run before processors that modify the same fields.
- Use unique attribute names to avoid conflicts.
Missing patterns
- SigNoz supports a wide range of default patterns (similar to Logstash).
- If a pattern is missing, try defining the specific regex part or see if a composite pattern exists.
- You can refer to common Grok patterns for a list of available definitions.
Get Help
If you need help with the steps in this topic, please reach out to us on SigNoz Community Slack.
If you are a SigNoz Cloud user, please use in product chat support located at the bottom right corner of your SigNoz instance or contact us at cloud-support@signoz.io.
