Kubernetes Monitoring - 8 Best Practices for Effective Cluster Monitoring
Monitoring Kubernetes clusters is essential for maintaining the performance, reliability, and security of your containerized applications. Given the dynamic and distributed nature of Kubernetes environments, effective monitoring can be challenging but is crucial for ensuring your applications run smoothly. By implementing best practices for Kubernetes monitoring, you can gain valuable insights into cluster health, quickly detect and resolve issues, optimize resource usage, and ensure compliance with service level agreements (SLAs).

In this article, we will discuss why Kubernetes monitoring is important, monitoring challenges, and best practices for effectively monitoring your Kubernetes clusters.
What Is Kubernetes Monitoring?
Kubernetes monitoring is the process of collecting, analyzing, and interpreting data from various components within a Kubernetes cluster. This data includes metrics, logs, and events generated by nodes, pods, containers, and the Kubernetes control plane itself. The goal of monitoring is to gain visibility into the health, performance, and overall state of the cluster and its workloads.
Why Monitor Kubernetes?
Kubernetes is a complex system with many moving parts. Without proper monitoring, it can be difficult to understand what's happening within your cluster and how your applications are performing. Monitoring provides the visibility and insights needed to:
- Ensure application performance and uptime: You can identify and address performance bottlenecks and other issues before they impact your users.
- Optimize resource utilization: You can allocate resources efficiently and avoid overprovisioning or underprovisioning.
- Maintain cluster health and stability: You can detect and resolve issues quickly to prevent downtime and ensure a stable application environment.
- Proactively manage your infrastructure: Monitoring helps you identify trends and patterns in resource usage and performance to anticipate future needs and make informed decisions about scaling and optimization.
- Improve security: With monitoring, you can detect and respond to security threats and vulnerabilities.
Kubernetes Monitoring Challenges
Monitoring Kubernetes clusters comes with its own set of challenges due to its dynamic and distributed nature. Here are some of the challenges with monitoring Kubernetes clusters:
- Dynamic Environment: Kubernetes resources like pods and nodes are ephemeral and constantly changing. This makes it difficult to track individual components and their relationships over time.
- Distributed Systems: Kubernetes clusters are distributed systems, meaning that components are spread across multiple nodes and locations. This distribution makes it challenging to correlate events and metrics from different sources and identify the root cause of issues.
- Complex Interactions: Kubernetes components interact in complex ways, making it difficult to understand the dependencies between them and how they impact each other's performance.
- High Volume of Data: Kubernetes generates a vast amount of data from various sources, including logs, metrics, and events. This data can be overwhelming and difficult to manage without proper tools and techniques.
Best practices for monitoring your Kubernetes Cluster
By following best practices for Kubernetes monitoring, you can ensure the health and performance of your cluster, detect and respond to issues promptly, optimize resource usage, and enhance the overall security and reliability of your applications. Here are some of the best practices that can be adopted to effectively monitor your Kubernetes cluster:
Choosing the Relevant Metrics to Monitor
When monitoring your Kubernetes cluster, selecting the appropriate metrics to track is crucial for gaining insights into its health and performance. Not all metrics are equally important; rather, focus on those that directly impact your application's performance, and reliability. The selection should be based on your monitoring objectives and KPIs.
Consider metrics such as resource utilization, pod and node availability, network traffic, and application performance to ensure comprehensive monitoring coverage. These metrics help you effectively gauge the cluster's behavior and detect any deviations from normal operation.
Implement the Use of Tags and Labels
Tags and labels are useful for organizing and filtering your Kubernetes resources. They allow you to categorize resources, services, and applications, making it easier to track specific entities within your cluster. For example, labeling pods by deployment name makes it simple to aggregate metrics related to a particular service or application. Similarly, tagging nodes by location or purpose aids in monitoring and managing resources efficiently.
Utilizing tags and labels effectively enhances the granularity and usability of your monitoring data, enabling more precise analysis and faster issue resolution.
You can set labels and tags in the command line using the kubectl command:
kubectl label deployments my-app-deployment app=my-demo-app environment=production
It can also be set directly in a manifest file:
apiVersion: apps/v1
kind: Deployment
metadata:
  name: podtato-head-entry
  namespace: podtato-kubectl
  labels:
    app: podtato-head
spec:
  selector:
    matchLabels:
      component: podtato-head-entry
  template:
    metadata:
      labels:
        component: podtato-head-entry
    spec:
      terminationGracePeriodSeconds: 5
      containers:
      - name: server
        image: ghcr.io/podtato-head/entry:latest
        imagePullPolicy: Always
        ports:
        - containerPort: 9000
        env:
        - name: PODTATO_PORT
          value: "9000"
After the deployment has been created, you can use the below format to filter deployments containing that specific label:
kubectl get deployment -l app=my-test-app -A
Output:
NAMESPACE         NAME                     READY   UP-TO-DATE   AVAILABLE   AGE
podtato-kubectl   podtato-head-entry       1/1     1            1           37m
podtato-kubectl   podtato-head-hat         1/1     1            1           37m
podtato-kubectl   podtato-head-left-arm    1/1     1            1           37m
podtato-kubectl   podtato-head-left-leg    1/1     1            1           37m
podtato-kubectl   podtato-head-right-arm   1/1     1            1           37m
podtato-kubectl   podtato-head-right-leg   1/1     1            1           37m
Use Service Auto Discovery
As your cluster grows, the number of services, pods, and other components will increase rapidly. Manually configuring monitoring for each newly deployed resource can be inefficient and prone to errors. To overcome this challenge, it is recommended to use a service auto discovery.
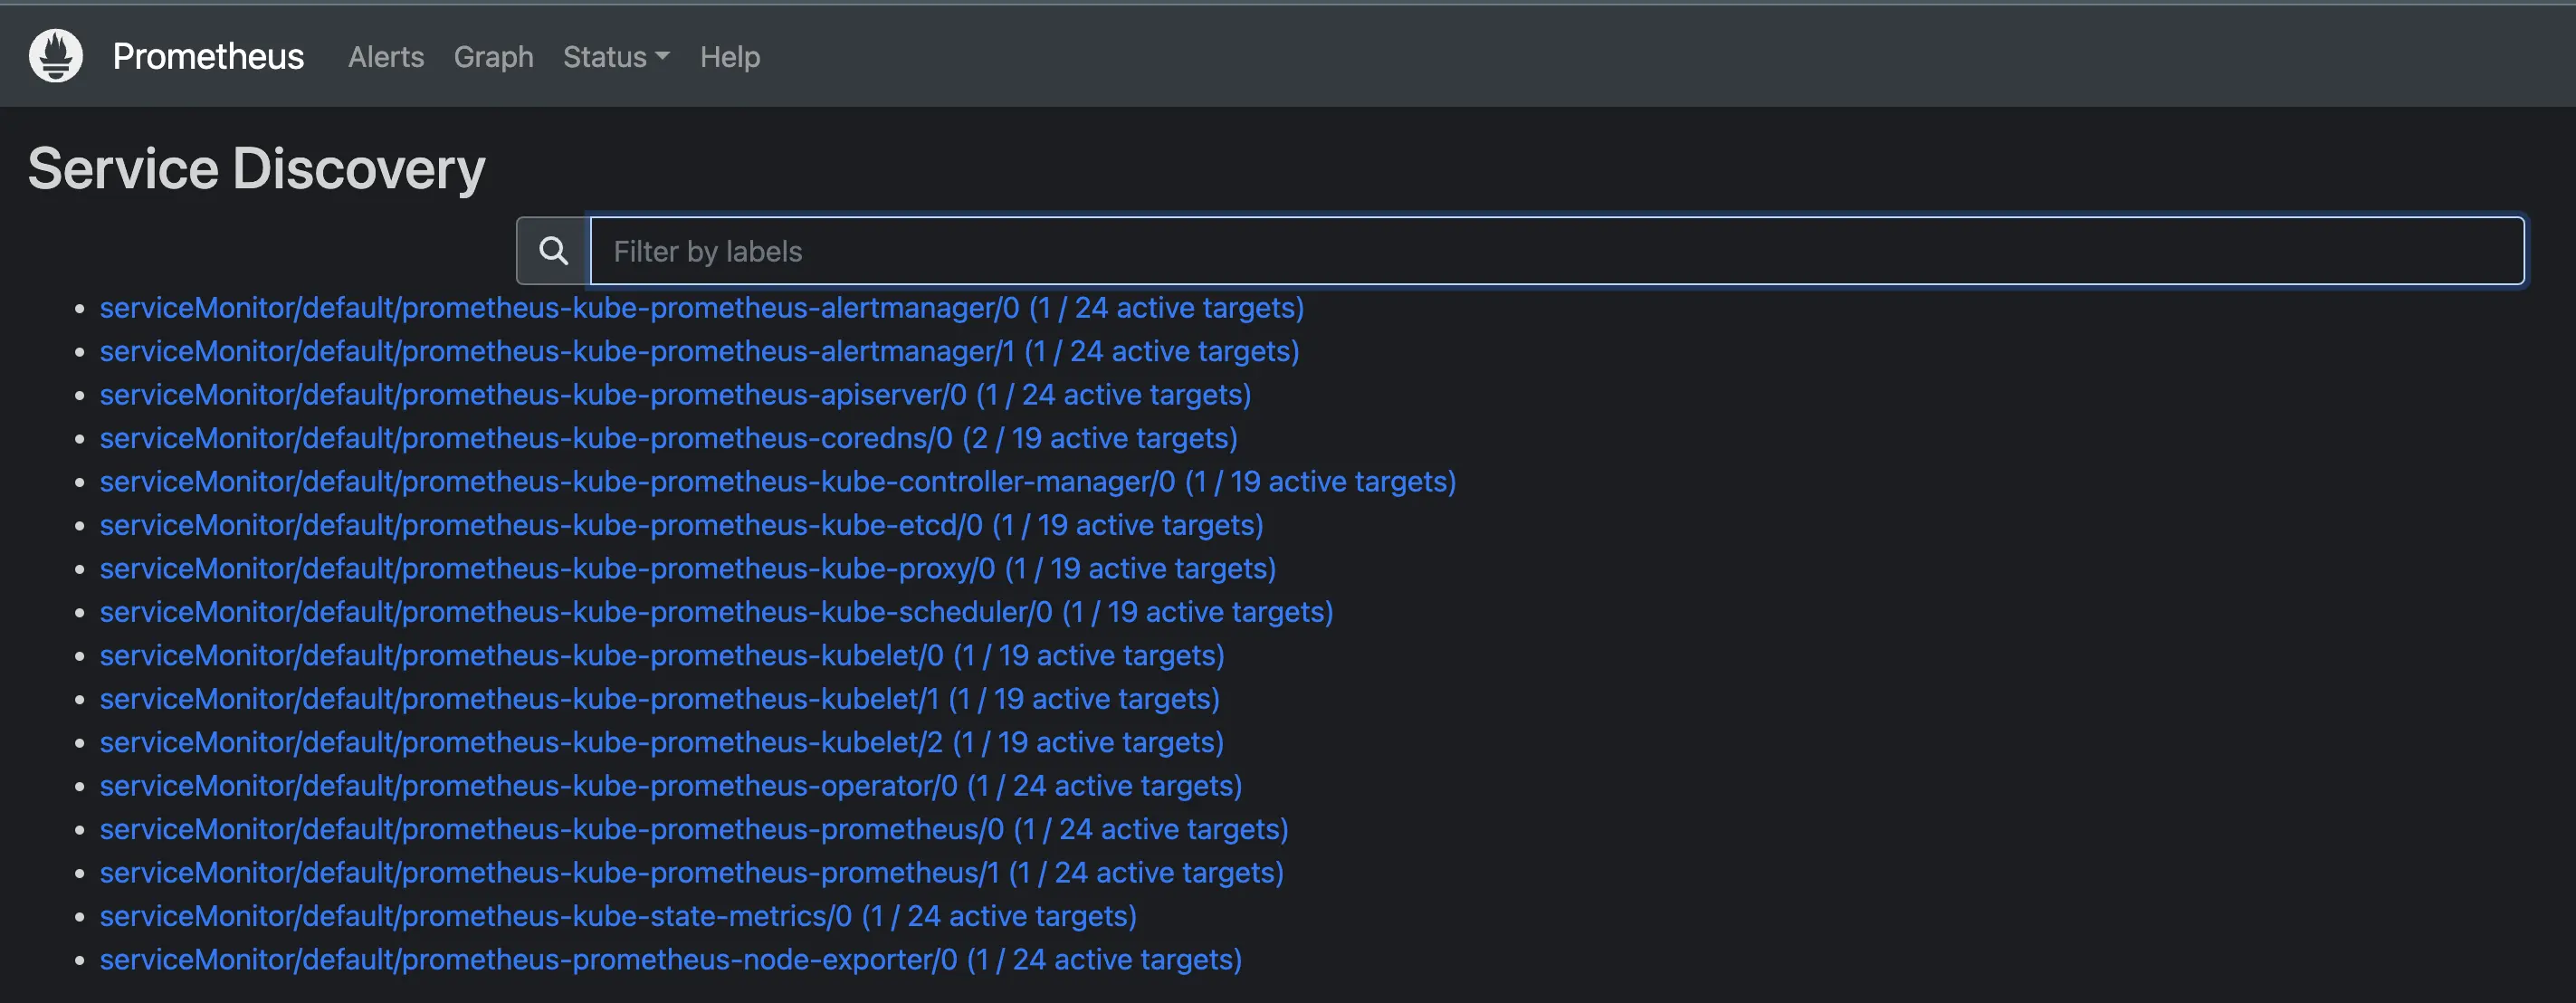
Service Auto Discovery is the process by which monitoring tools automatically detect and start tracking the services running within a Kubernetes cluster as they are created, scaled, or terminated. Instead of manually configuring monitoring for each new service, the monitoring system dynamically discovers and begins monitoring them as they are deployed. You can utilize tools like Prometheus to set up auto discovery in your cluster.

Monitor at Multiple Levels
Monitoring a Kubernetes cluster effectively requires a multi-layered approach. This ensures comprehensive visibility into all aspects of the cluster, from the underlying infrastructure to the individual applications running within the cluster.
- Cluster-Level Monitoring: Track overall cluster health, resource utilization (CPU, memory, storage), network traffic, and the status of core components like the API server and etcd.
- Node-Level Monitoring: Monitor individual nodes for resource usage, disk I/O, network latency, and hardware failures.
- Pod-Level Monitoring: Track the health of individual pods, including restarts, resource consumption, and container logs.
- Application-Level Monitoring: Gather metrics specific to your applications, such as request latency, error rates, and custom business metrics.
Collect Metrics using DaemonSets
A DaemonSet in Kubernetes ensures that a copy of a specific pod runs on all (or selected) nodes within a cluster. When new nodes are added to the cluster, the DaemonSet automatically deploys a pod to them. Conversely, when nodes are removed, the DaemonSet also removes the corresponding pods. This makes DaemonSets ideal for running monitoring agents on nodes to collect various metrics or logs about the system's health and performance.
By using a DaemonSet, you instruct Kubernetes to ensure there is one instance of a pod on every node. This means the monitoring agent is automatically deployed to any new nodes added to the cluster and removed from nodes that are taken down. This keeps your monitoring up-to-date and accurate as your cluster changes over time.
Use a unified monitoring solution (single pane of glass)
Adopting a unified monitoring solution is an important best practice for monitoring Kubernetes environments. This involves using a comprehensive platform that consolidates metrics, logs, traces, and events from all cluster components—nodes, pods, containers, and the Kubernetes control plane—into a centralized platform. This is known as "single pane of glass" monitoring.
This consolidated view significantly simplifies the identification and troubleshooting of issues across the entire infrastructure. It provides real-time visibility into the cluster's health and performance and allows for the correlation of metrics with logs and traces for easier analysis of data.

Set Up Meaningful Alerts
Setting up meaningful alerts is an important practice in monitoring your Kubernetes clusters. By defining thresholds for critical metrics, you ensure that alerts are triggered when these metrics are exceeded, allowing for immediate notification of any potential issues. This proactive approach ensures that corrective actions can be taken swiftly, minimizing the impact on users.
Alerts should be configured to notify you under several key conditions:
- When key metrics exceed their defined thresholds, indicating resource utilization spikes, increased error rates, or unacceptable latency.
- In response to critical events such as pod failures, node downtimes, or deployment rollouts that do not proceed as expected.
- Upon detection of security incidents, including unauthorized access attempts, suspicious network traffic, or identified vulnerabilities.
Here are some important events to be alerted of:
- KubeletDown: This alert is triggered when the Kubelet, the primary node agent in Kubernetes responsible for maintaining the desired state of pods and containers, becomes unresponsive or unavailable. It indicates a potential node failure.
- KubePodCrashLooping: A pod enters a crash loop when its containers repeatedly crash and restart. This could be due to errors in the container's code, misconfigurations, or resource limitations.
- KubePodNotReady: This alert signals that a pod is not in a "Ready" state, meaning it's not available to serve traffic. It could be due to initialization errors, readiness probe failures, or other issues preventing the pod from starting or functioning correctly.
- KubeDeploymentReplicasMismatch: This alert is triggered when the actual number of running replicas in a Deployment doesn't match the desired number specified in the Deployment configuration. It could indicate that pods are failing to start, are being terminated, or are not scaling as expected.
- KubeNodeNotReady: When a node is in a "NotReady" state, it's not able to schedule new pods and might be experiencing issues like network connectivity problems, hardware failures, or resource constraints.
Monitor End-User Experience
Monitoring your end-user experience is important in ensuring that applications are performing optimally from the perspective of the users. This involves tracking key performance indicators (KPIs) such as response times, error rates, and throughput, which directly influence the end-user experience and reflect how well your applications serve their intended audience.
By continuously monitoring these metrics, you can proactively identify and address potential issues before they escalate, ensuring a seamless and satisfactory experience for users.
Kubernetes Monitoring with SigNoz
If you need complete visibility into your cluster's health and performance or want to proactively address potential issues before they impact your services, SigNoz provides a comprehensive monitoring solution designed for Kubernetes environments.
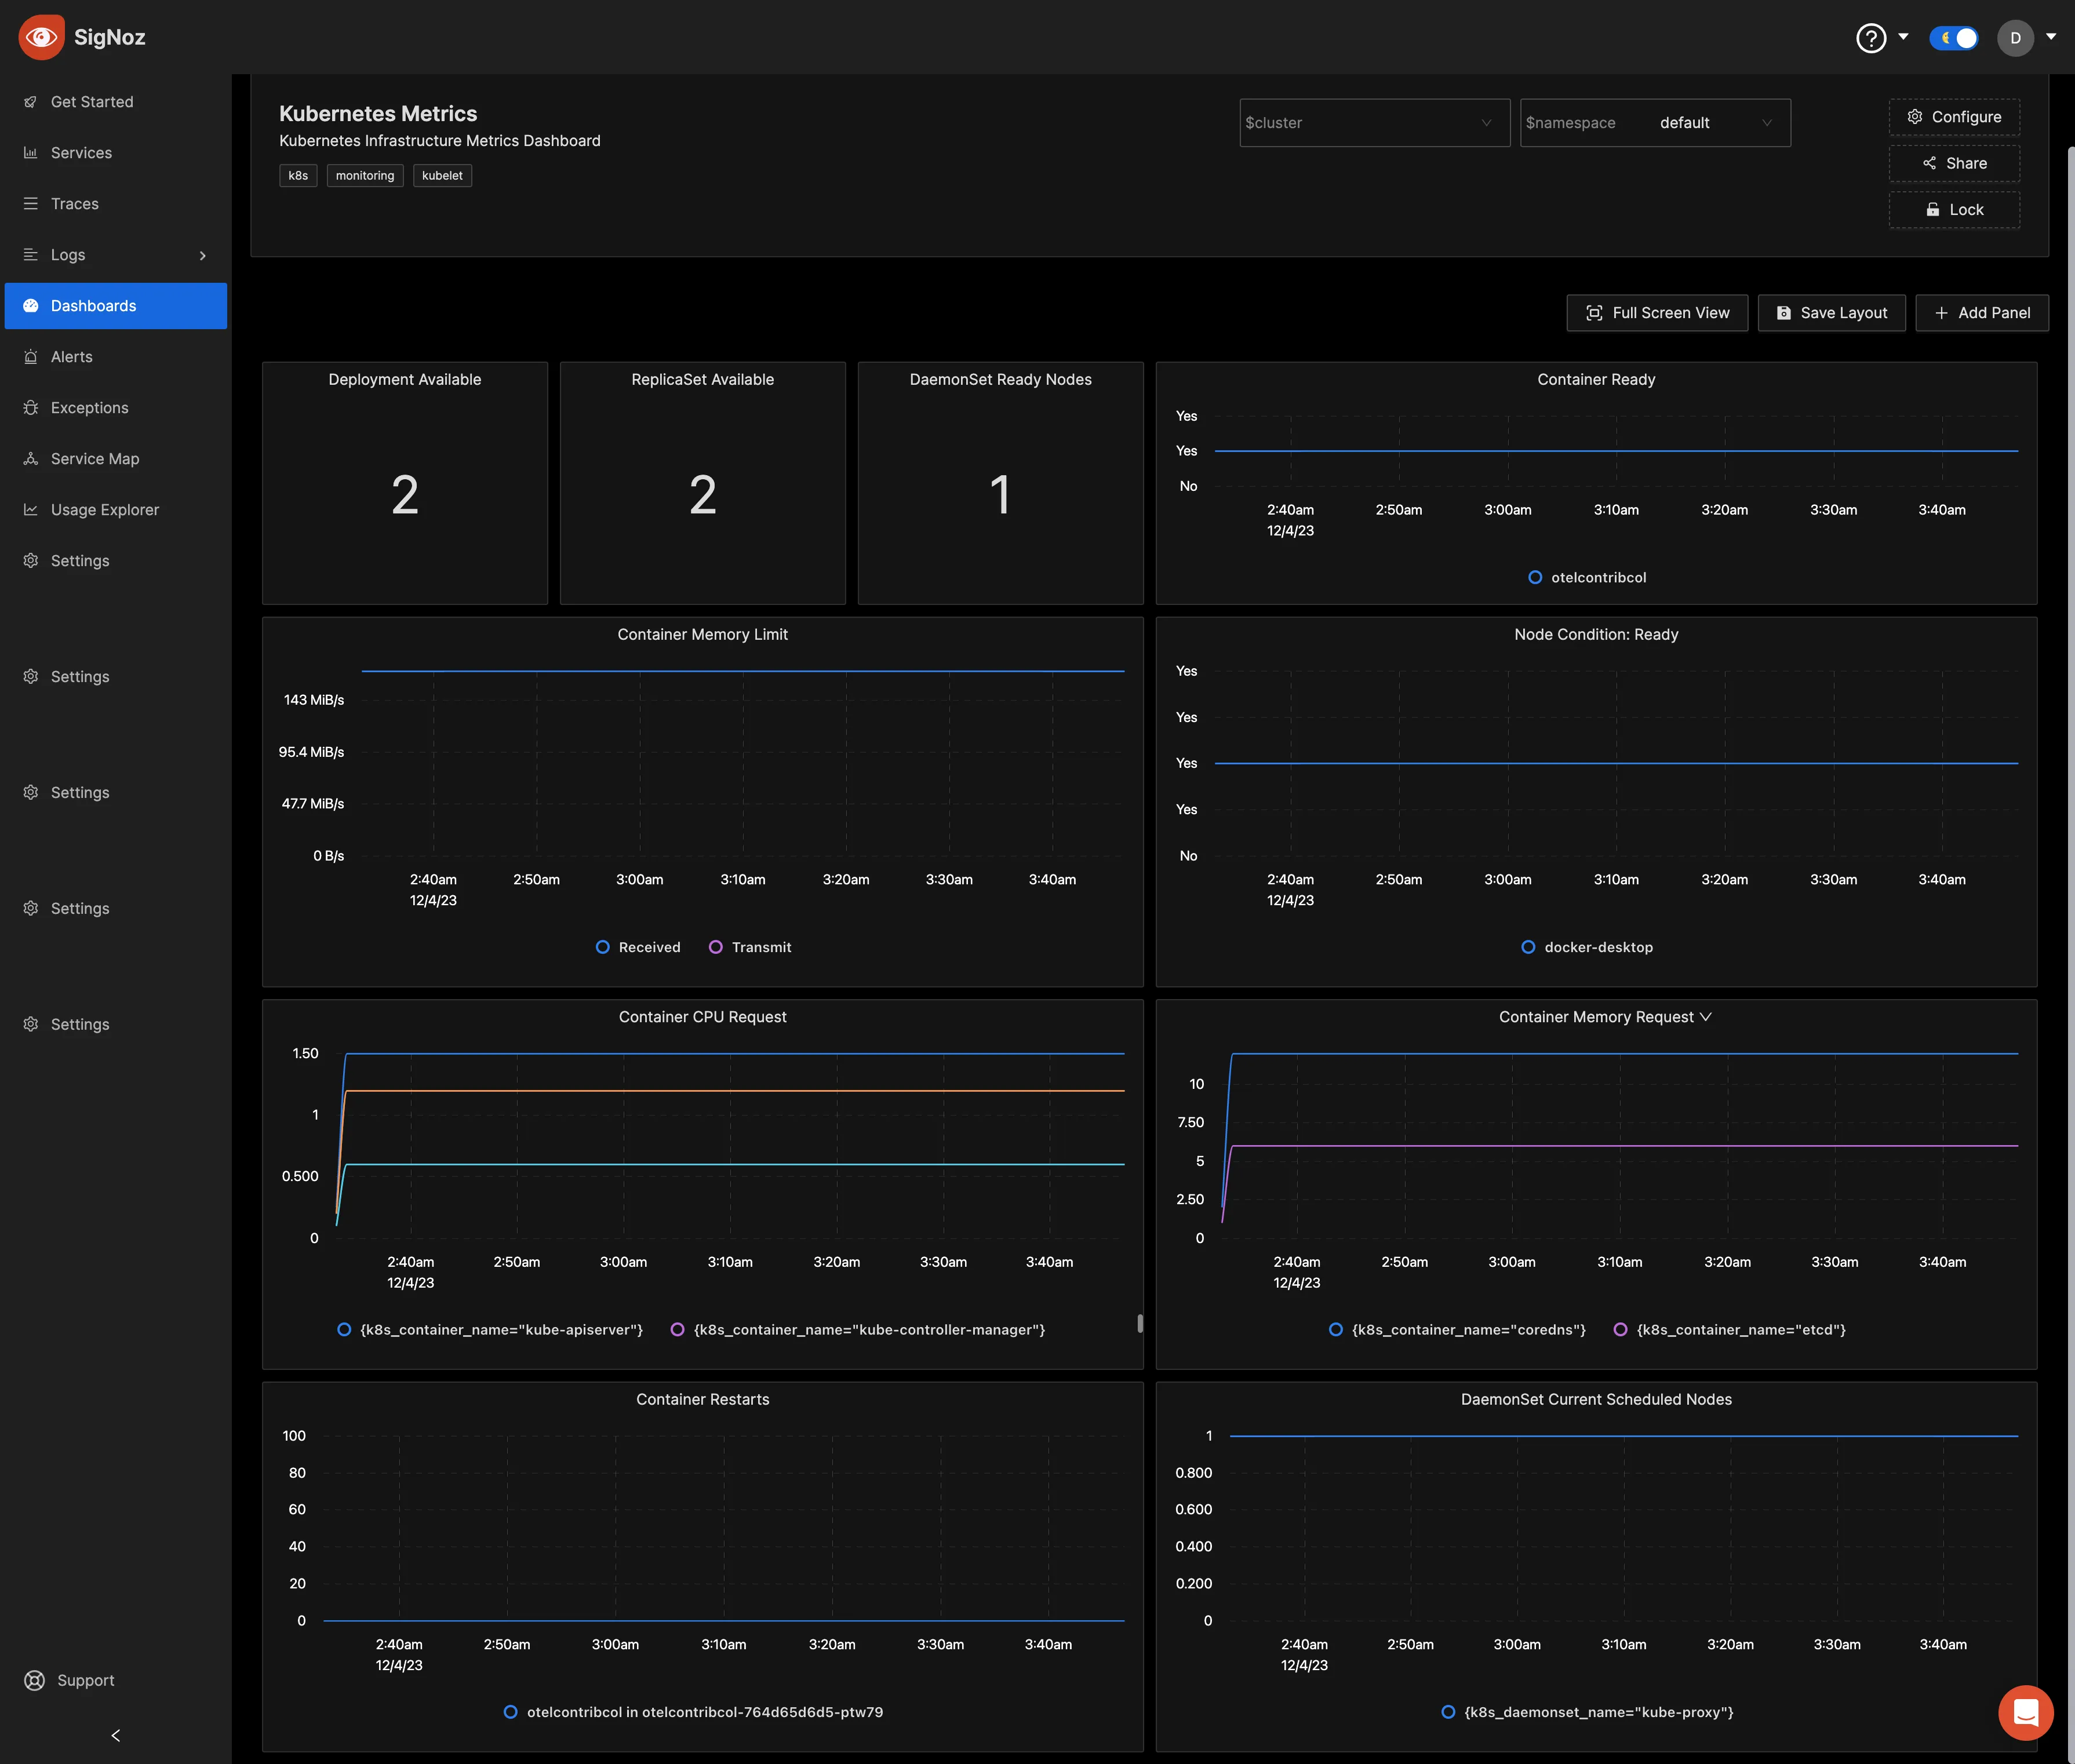
SigNoz is a full-stack open-source observability platform, built on OpenTelemetry, that provides comprehensive insights into the health, performance, and behavior of your Kubernetes environment, in a single pane of glass. It collects telemetry data from various components, including nodes, pods, containers, and services, and allows you to track key performance metrics for proactive resolution of resource constraints and performance bottlenecks.
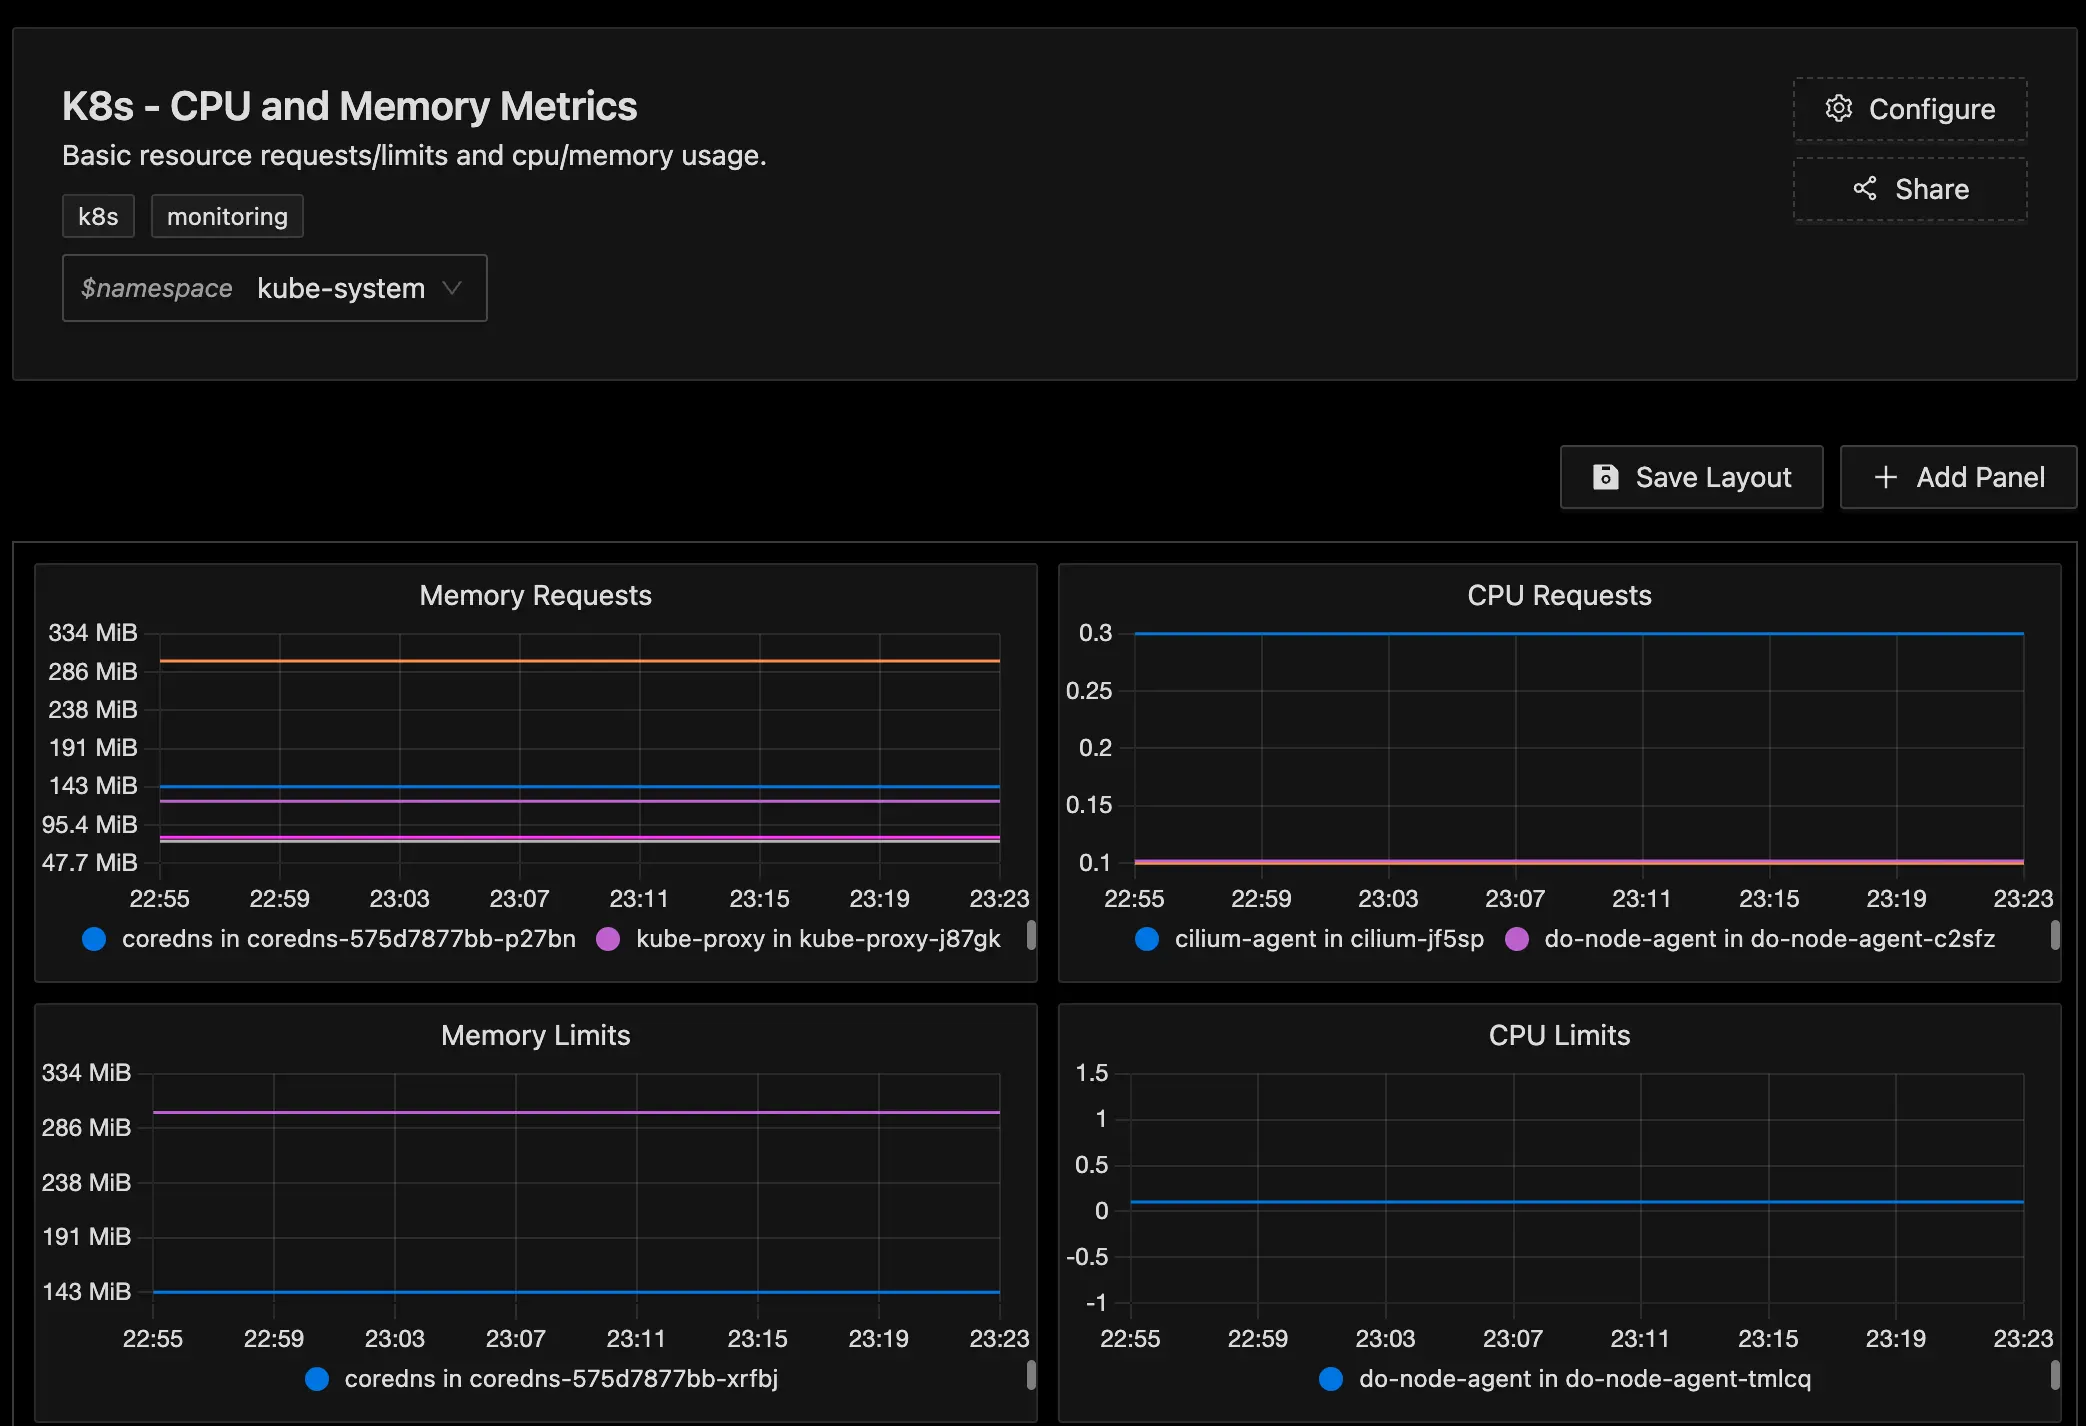
SigNoz provides distributed tracing capabilities, allowing you to identify root causes in your cluster. Its advanced log management capabilities let you aggregate, index, and analyze logs from all your services and pods in a centralized manner. You can also create custom dashboards to visualize metrics, traces, and logs in a way that makes sense for your team.
We have created a comprehensive guide on monitoring your Kubernetes clusters using SigNoz.

Getting Started with SigNoz
SigNoz Cloud is the easiest way to run SigNoz. Sign up for a free account and get 30 days of unlimited access to all features.
You can also install and self-host SigNoz yourself since it is open-source. With 24,000+ GitHub stars, open-source SigNoz is loved by developers. Find the instructions to self-host SigNoz.
