Docker Logging - Types, Configuring Drivers, Best Practices
Log analysis is a very powerful feature for an application when it comes to debugging and finding out which flow is working properly in the application and which is not. In a world of containerization and cloud computing, it is essential to understand logs generated by a Docker environment to maintain healthy performing applications.
In this article, we will discuss log analysis in Docker and how logging in Docker containers is different than in other applications. These logs are specific to Docker and are stored on the Docker host. We’ll thoroughly discuss the docker logs command and how we can configure a logging driver for containers.
What is Docker Logging and Why is it Important?
Docker logging refers to the process of capturing and storing log data generated by containers and the Docker engine itself. Unlike traditional logging methods, Docker logging must account for the ephemeral nature of containers, which can be created, destroyed, or moved between hosts rapidly.
Effective Docker logging addresses several key challenges:
- Visibility: Logs provide insights into container behavior and application performance.
- Troubleshooting: Detailed logs help identify and resolve issues quickly.
- Compliance: Proper logging is often necessary for regulatory requirements.
- Resource management: Logs can help track resource usage and optimize container deployments.
Why is Docker Logging Different?
Life would be much simpler if applications running inside containers always behaved correctly. But unfortunately, as every developer knows, that is never the case.
With other systems, recording application log messages can be done explicitly by writing those messages to the system logger. This is done using syslog() system call from our application. But this doesn’t work for containerized logging. Here’s why:
-
Containers are Multi-leveled
Containers are just like boxes inside a big box. No matter how simple the Docker installation is, we’ll have to deal with two levels of aggregation. One level is where you see logs inside the container in your Dockerized application, known as Docker Container Logs.
The second level is where you see the logs from the host servers (that is, system logs or Docker daemon logs). These are generally located in
/var/log.A log aggregator that has access to the host application can not pull log files from the Dockerized application as if they are the host log files. In these scenarios, we will have to find a way to correlate the logs.
-
Containers are ephemeral
Container-based environments change very often, but they don’t serve the monitor well. Docker containers emit logs to
stdoutandstderroutput streams.Logs are often stored on the Docker host because containers are stateless (failing to remember or save data from previous actions).
It is dangerous to store logs in a Docker host because Docker doesn’t impose any size limit on log files, and they can build up over time and eat into your disk space. It is advised to store logs in a centralized location and enable log rotation for all the Docker containers.
Types of Docker Logs
Docker generates various types of logs, each serving a specific purpose:
- Container logs: These capture the output from applications running inside containers.
- Docker daemon logs: System-level logs from the Docker engine itself.
- Docker service logs: Logs from Docker Swarm services in clustered environments.
- Build logs: Information generated during container image builds.
Understanding Container Logs
Docker Container Logs refer to the output generated by applications and processes running inside Docker containers. These logs are crucial for understanding the behavior and state of the containerized applications.
Container logs primarily consist of two output streams:
- STDOUT: Standard output for normal application messages.
- STDERR: Standard error for error messages and diagnostics.
These logs can be accessed using the docker logs [CONTAINER_ID or CONTAINER_NAME] command, which retrieves the logs for a specific container.
Docker captures these streams and manages them according to the configured logging driver. Structured logging—where log entries follow a consistent, parseable format—is particularly valuable in containerized environments. It enables easier log aggregation and analysis across multiple containers and services.
However, container logs have limitations:
- They are ephemeral and disappear when a container is removed.
- They can consume significant disk space if not properly managed.
- Access to logs may be lost if a container crashes or becomes unresponsive.
To address these issues, consider implementing a centralized logging solution or using volume mounts to persist logs externally.
Understanding Docker Daemon Logs
Docker Daemon Logs are generated by the Docker daemon (dockerd), the background service that manages Docker containers and handles Docker engine tasks.
These logs provide information about the operations performed by the Docker daemon, including details on container lifecycle events, system messages, errors, and warnings related to Docker engine operations.
Accessing Docker daemon logs depends on the host system and the way Docker is installed and configured.
Understand **How to Access and Understand Docker Daemon Logs in this blog.**
Using docker logs command
Container logs can be accessed using the docker logs command, followed by the container’s ID or name.
It is used to get all the information logged by a running container. The example below shows JSON logs created by the hello-world Docker image using json-file driver:
{"log":"Hello there!\\n","stream":"stdout","time":"2022-07-28T22:51:31.549390877Z"}
{"log":"This message shows that everything seems to be working correctly.\\n","stream":"stdout","time":"2022-07-28T22:51:31.549396749Z"}
The log follows a pattern of printing:
- Log’s origin
- Either
stdoutorstderr - A timestamp
In order to review a container’s logs from the command line, you can use the docker logs <container-id> command. Using this command, the logs shown above are displayed this way:
Hello there!
This message shows that everything seems to be working correctly.
Here are a few options in the command that you can use to modify the output of your log:
docker logs [OPTIONS] <container-id>
-
Using
for-followoption, if you want to follow the logs:docker logs <container_id> --follow -
If you want to see the last
Nlog lines:docker logs <container-id> --tail N -
If you want to see the specific logs, use the
grepcommand:docker logs <container_id> | grep pattern -
If you want to show errors:
docker logs <container_id> | grep -i error
Once an application starts growing, you tend to start using Docker Compose. docker compose logs command shows logs from all the services running in the containerized application.
One other command worth learning about is docker service logs command that is used in the context of Docker Swarm. This command retrieves logs from all the containers that are part of a given service in a Docker Swarm.
You can run the command as follows:
docker service logs [SERVICE_ID or SERVICE_NAME]
It aggregates and outputs the logs from all containers that are part of the specified service. This is particularly useful for getting a unified view of what's happening across multiple containers that are part of the same service, potentially spread across different nodes in the cluster.
he offering from the docker logs command may vary based on the Docker version you are using. In case of Docker Community, docker logs can only read logs created by the json-file, local, and journald drivers whereas in case of Docker Enterprise, docker logs can read logs created by any logging driver.

Configuring Logging Drivers in Docker
A logging driver can forward logs to a centralized log system and maintain a consistent logging approach across all containers.
Docker uses a pluggable logging architecture, allowing you to choose from various logging drivers to suit your needs. The default logging driver is json-file, which stores logs as JSON-formatted files on the host system.
Configuring logging drivers in Docker involves specifying which driver Docker should use for handling and forwarding container logs.
Docker supports various logging drivers, each of which allows logs to be routed to different destinations or handled in different ways.
Understanding Available Logging Drivers
Some common logging drivers include:
json-file: The default driver, storing logs in JSON files.syslog: Forwards logs to a syslog server.journald: Sends logs tosystemdjournal.
For configuring the logging driver, you can either set it up globally for the entire Docker daemon or individually for each container.
To check your current logging driver configuration, run:
docker info --format '{{.LoggingDriver}}'
Configuring the Logging Driver for a Single Container
To configure the logging driver for a single container at runtime, use the --log-driver option when running the docker run command. Additionally, you can specify driver-specific options with the --log-opt flag.
Example:
docker run --log-driver=syslog --log-opt syslog-address=udp://192.168.0.1:514 --log-opt syslog-facility=daemon my-app:latest
In this example, the container's logs are sent to a syslog server at 192.168.0.1 on port 514.
Configuring the Default Logging Driver for the Docker Daemon
To change the default logging driver for all containers managed by the Docker daemon:
Step 1. Edit the Docker Daemon Configuration:
- Locate the Docker daemon configuration file, typically found at
/etc/docker/daemon.jsonon Linux systems. - If the file doesn’t exist, create it.
Step 2. Specify the Logging Driver:
- Add or modify the
log-driverandlog-optskeys.
Example daemon.json with the syslog driver:
{
  "log-driver": "syslog",
  "log-opts": {
    "syslog-address": "udp://192.168.0.1:514",
    "syslog-facility": "daemon"
  }
}
Step 3. Restart the Docker Daemon:
- After making changes, restart the Docker daemon to apply them.
- On systems using
systemd, this can typically be done withsudo systemctl restart docker.
To find the current logging driver for the Docker daemon:
docker info --format '{{.LoggingDriver}}'

syslog
Popular Docker Logging Drivers
- json-file:
- Pros: Easy to use, human-readable format
- Cons: Can consume significant disk space, limited querying capabilities
- syslog:
- Pros: Integrates with system logging facilities, widely supported
- Cons: May require additional configuration for remote logging
- journald:
- Pros: Integrates well with systemd-based systems, supports structured logging
- Cons: Limited to systemd environments
- fluentd:
- Pros: Highly flexible, supports multiple output formats and destinations
- Cons: Requires setting up and maintaining a Fluentd infrastructure
Deciding the delivery mode of log messages from container to log driver
Docker provides two types of delivery modes for log messages.
-
Blocking(default mode)
As the name suggests, this mode blocks the main process inside a container to deliver log messages. And this will add latency to the performance of the application. But, it ensures that all the log messages will be successfully delivered to the log driver.The default log driver (
json-files) logs messages very quickly since it writes to the local file system. Therefore it’s unlikely to cause latency. But drivers likegcplogsandawslogsopen a connection to a remote server and are more likely to block and cause latency. -
Non-blocking
In this mode, the container writes logs to an in-memory ring buffer. This in-memory ring buffer works like a mediator between logging-driver and the container. When the logging-driver isn’t busy processing the logs, the container shares the logs to the driver immediately. But when the driver is busy, these logs are put into the ring-buffer.This provides you a safety check that a high volume of logging activity won’t affect the application’s performance running inside the container. But there is a downside. It doesn’t guarantee that all the log messages will be delivered to the logging driver. In cases where log broadcasts are faster than the driver processor, the ring buffer will soon run out of space. As a result, buffered logs are deleted to make space for the next set of incoming logs. The default value for
max-buffer-sizeis 1 MB.To change the mode, edit the
daemon.jsonfile at/etc/docker/daemon.json:{ "log-driver": "json-file", "log-opts": { "max-size": "20m", "max-file": "10", "mode": "non-blocking" } }Alternatively, you can set the non-blocking mode on an individual container by using the
--log-optoption in the command that creates the container:docker run --log-opt mode=non-blocking alpine echo hello world
The default log driver stores data in a local file, but if you want more features, then you can opt for other log drivers as well, such as logagent, syslog, journald, elf, awslogs, etc.
Logging strategies
Docker logging means logging events of the dockerized application, host OS and the docker service. There are various ways to log events for a docker container.
Some of them are:
- Application logging: In this strategy, the application inside the container can have its own logging framework. The logs can either be stored locally or sent to a centralized location using a log management tool.
- Data volumes: Because containers are stateless, and to avoid losing logs data, you can bind the container’s directory to the host OS directory. Containers can now be terminated or shut down, and access logs from multiple containers. You can run a regular backup in order to prevent data corruption or loss in case of failure.
- Docker logging driver: This type has already been discussed in detail. The configured driver reads the data broadcast by the container’s
stdoutorstderrstreams and writes it to a file on the host machine. You can then send this log data anywhere you want to. - Sidecar pattern: The sidecar pattern involves running a separate container alongside the main application container. This container performs a specific function, such as logging, monitoring, or caching. This approach allows for better separation of concerns, where each container has a single responsibility.
- Dedicated logging containers: This strategy is similar to the sidecar pattern, but instead of having a dedicated logging container for each application, you have a pool of logging containers serving multiple applications. This approach can be more resource-efficient than the single sidecar per application approach.
- Centralized Logging: This involves aggregating logs from multiple sources (containers, hosts, services) into a single, unified logging system. This makes it easier to search, analyze, and monitor logs.
Choosing the Right Logging Strategy
Selecting the appropriate logging strategy for your Dockerized applications is necessary for effective monitoring, debugging, and maintenance. The best logging strategy will depend on several factors, including the scale of your deployment, the complexity of your applications, the infrastructure, and your specific logging requirements. Here's a general guide to help you choose:
- If isolating log data from your application is your concern, the sidecar approach is well-suited.
- Use dedicated logging containers for scenarios where portability, resource efficiency, and scalability are priorities.
- If you need to integrate your log data with existing logging solutions or send logs to remote storage or analysis services, using a logging driver can streamline this process.
- For large and dynamic environments with numerous containers and services, a centralized logging solution is the best option.
- To ensure log data persistence across container restarts and failures, use data volumes.
- For applications with specific, complex logging requirements, use the application logging strategy.
- If you require advanced log management features, analysis tools, and alerting capabilities, a centralized logging solution is an excellent choice.
Best Practices for Docker Logging
Implement these best practices to optimize your Docker logging strategy:
- Log rotation: Configure log rotation to manage storage and prevent disk space issues:
{
  "log-driver": "json-file",
  "log-opts": {
    "max-size": "10m",
    "max-file": "3"
  }
}
- Use labels and tags: Add metadata to your logs for better organization and filtering:
docker run --log-opt labels=app_name --log-opt tag="{{.Name}}" your-image
- Centralize logs: Implement a centralized logging solution for multi-container applications to simplify log management and analysis.
- Proper timestamp handling: Ensure containers use the correct timezone and generate consistent timestamps for accurate log correlation.
Optimizing Log Performance
To maintain optimal performance while logging:
- Configure appropriate log sizes and limits to prevent excessive disk I/O.
- Choose between blocking and non-blocking log delivery modes based on your application's requirements and tolerance for potential log loss.
- Implement efficient log parsing and filtering techniques to reduce the processing overhead of log analysis.
- Balance logging verbosity with system performance — log what's necessary, but avoid excessive logging that could impact application performance.
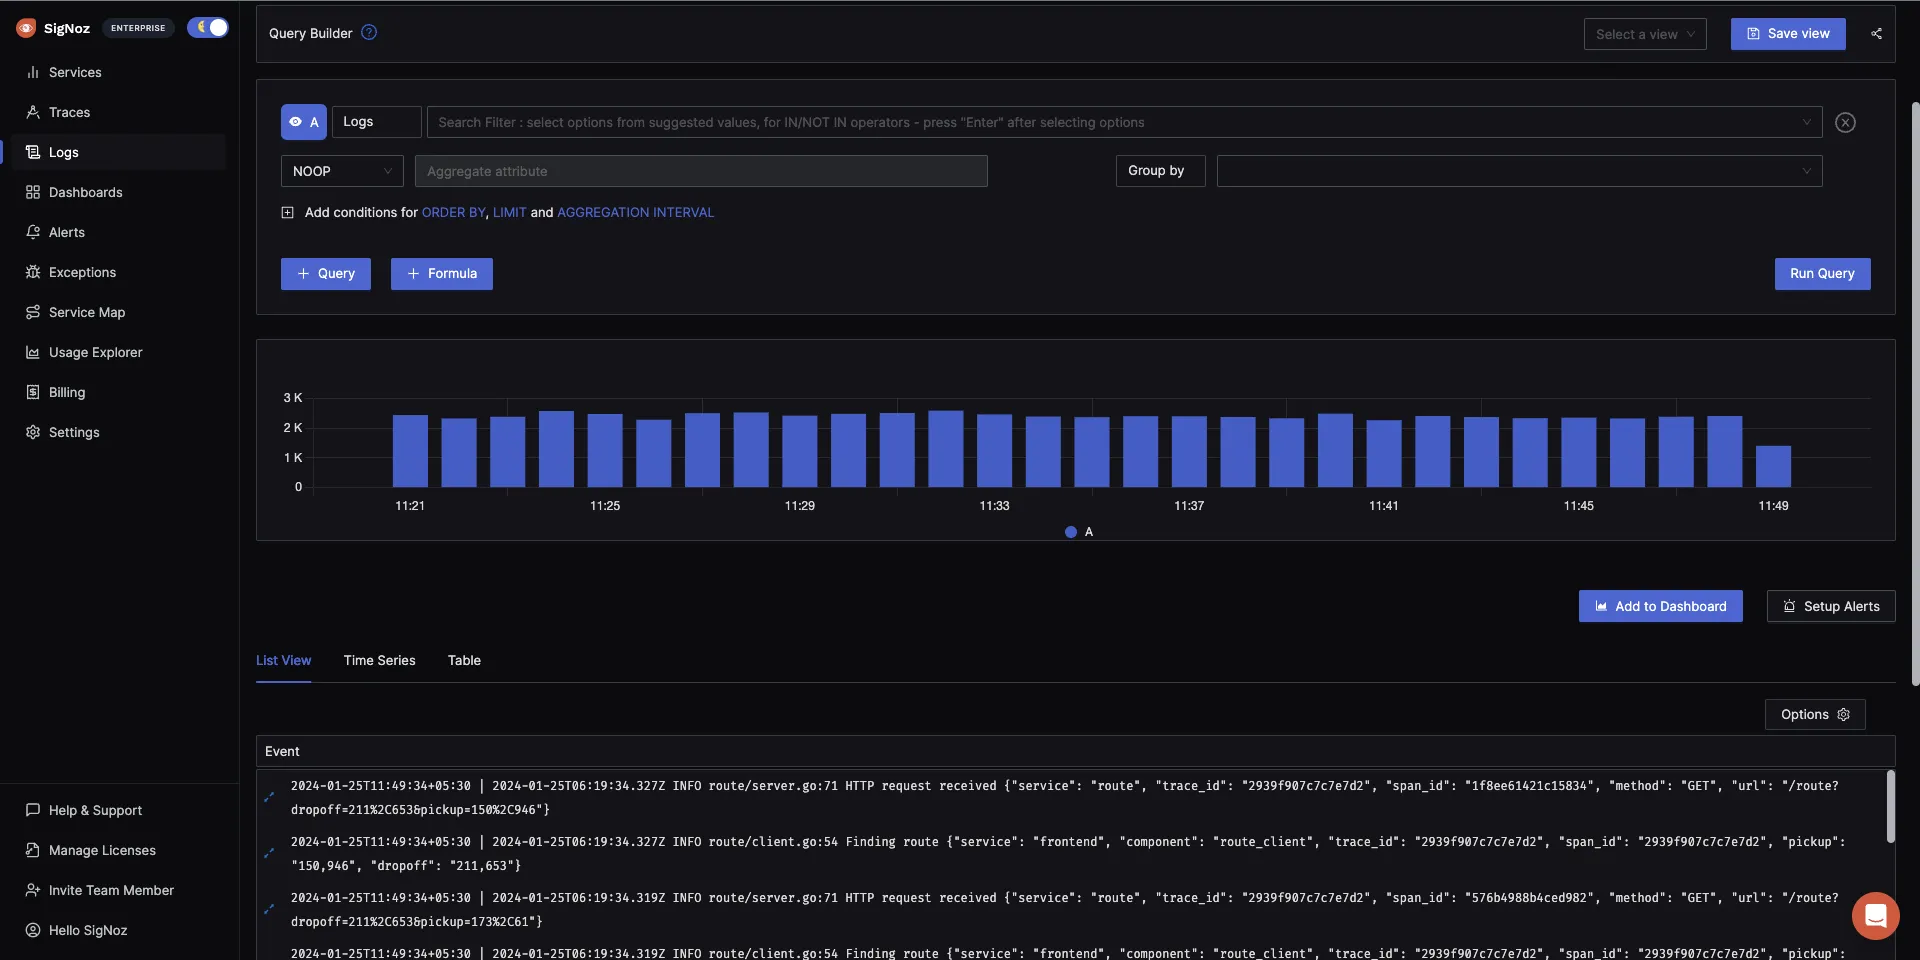
Monitoring and Analyzing Docker Logs with SigNoz
SigNoz offers a comprehensive solution for Docker log management and analysis. It provides:
- Real-time log aggregation and visualization
- Powerful querying and filtering capabilities
- Integration with metrics and traces for full observability
Getting Started
SigNoz Cloud is the easiest way to run SigNoz. Sign up for a free account and get 30 days of unlimited access to all features.

You can also install and self-host SigNoz yourself since it is open-source. With 24,000+ GitHub stars, open-source SigNoz is loved by developers. Find the instructions to self-host SigNoz.
Learn how to monitor Docker Logs with SigNoz in the official documentation.
Troubleshooting Common Docker Logging Issues
Here are solutions to common Docker logging problems:
- "Configured logging driver does not support reading" error:
- This occurs when trying to use
docker logswith a driver that doesn't support it. Switch to a compatible driver or use alternative log access methods.
- This occurs when trying to use
- Missing or incomplete logs:
- Check log driver configuration and ensure containers have the necessary permissions to write logs.
- Verify that log storage hasn't reached its limit.
- Log-related performance bottlenecks:
- Implement log rotation and size limits.
- Consider using a non-blocking logging mode for performance-critical applications.
- Log storage and retention in long-running containers:
- Use external volume mounts for log persistence.
- Implement automated log archiving and cleanup processes.
Final Thoughts
Containerization surely provides an easy way to deal with application portability and scalability issues but it does requires maintenance from time to time. Container environments are just like a box inside a box, with multiple layers of abstraction. So, it becomes hard to debug in such environments and if performed correctly, log-analysis can be your go-to friend to find out performance related issues.
In this guide, you learned how to configure the Docker logging driver for log analysis in containerized applications, how Docker logging is different from application logging hosted on a physical machine or virtual host, and in detail study of the docker logs command.
There are various logging strategies that you can follow for log analysis. This blog thoroughly discussed the default logging strategy - json-file and the two delivery modes of log messages. Containers being stateless, doesn’t ensure data persistence, hence to prevent data loss, you can use a log management tool. SigNoz - an open source APM and observability tool provides an efficient log management solution.
SigNoz uses a columnar database - ClickHouse, for storing logs efficiently. Big companies like Uber and Cloudflare have shifted from Elasticsearch to ClickHouse for storing their log data.
Getting started with SigNoz
SigNoz Cloud is the easiest way to run SigNoz. Sign up for a free account and get 30 days of unlimited access to all features.
You can also install and self-host SigNoz yourself since it is open-source. With 24,000+ GitHub stars, open-source SigNoz is loved by developers. Find the instructions to self-host SigNoz.
But logs are just one aspect of getting insights from your software systems. Modern applications are complex distributed systems. For debugging performance issues, you need to make your systems observable. Logs, when combined with metrics and traces form an observability dataset that can help you debug performance issues quickly.
SigNoz can help you monitor your application by collecting all types of telemetry data. It correlates all your telemetry data(logs, metrics, and traces) into a single suite of monitoring. It is built to support OpenTelemetry natively. OpenTelemetry is becoming the world standard for instrumenting cloud-native applications.
You can check out SigNoz GitHub repo:
If you want to read more about SigNoz, check out the following blog:
SigNoz - an open source alternative to DataDog
SigNoz uses OpenTelemetry to generate and collect telemetry data like logs. Read more about OpenTelemetry logs here.
FAQs
How do I view Docker container logs?
Use the docker logs command followed by the container ID or name:
docker logs <container_id_or_name>
Can I change the logging driver for a running container?
No, you cannot change the logging driver for a running container. You must stop the container and recreate it with the new logging configuration.
What's the difference between blocking and non-blocking log delivery modes?
Blocking mode ensures all logs are delivered but may impact application performance. Non-blocking mode prioritizes performance but risks losing logs if the logging system can't keep up.
How can I implement log rotation in Docker?
Configure log rotation using the max-size and max-file options in your Docker daemon configuration or when running a container:
docker run --log-opt max-size=10m --log-opt max-file=3 your-image
This setup rotates logs when they reach 10MB and keeps a maximum of 3 log files.
What is Docker logging and why is it important?
Docker logging is the process of capturing and storing log data generated by containers and the Docker engine. It's important because it provides visibility into container behavior, helps with troubleshooting, ensures compliance, and aids in resource management.
How is Docker logging different from traditional logging?
Docker logging is different because containers are multi-leveled and ephemeral. There are two levels of aggregation: Docker Container Logs and system logs. Containers are stateless, so logs are often stored on the Docker host, which can lead to disk space issues if not managed properly.
What are the main types of Docker logs?
The main types of Docker logs are:
- Container logs: Output from applications running inside containers
- Docker daemon logs: System-level logs from the Docker engine itself
- Docker service logs: Logs from Docker Swarm services in clustered environments
- Build logs: Information generated during container image builds
How can I view Docker container logs?
You can view Docker container logs using the docker logs command followed by the container ID or name. For example: docker logs <container_id_or_name>.
What are some popular Docker logging drivers?
Some popular Docker logging drivers include:
- json-file: The default driver, storing logs in JSON files
- syslog: Forwards logs to a syslog server
- journald: Sends logs to systemd journal
- fluentd: A flexible driver that supports multiple output formats and destinations
What are the best practices for Docker logging?
Some best practices for Docker logging include:
- Implementing log rotation to manage storage
- Using labels and tags for better organization and filtering
- Centralizing logs for multi-container applications
- Ensuring proper timestamp handling
- Optimizing log performance by configuring appropriate log sizes and limits
How can I troubleshoot common Docker logging issues?
To troubleshoot common Docker logging issues:
- For "Configured logging driver does not support reading" error, switch to a compatible driver
- For missing or incomplete logs, check log driver configuration and permissions
- For performance bottlenecks, implement log rotation and consider non-blocking logging mode
- For log storage in long-running containers, use external volume mounts and implement automated archiving
