Jaeger vs Prometheus - Side by Side Comparison [Updated for 2026]
Both Jaeger and Prometheus are popular open-source application performance monitoring tools. While Jaeger is an end-to-end distributed tracing tool, Prometheus is used as a time-series database for monitoring metrics. Let's dive in to explore their key features and differences.
Application performance monitoring is the key to keep your system's health in check. In today's digital economy, no business can afford to have failed or delayed completion of user requests. Latencies of a few milliseconds can lead to lost business opportunities running in millions. Distributed tracing and metrics monitoring are both important for setting up a robust monitoring framework for your application.
Jaeger and Prometheus are both popular open-source projects under Cloud Native Computing Foundation. While Jaeger is focused on providing distributed tracing for microservice architecture, Prometheus is famous as time-series metrics monitoring tool.
Distributed tracing gives you insights into how user requests are performing across different services. Metrics provide insights into the behavior and health of your systems, especially when analyzed in aggregate. Metrics can be of any type, like host-based metrics, application metrics, and network and connectivity metrics.
Now that you understand a little bit about distributed tracing and metrics monitoring let us look at the features of Jaeger and Prometheus in detail.
Key features of Jaeger
Jaeger was originally built by teams at Uber and then open-sourced. It is used for end-to-end distributed tracing for microservices. Some of the key features of Jaeger includes:
-
Distributed context propagation
One of the challenges of distributed systems is to have a standard format for passing context across process boundaries and services. Jaeger provides client libraries that support code instrumentation in multiple languages to propagate context across services -
Distributed transaction monitoring
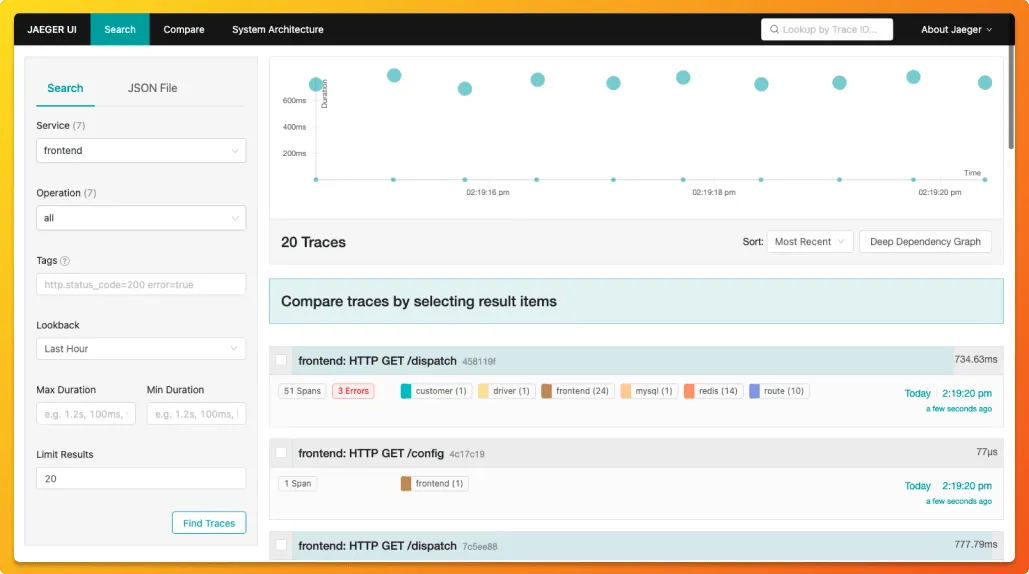
Jaeger comes with a web UI written in Javascript. The dashboard can be used to see traces and spans across services. -
Root Cause Analysis
Using traces you can drill down to services causing latency in particular user request. -
Server dependency analysis
Using Jaeger's web UI, you can see how requests flow through different services and different servers interact while serving user requests. -
Performance/latency optimization
Once you have identified, which service or query is creating latency, you can use the information to optimize it.
Key features of Prometheus
Prometheus was initially developed at SoundCloud in 2012 before being released as an open-source project. It got accepted into the CloudNative Computing Foundation in 2016 and was the second project to graduate from the foundation, following Kubernetes.
Prometheus enables you to capture time-series data as metrics. These metrics can be aggregated to give insights into the behavior of our systems. Some of the key features of Prometheus includes:
-
Multi-dimensional data model
Prometheus stores data as time-series. For example, it can store time-stamped values of the total number of HTTP requests received. You can also store an optional set of key-value pairs called labels for that metric. The multi-dimensional data model enables rich contextual metrics monitoring. Notation of time-series metrics:<metric name>{<label name>=<label value>, ...} -
Flexible query language
Prometheus provides a query language called PromQL. Using PromQL, you can filter and aggregate metrics data in real-time. -
Pull model data collection
In contrast to most APM tools, Prometheus data collection is pull-based. It requires you to run an HTTP server that exposes Prometheus metrics. -
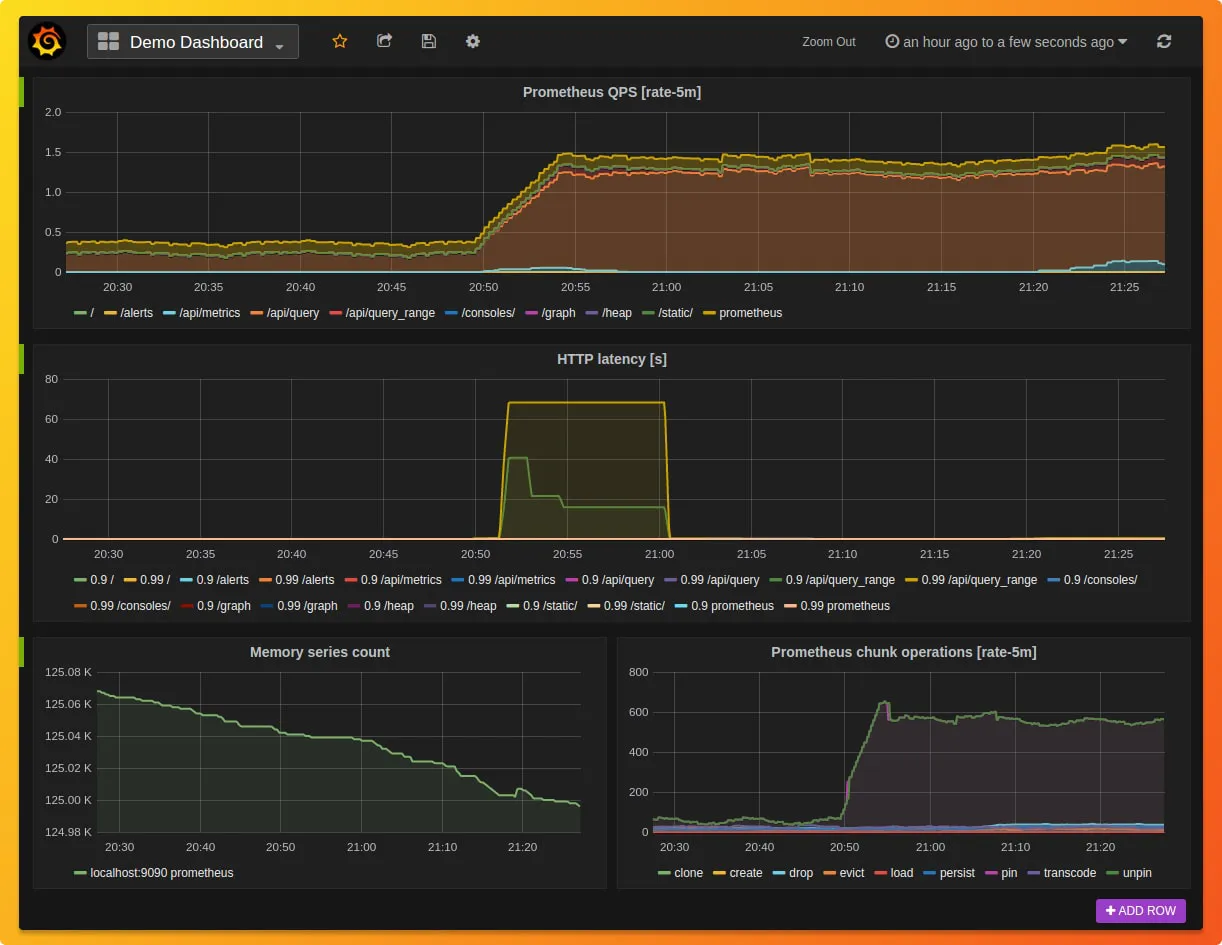
Graphing and dashboarding support
For visualization, Prometheus has three options: Prometheus Expression Browser, Grafana, and Prometheus Console Templates. Grafana is a popular data visualization tool, and it supports querying Prometheus. Although it requires time and effort to set up custom Prometheus metrics with Grafana, it can give you some solid visualization.
Comparing Jaeger and Prometheus
Getting Started
Prometheus:
Easily installed in clusters using Helm charts or precompiled binaries from GitHub releases.
Jaeger:
Requires a more intricate setup involving clients, agents, and collectors. Application code may need refactoring to generate traces.
Features
Prometheus:
- Uses a multi-dimensional data model with time series identified by key-value pairs.
- Offers a flexible query language, PromQL, for data analysis.
- Provides a pull-based data collection model, scraping metrics from HTTP endpoints.
- Integrates with Grafana for enhanced data visualization.
Jaeger:
- Focuses on distributed context propagation, allowing for the tracking of user requests across different services.
- Offers a web UI for visualizing traces, spans, and service dependencies.
- Enables root cause analysis by drilling down into services causing latency.
- Supports performance and latency optimization.
Ease of Use
Prometheus:
- Relatively straightforward to set up for basic monitoring.
- Offers limited visualization capabilities in its native web UI. However, integration with Grafana provides richer insights.
Jaeger:
- More complex due to its architecture involving multiple components.
- Provides a comprehensive web UI with trace data visualization and service dependency diagrams out of the box.
Datastore
Prometheus:
Uses a local on-disk time-series database without support for pluggable databases.
Jaeger:
Offers pluggable storage backends, including Cassandra and Elasticsearch.
When to Use Which?
While both tools are invaluable in the monitoring space, their applications differ. Prometheus excels at monitoring metrics like resource usage, making it ideal for tracking system health. Jaeger, on the other hand, is tailored for distributed tracing, making it perfect for understanding user requests across microservices.
For a holistic monitoring framework, integrating both tools can be beneficial. Prometheus can detect infrastructure anomalies, while Jaeger can help pinpoint application-level issues.
Summarizing the key differences between Jaeger and Prometheus:
-
Jaeger is an end-to-end distributed tracing tool used to track user requests across services in microservice architecture. On the other hand, Prometheus is a time-series metrics monitoring tool used to track metrics like resource usage.
-
Jaeger has push-based data collection where trace data is sent to collectors, while Prometheus has a pull-based data collection model where it scrapes endpoints exposing Prometheus metrics.
-
Jaeger's web UI comes with out of box trace data visualization and service dependency diagrams. Prometheus out of box web UI is limited. You need to set up custom visualization with Grafana for better insights.
-
Jaeger supports pluggable storage backends for trace data. Cassandra and Elasticsearch are the primarily supported storage backends by Jaeger. Prometheus includes a local on-disk time-series database, but it does not provide any pluggable database.
-
Jaeger has a scalable architecture by design. On the other hand, Prometheus is designed for a single machine. It cannot be scaled horizontally. --> */}
The issue with both tools is that they are limited to particular use-cases of distributed tracing and metrics monitoring. But for a robust monitoring framework, you need both metrics and traces. Engineering teams need to resolve issues fast, and they need access to a unified view of metrics and traces. That's where SigNoz comes into the picture.
Alternative to Jaeger and Prometheus - SigNoz
SigNoz is a full-stack open-source application performance monitoring and observability tool which can be used in place of Jaeger and Prometheus. It provides logs, metrics, and traces under a single pane of glass.
SigNoz is built to support OpenTelemetry natively. OpenTelemetry is becoming the world standard for generating and managing telemetry data (Logs, metrics and traces). It provides a fast OLAP datastore, ClickHouse as the storage backend.
SigNoz comes with out of box visualization of things like RED metrics.

SigNoz UI showing application overview metrics like RPS, 50th/90th/99th Percentile latencies, and Error Rate
You can also use flamegraphs to visualize spans from your trace data. All of this comes out of the box with SigNoz.

Some of the things SigNoz can help you track:
- Application overview metrics like RPS, 50th/90th/99th Percentile latencies, and Error Rate
- Slowest endpoints in your application
- See exact request trace to figure out issues in downstream services, slow DB queries, call to 3rd party services like payment gateways, etc
- Filter traces by service name, operation, latency, error, tags/annotations.
- Run aggregates on trace data
- Unified UI for both metrics and traces
Getting started with SigNoz
SigNoz Cloud is the easiest way to run SigNoz. Sign up for a free account and get 30 days of unlimited access to all features.

You can also install and self-host SigNoz yourself since it is open-source. With 24,000+ GitHub stars, open-source SigNoz is loved by developers. Find the instructions to self-host SigNoz.
Related Content
Jaeger vs ELastic APM
Jaeger vs SigNoz
Jaeger vs Zipkin
DataDog vs Prometheus
