Bringing Observability to your n8n Workflows: OpenTelemetry in Action
n8n has become a major workflow automation platform for teams that want powerful automation with the speed of a visual builder. It’s used to automate various use cases like moving data between services, replacing manual ops work, or chaining together multiple API calls into a single workflow. However, as your workflows grow in number and complexity, a silent problem starts to emerge. You have no real visibility into what's actually happening during executions.
A workflow failed. Did something go wrong with the third party API? Or did a node time out? In n8n Cloud, the built in execution logs give you a starting point, but they’re not good for deeper monitoring and debugging. You're stuck clicking through the execution view, reading output manually, with no timing data and no way to spot patterns.
In this blog, we'll walk through how to wire your n8n Cloud workflows with OpenTelemetry and export that telemetry to SigNoz, giving you traces, node level timing, error information, and a dashboard that helps you visualize these trends. By the end, you'll have an observability setup running to give you insight on all your n8n workflow executions.
Your n8n Workflows Are a Black Box
When a n8n workflow breaks in production, your first instinct is to open the execution logs and figure out what happened. And for simple cases like a single node failing with a clear error message, that works fine. But real workflows are rarely that simple.
The more your automations grow, the harder it gets. You might have a workflow with 15 nodes, conditional branches, retries, and calls to three different external APIs. When something goes wrong, the n8n execution view shows you the output of each node, but it doesn't tell you how long each one took, which node was the bottleneck, or whether that failure is part of a larger pattern you should be worried about. There's no way to ask deeper questions like "how many executions of this workflow failed this week?" without manually clicking through them one by one.
The workflows are running but you just can't see inside them in any meaningful way. You can't set alerts when error rates spike. You can't track p95 execution times over time. All of that requires structured telemetry, which n8n Cloud simply doesn't provide.
n8n exposes an API that gives you full execution data: status, timing, node level details, and error information. We’re able to achieve n8n workflow monitoring using that API combined with OpenTelemetry.
OpenTelemetry and SigNoz: The Open Source Observability Stack
What is OpenTelemetry?
OpenTelemetry (OTel) is an open source observability framework for collecting telemetry data(traces, metrics, and logs) from across your stack. It's a CNCF project, widely adopted, and built with flexibility in mind. All you have to do is instrument once, and your telemetry can flow to any compatible backend. No more vendor lock-in and complicated integrations.
For n8n, this means we can capture execution signals at a granular level. Every workflow run, every node execution, every error and retry can be traced and exported via OpenTelemetry. Instead of your workflows being a black box, you get visibility into things like how long each node took, which workflows are failing, and where your execution time is actually going. Overall, setting up OpenTelemetry is the best move for serious monitoring since the native n8n execution logs get pretty heavy to sift through.
What is SigNoz?
SigNoz is an all in one observability platform that natively integrates with OpenTelemetry. It stores your telemetry, lets you query it, and gives you dashboards, traces, and alerts all in one place. You can visualize traces in real time, filter by workflow or node, and set alerts when things go wrong.
In our case, that means building a dashboard that tracks:
- Workflow error rate and node error rate
- Execution duration over time
- Workflow success vs. error breakdown
- Node type distribution across your workflows
- A live feed of recent executions with their status and duration
By combining OpenTelemetry's standardized data collection with SigNoz's visualization and alerting, you get a complete observability stack for n8n Cloud.
Setting Up the Monitoring Service
The instrumentation lives entirely outside n8n, and doesn’t make any changes to your instance. It’s a lightweight Python service that polls your n8n Cloud instance via the n8n API, fetches executions, and converts them into OpenTelemetry spans: one parent span per workflow execution, and child spans for each individual node. Those spans then get shipped to SigNoz over OTLP. The whole thing runs off a single Docker Compose file.
While we cover the configuration in detail here, you can also refer to our n8n monitoring docs if needed.
Step 1: Clone the repo and configure your environment
Clone the n8n-opentelemetry repository and copy the example environment file. You'll need to fill in four values: your n8n instance URL, your n8n API key, your SigNoz OTLP endpoint, and your SigNoz ingestion key. Everything you need to find these is in the README.
Step 2: Run the service
With your .env configured, spin up the service with Docker Compose. The poller will start running immediately, polling your n8n instance every 60 seconds by default. You can adjust that interval in your environment config depending on how frequently your workflows run.
Step 3: Verify traces are flowing
Head to SigNoz and open the Traces view. Within a minute or two of your next workflow execution, you should see your n8n execution traces appear. Click into it and you'll see node level spans nested inside.
And just like that, you have full visibility into your n8n workflows without touching a single workflow.
What Data Are We Actually Capturing?
Each workflow execution is represented with a structured trace with enough detail to reconstruct exactly what happened, in what order, and how long each step took.
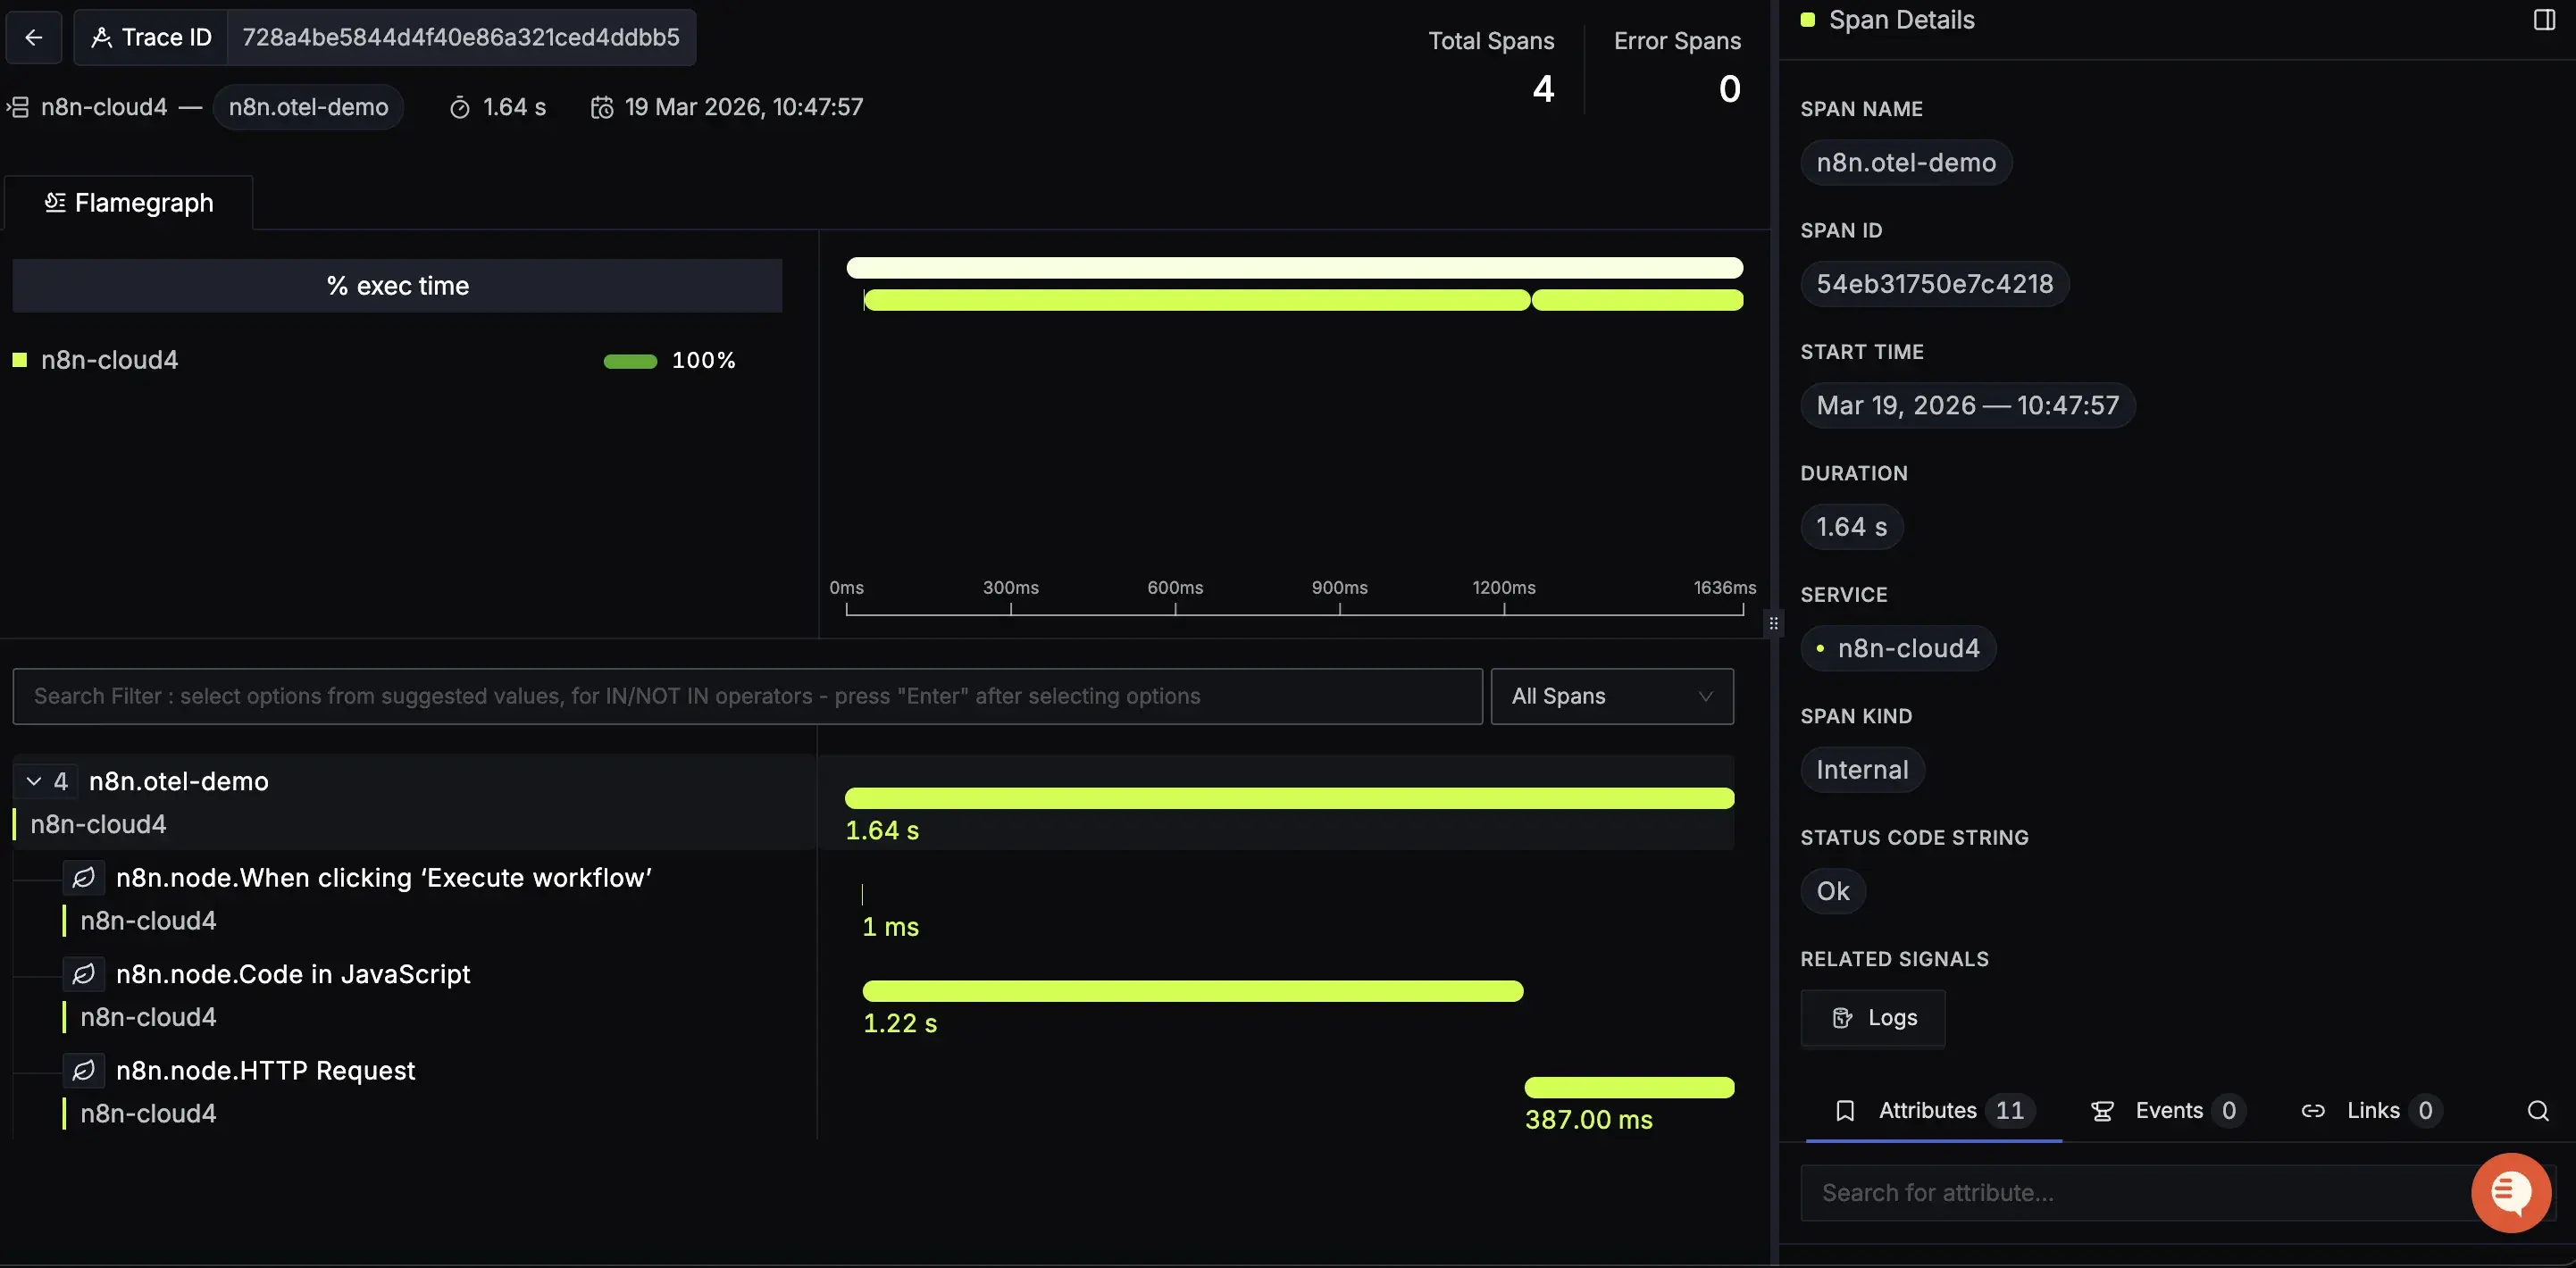
Traces and Spans
Every workflow execution becomes a trace in SigNoz. At the top level, you get a parent span named n8n.{workflow_name} that represents the entire execution from start to finish. Nested inside that are child spans, one per node, named n8n.node.{node_name}. This gives you a full timeline of the execution: which nodes ran, in what order, and how long each one took.
If a workflow has a long execution time, you can open the trace and immediately see which node was responsible. You don’t have to guess and click through output manually.
Attributes
Each span carries a set of attributes that give you the full context of what happened. At the workflow level:
n8n.execution.id- the unique ID of the executionn8n.execution.status- success, error, or canceledn8n.execution.mode- how it was triggered: manual, webhook, scheduledn8n.workflow.idandn8n.workflow.name- which workflow rann8n.execution.error.messageandn8n.execution.error.node- populated when something fails
At the node level:
n8n.node.nameandn8n.node.type- what the node isn8n.node.duration_ms- how long that specific node tookn8n.node.status- whether it succeeded or failedn8n.node.source- which node triggered this one
These attributes are what make the data queryable. In SigNoz, you can filter traces by any of these: show me all executions of my-email-sync workflow that failed in the last 24 hours, or show me every HTTP Request node that took over 2 seconds.
Error Tracking
When a workflow fails, the parent span is marked with an error status and the n8n.execution.error.message and n8n.execution.error.node attributes are populated. This means errors surface automatically in SigNoz without any extra configuration. They show up in the error rate panels, the errors list, and are filterable across all your traces.
Most of the frustration with debugging n8n workflows comes down to not having this data in a queryable form. Now you do and that elevates your options when something goes wrong.
Turning Telemetry into Insights
With traces flowing into SigNoz, the next step is making sense of them. The dashboard included in this repo gives you a starting point. It contains a set of panels built directly on top of the telemetry data we just covered.
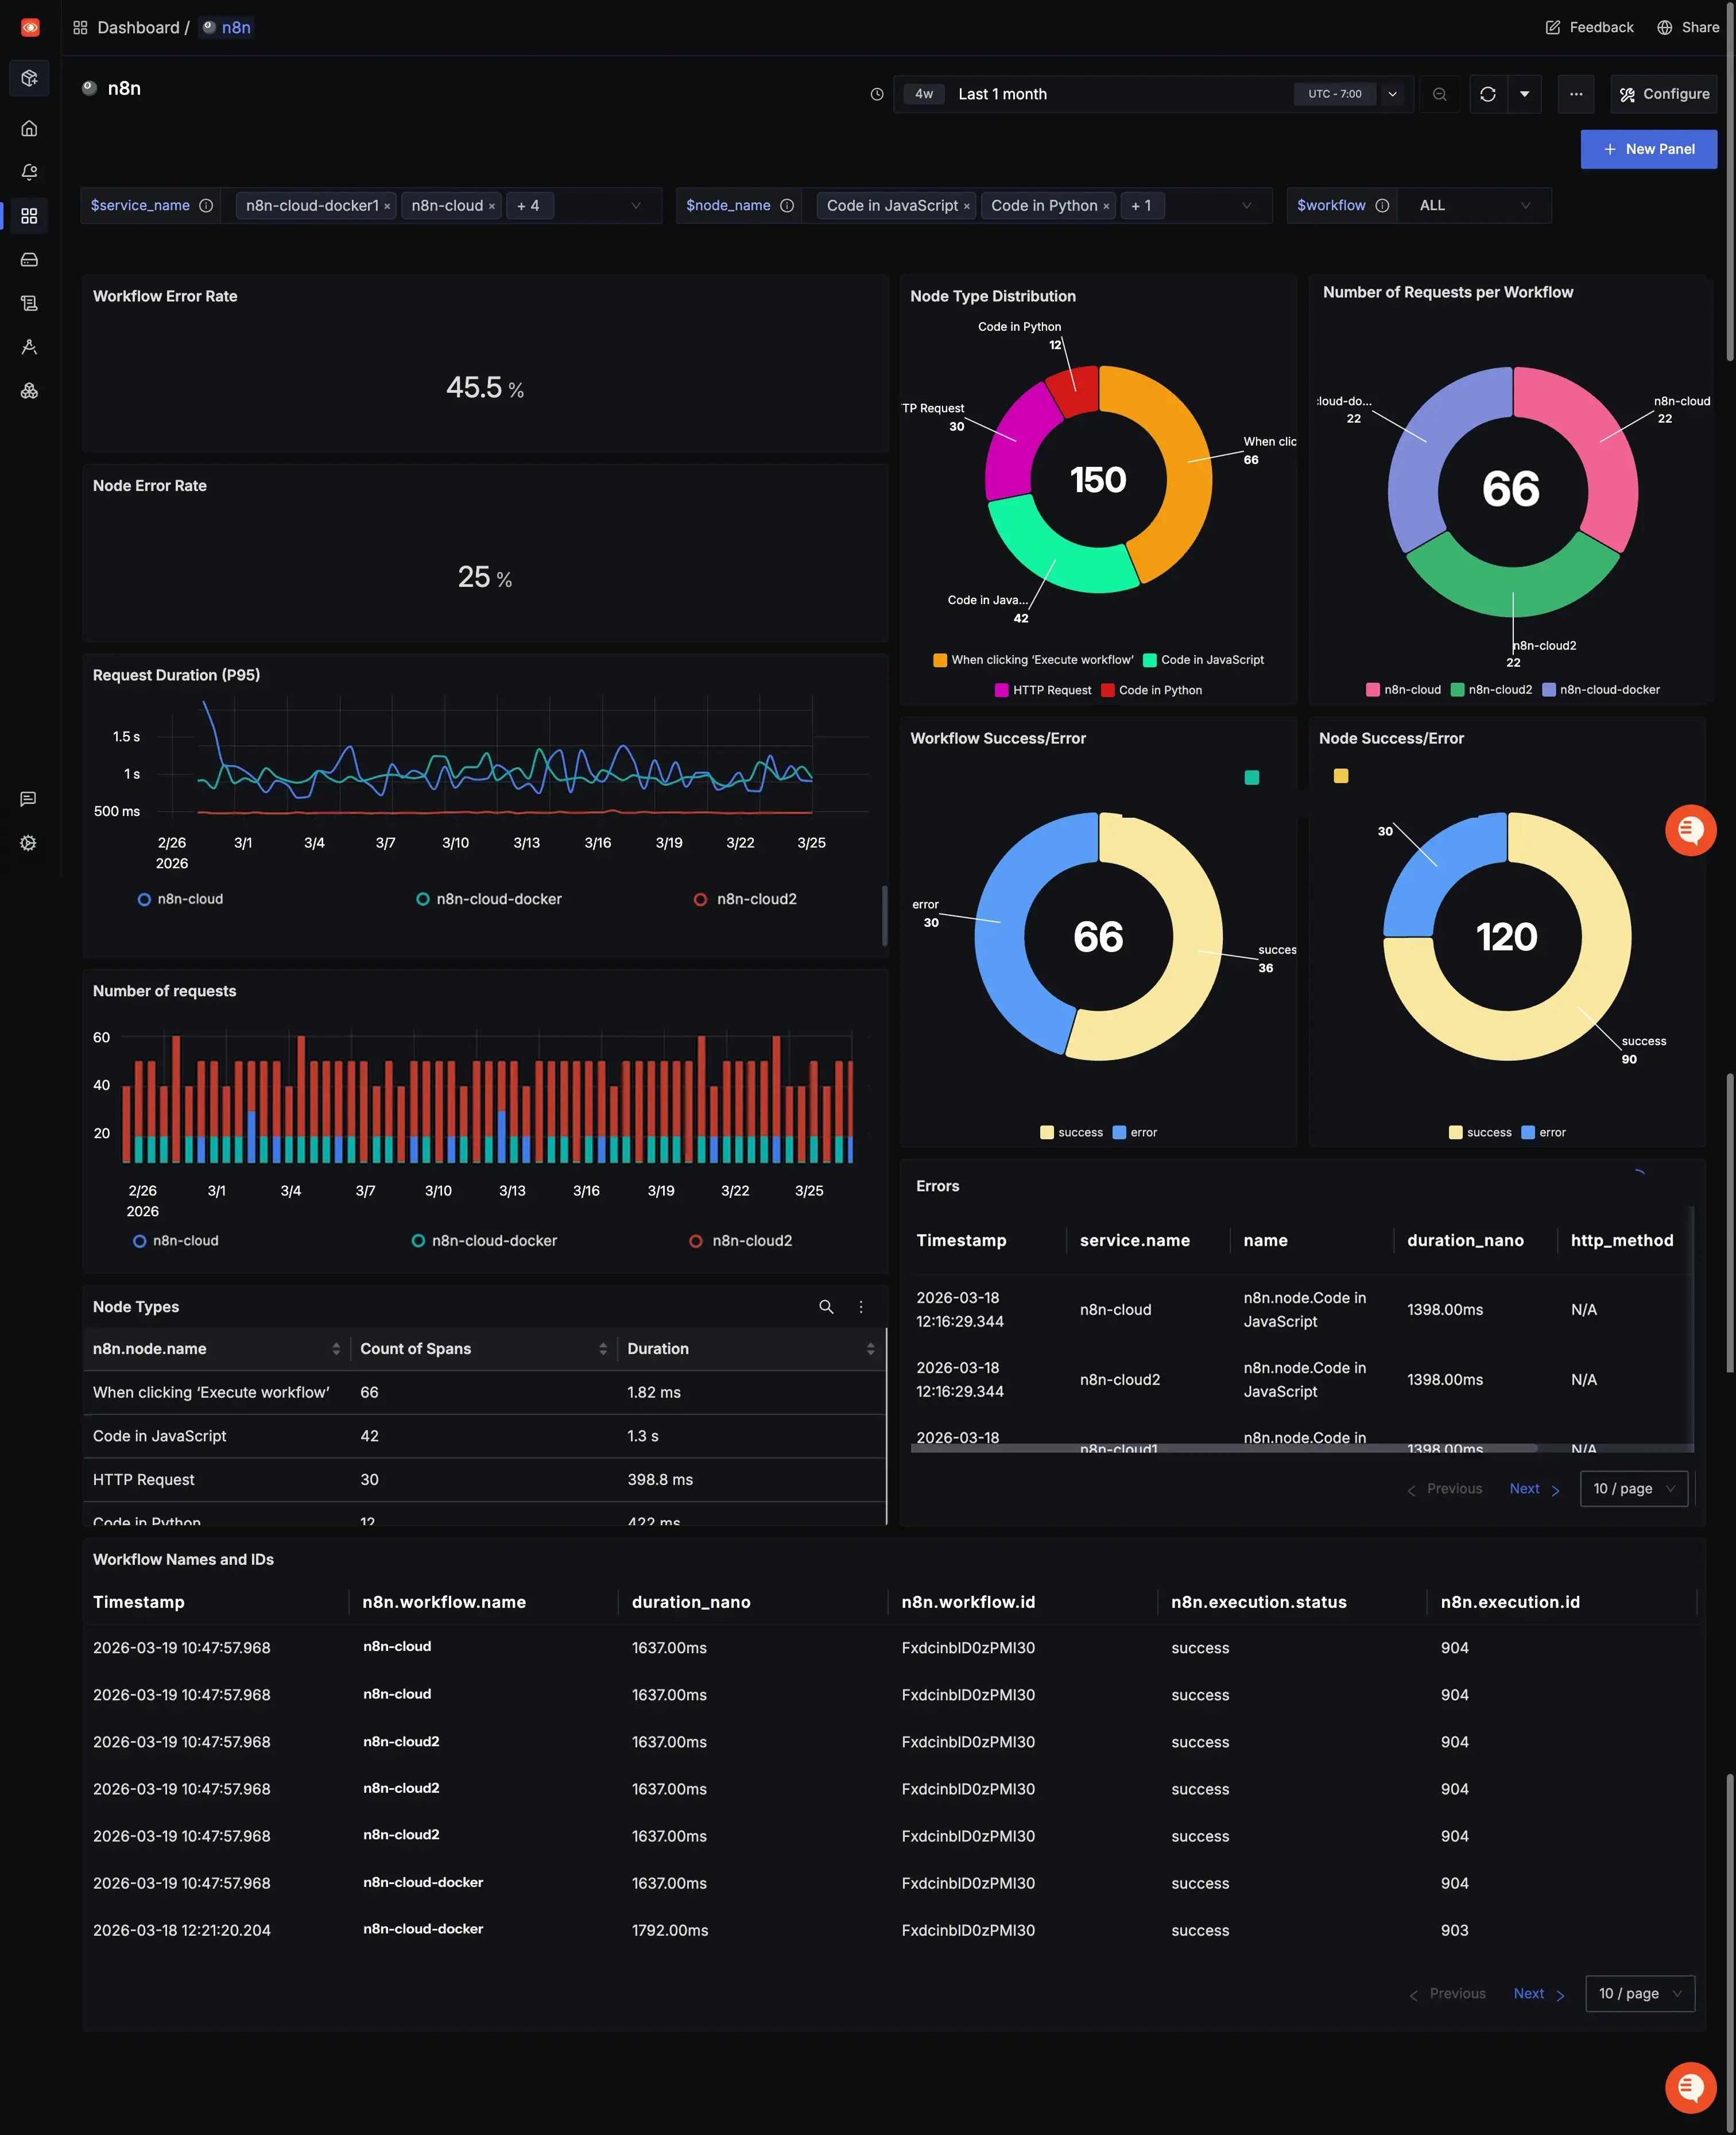
Workflow Error Rate and Node Error Rate
These two stat panels give you the number you actually care about first: what percentage of your workflows and nodes are failing. They're calculated by dividing error spans by total spans, so they update automatically as new executions come in. If something spikes, you'll see it here before you see it anywhere else.
Workflow Success/Error and Node Success/Error
These pie charts break down execution outcomes across all your workflows and nodes. At a glance you can see your overall health. How much of your execution volume is succeeding versus failing. Useful for spotting when a previously stable workflow starts degrading over time.
Request Duration
A time series graph tracking execution duration over time. This is your performance baseline. If your workflows are consistently completing in under 5 seconds and that number suddenly jumps, something changed, and this panel is what tells you when it happened.
Workflow Distribution
A pie chart showing execution volume broken down by workflow name. This tells you which workflows are running most frequently. Useful for prioritizing where to focus, and for spotting unusual spikes in execution volume that might indicate a trigger firing more than expected.
Node Type Distribution
A pie chart showing the breakdown of node types by execution count. Useful for understanding the shape of your automation stack. How much of your execution time is HTTP calls versus data transformation versus custom code.
Errors
A live list of recent failed traces, filtered by service name. Each row links directly to the full trace in SigNoz, so you can go from "something failed" to the exact node that caused it in two clicks.
Together, these panels turn your n8n execution data from something you dig through manually into something you can monitor at a glance.
Going Further
The current service covers execution level and node level tracing well, but there are some signals worth adding that aren’t included in the n8n API.
Execution queue time - the gap between when a workflow is triggered and when it actually starts executing. For high volume use cases, this metric is important. A workflow that takes 2 seconds to run but sits in queue for 30 seconds is a different problem than just a slow node.
Memory consumption per execution is another one. n8n can be memory intensive depending on your specific workflow, and without memory metrics, you have to guess at whether a slowdown is due to compute or memory.
Wrapping Up
n8n is a powerful tool, but without observability, you're flying blind. Trusting that your workflows ran, that the right data moved, that nothing silently failed overnight. That may work when you have few simple workflows but it’s not sustainable as your usage scales.
We built a lightweight, non-invasive observability layer that gives you real visibility into your n8n executions. You get traces, node level timing, error attribution, and a dashboard that tells you the health of all your automations at a glance, all built on open standards.
If you want to take it further, you can even set up alerting on top of any of these panels. You can set a threshold on your workflow error rate, get notified when execution time crosses a limit, or alert when a specific workflow hasn't run in the expected window.
