Monitoring your Express application using OpenTelemetry
Nodejs is a popular Javascript runtime environment that executes Javascript code outside of a web browser. Express is the most popular web frameworks that sits on top of Nodejs and adds functionalities like middleware, routing, etc. to Nodejs.

You can monitor your express application using OpenTelemetry and a tracing backend of your choice. OpenTelemetry is the leading open-source standard under the Cloud Native Computing Foundation that aims to standardize the process of instrumentation across multiple languages.
In this article, we will be using SigNoz to store and visualize the telemetry data collected by OpenTelemetry from a sample Express.js application.
Steps to get started with OpenTelemetry for an Express.js application:
- Creating a SigNoz cloud account
- Creating a sample express application
- Setting up OpenTelemetry and sending data to SigNoz
- Monitoring your Application in SigNoz
Creating a SigNoz cloud account
SigNoz cloud is the easiest way to run SigNoz. You can sign up here for a free account and get 30 days of unlimited access to all features.
After you sign up and verify your email, you will be provided with details of your SigNoz cloud instance. Once you set up your password and log in, you will be greeted with the following onboarding screen.
Creating a Sample Express Application
This section guides you through setting up a basic Express.js application, instrumenting it with OpenTelemetry, and sending telemetry data to SigNoz.
Prerequisites
- Node.js version 12 or newer. Download the latest version of Node.js here.
Quick Start
To avoid manual setup, clone the sample Express.js app repository, which is pre-configured with OpenTelemetry instrumentation. However, to fully understand the process, you are recommended to follow the steps below.
Steps to Build the Application
For the sample application, let's create a basic 'hello world' express.js application.
Verify Node installation
Check if Node.js is installed:
node - vMake a directory and install Express
Make a directory for your sample app on your machine. Then open up the terminal, navigate to the directory path and install Express with the following command:
npm i expressCreate index.js
Create a file called
index.jsin your directory, and with any text editor, setup your 'Hello World' file with the code below:const express = require("express"); const cors = require("cors"); const PORT = process.env.PORT || "5555"; const app = express(); app.use(cors()); app.use(express.json()); app.all("/", (req, res) => { res.json({ method: req.method, message: "Hello World", ...req.body }); }); app.get("/404", (req, res) => { res.sendStatus(404); }); app.listen(parseInt(PORT, 10), () => { console.log(`Listening for requests on http://localhost:${PORT}`); });Check if your application is working
Run your application using the command below on your terminal.
node index.jsYou can check if your app is working by visiting http://localhost:5555/

Express application running Once you are finished checking, exit the application by using
Ctrl + Con your terminal.
Setting up OpenTelemetry and sending data to SigNoz
SigNoz offers various instrumentation methods to help you send telemetry data from your application to SigNoz Cloud for comprehensive monitoring and analysis. In this tutorial, we will utilize the No Code Automatic Instrumentation method, which simplifies the process by collecting telemetry data without requiring code changes.
Install OpenTelemetry Packages
To enable telemetry data collection for your application, you need to install the necessary OpenTelemetry packages. Use the following commands:
npm install --save @opentelemetry/api
npm install --save @opentelemetry/auto-instrumentations-node
These libraries enable automatic instrumentation and interaction with the OpenTelemetry API:
@opentelemetry/sdk-node- This package provides the full OpenTelemetry SDK for Node.js including tracing and metrics.@opentelemetry/auto-instrumentations-node- This module provides a simple way to initialize multiple Node instrumentations.@opentelemetry/exporter-trace-otlp-http- This module provides the exporter to be used with OTLP (http/json) compatible receivers.
💡 Note: If you run into any error, you might want to use these pinned versions of OpenTelemetry libraries used in this.
Configure Environment Variables
To configure OpenTelemetry for your application, export the necessary environment variables. These variables define the data export settings and identify your application in SigNoz.
Run the below in your terminal:
export OTEL_TRACES_EXPORTER="otlp"
export OTEL_EXPORTER_OTLP_TRACES_ENDPOINT="<SIGNOZ_ENDPOINT>"
export OTEL_NODE_RESOURCE_DETECTORS="env,host,os"
export OTEL_SERVICE_NAME="<APP_NAME>"
export OTEL_EXPORTER_OTLP_HEADERS="signoz-ingestion-key=<SIGNOZ_INGESTION_KEY>"
export NODE_OPTIONS="--require @opentelemetry/auto-instrumentations-node/register"
Here is a breakdown of the environment variables used:
Variable Description OTEL_TRACES_EXPORTERSpecifies the traces exporter. Set to "otlp"to use the OpenTelemetry Protocol (OTLP) for exporting trace data.OTEL_EXPORTER_OTLP_TRACES_ENDPOINTThe SigNoz ingestion URL. You should have received this URL via email after registering with SigNoz Cloud. OTEL_NODE_RESOURCE_DETECTORSIdentifies additional resource metadata such as environment, host, and OS for better trace context. OTEL_SERVICE_NAMEThe name of your application. This will appear in SigNoz as the service being monitored. OTEL_EXPORTER_OTLP_HEADERSContains authentication headers, including your SigNoz ingestion key. NODE_OPTIONSConfigures the Node.js runtime to preload OpenTelemetry's auto-instrumentation library. Be sure to replace
<SIGNOZ_INGESTION_KEY>with your actual SigNoz ingestion key. If you haven't created one yet, you can follow this guide to generate your ingestion key.
Variable config Start the Application
After setting the environment variables, start your application by running:
node index.jsYou can check your application running at http://localhost:5555/.
You need to generate some load in order to see data reported on SigNoz dashboard. Refresh the endpoint for 10-20 times, and wait for 2-3 mins.
Monitoring your Application in SigNoz
SigNoz is an open-source, full-stack Application Performance Management (APM) tool that simplifies the process of visualizing telemetry data, including metrics, traces, and logs. Built on OpenTelemetry, SigNoz helps you monitor, troubleshoot, and optimize the performance of your applications by providing powerful visualizations and insights into your application's behaviour and health. With its easy-to-use dashboard, SigNoz makes it effortless to capture and analyze telemetry data from your applications in real-time.
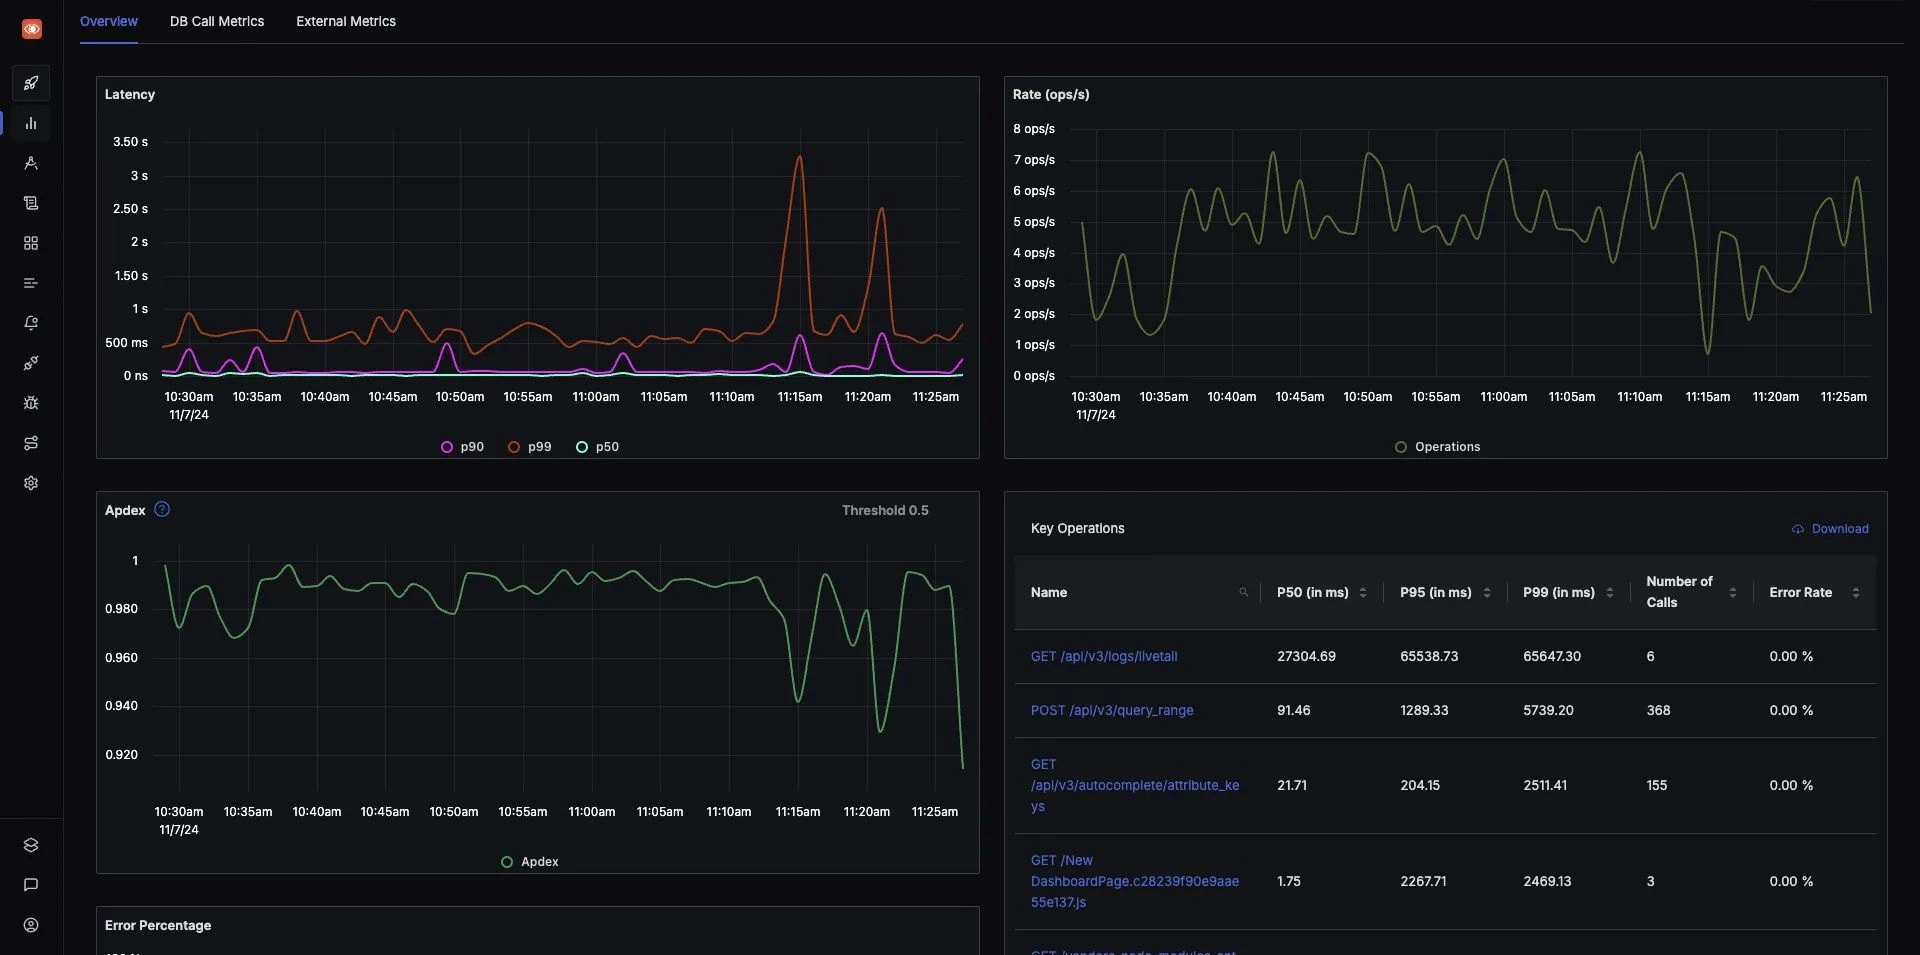
Once your application is running and has generated some traffic, you can start monitoring its performance in your SigNoz Cloud account. Navigate to the Services tab, and you should see your application listed.

SigNoz provides out-of-the-box visualizations for key performance metrics, known as RED metrics:
- Rate of Requests: How many requests are being processed?
- Error Rate: The percentage of requests that result in errors.
- Duration: How long does each request take to process?
Click on your application listed in the Services tab to be redirected to the Metrics page. Here, you will find pre-built visualizations that provide insights into your application's performance.

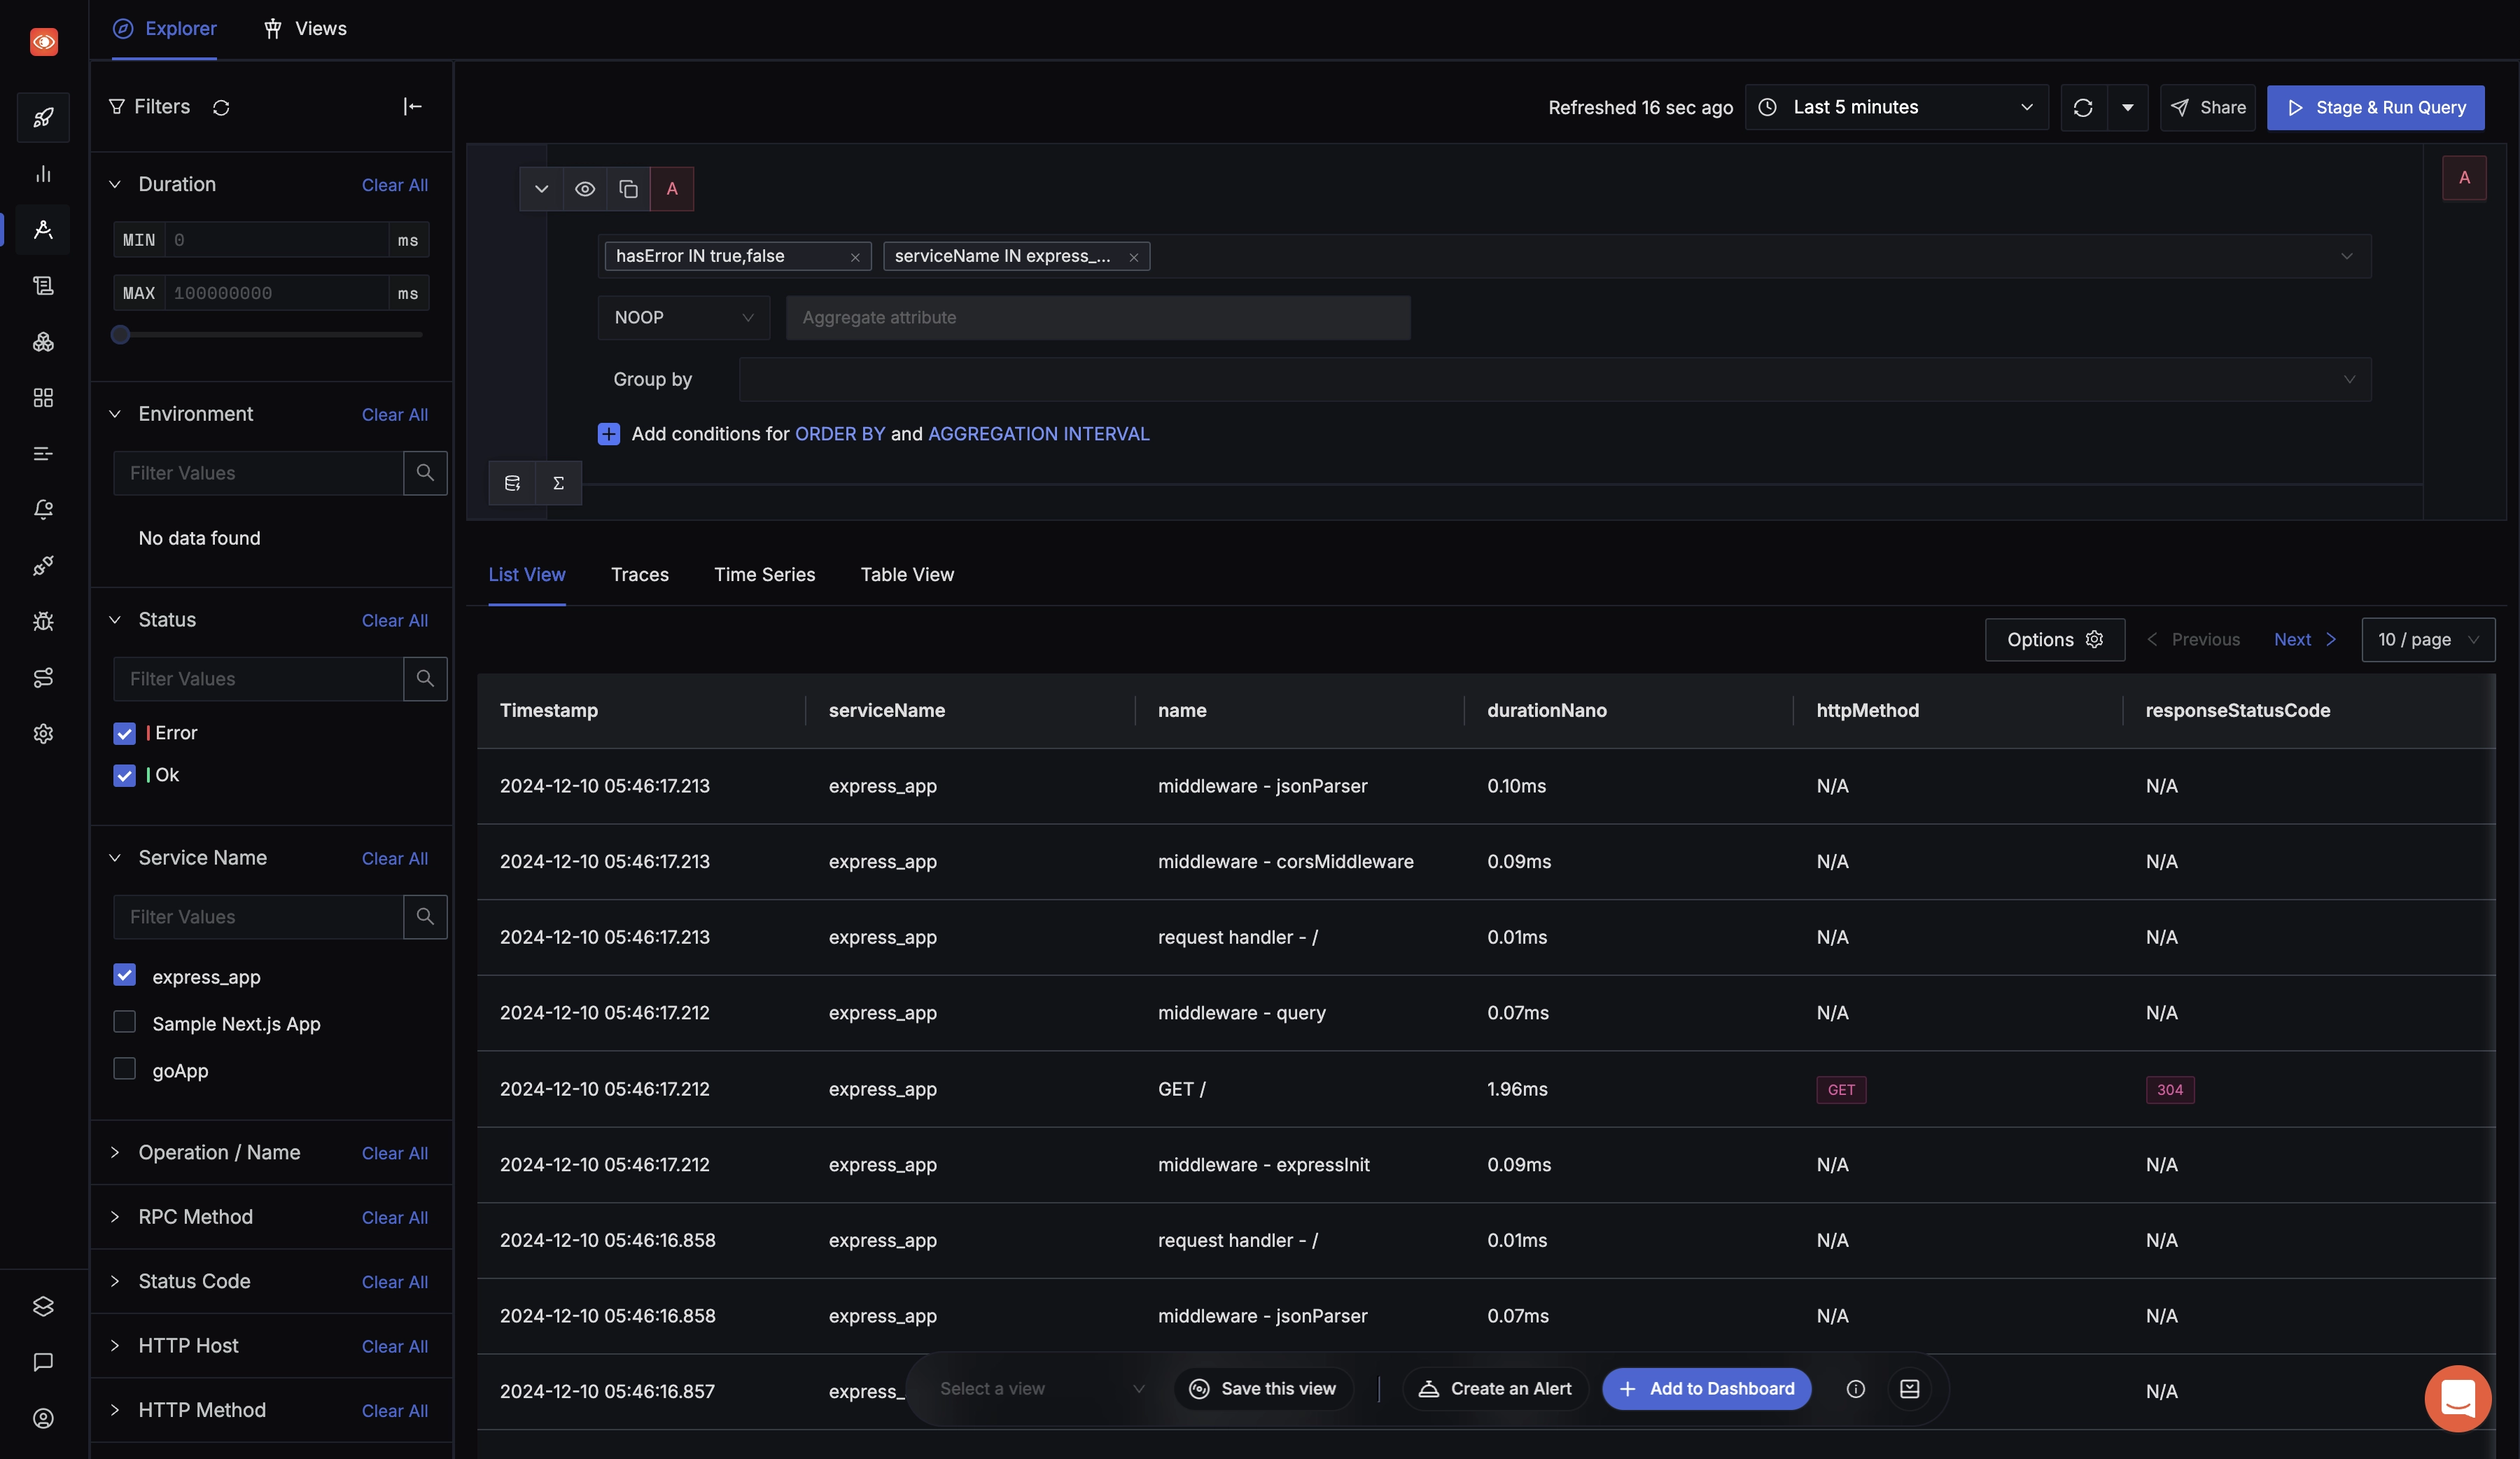
To explore traces, navigate to the Traces tab. You can choose a particular timestamp where latency is high and investigate traces from those moments to pinpoint performance bottlenecks.

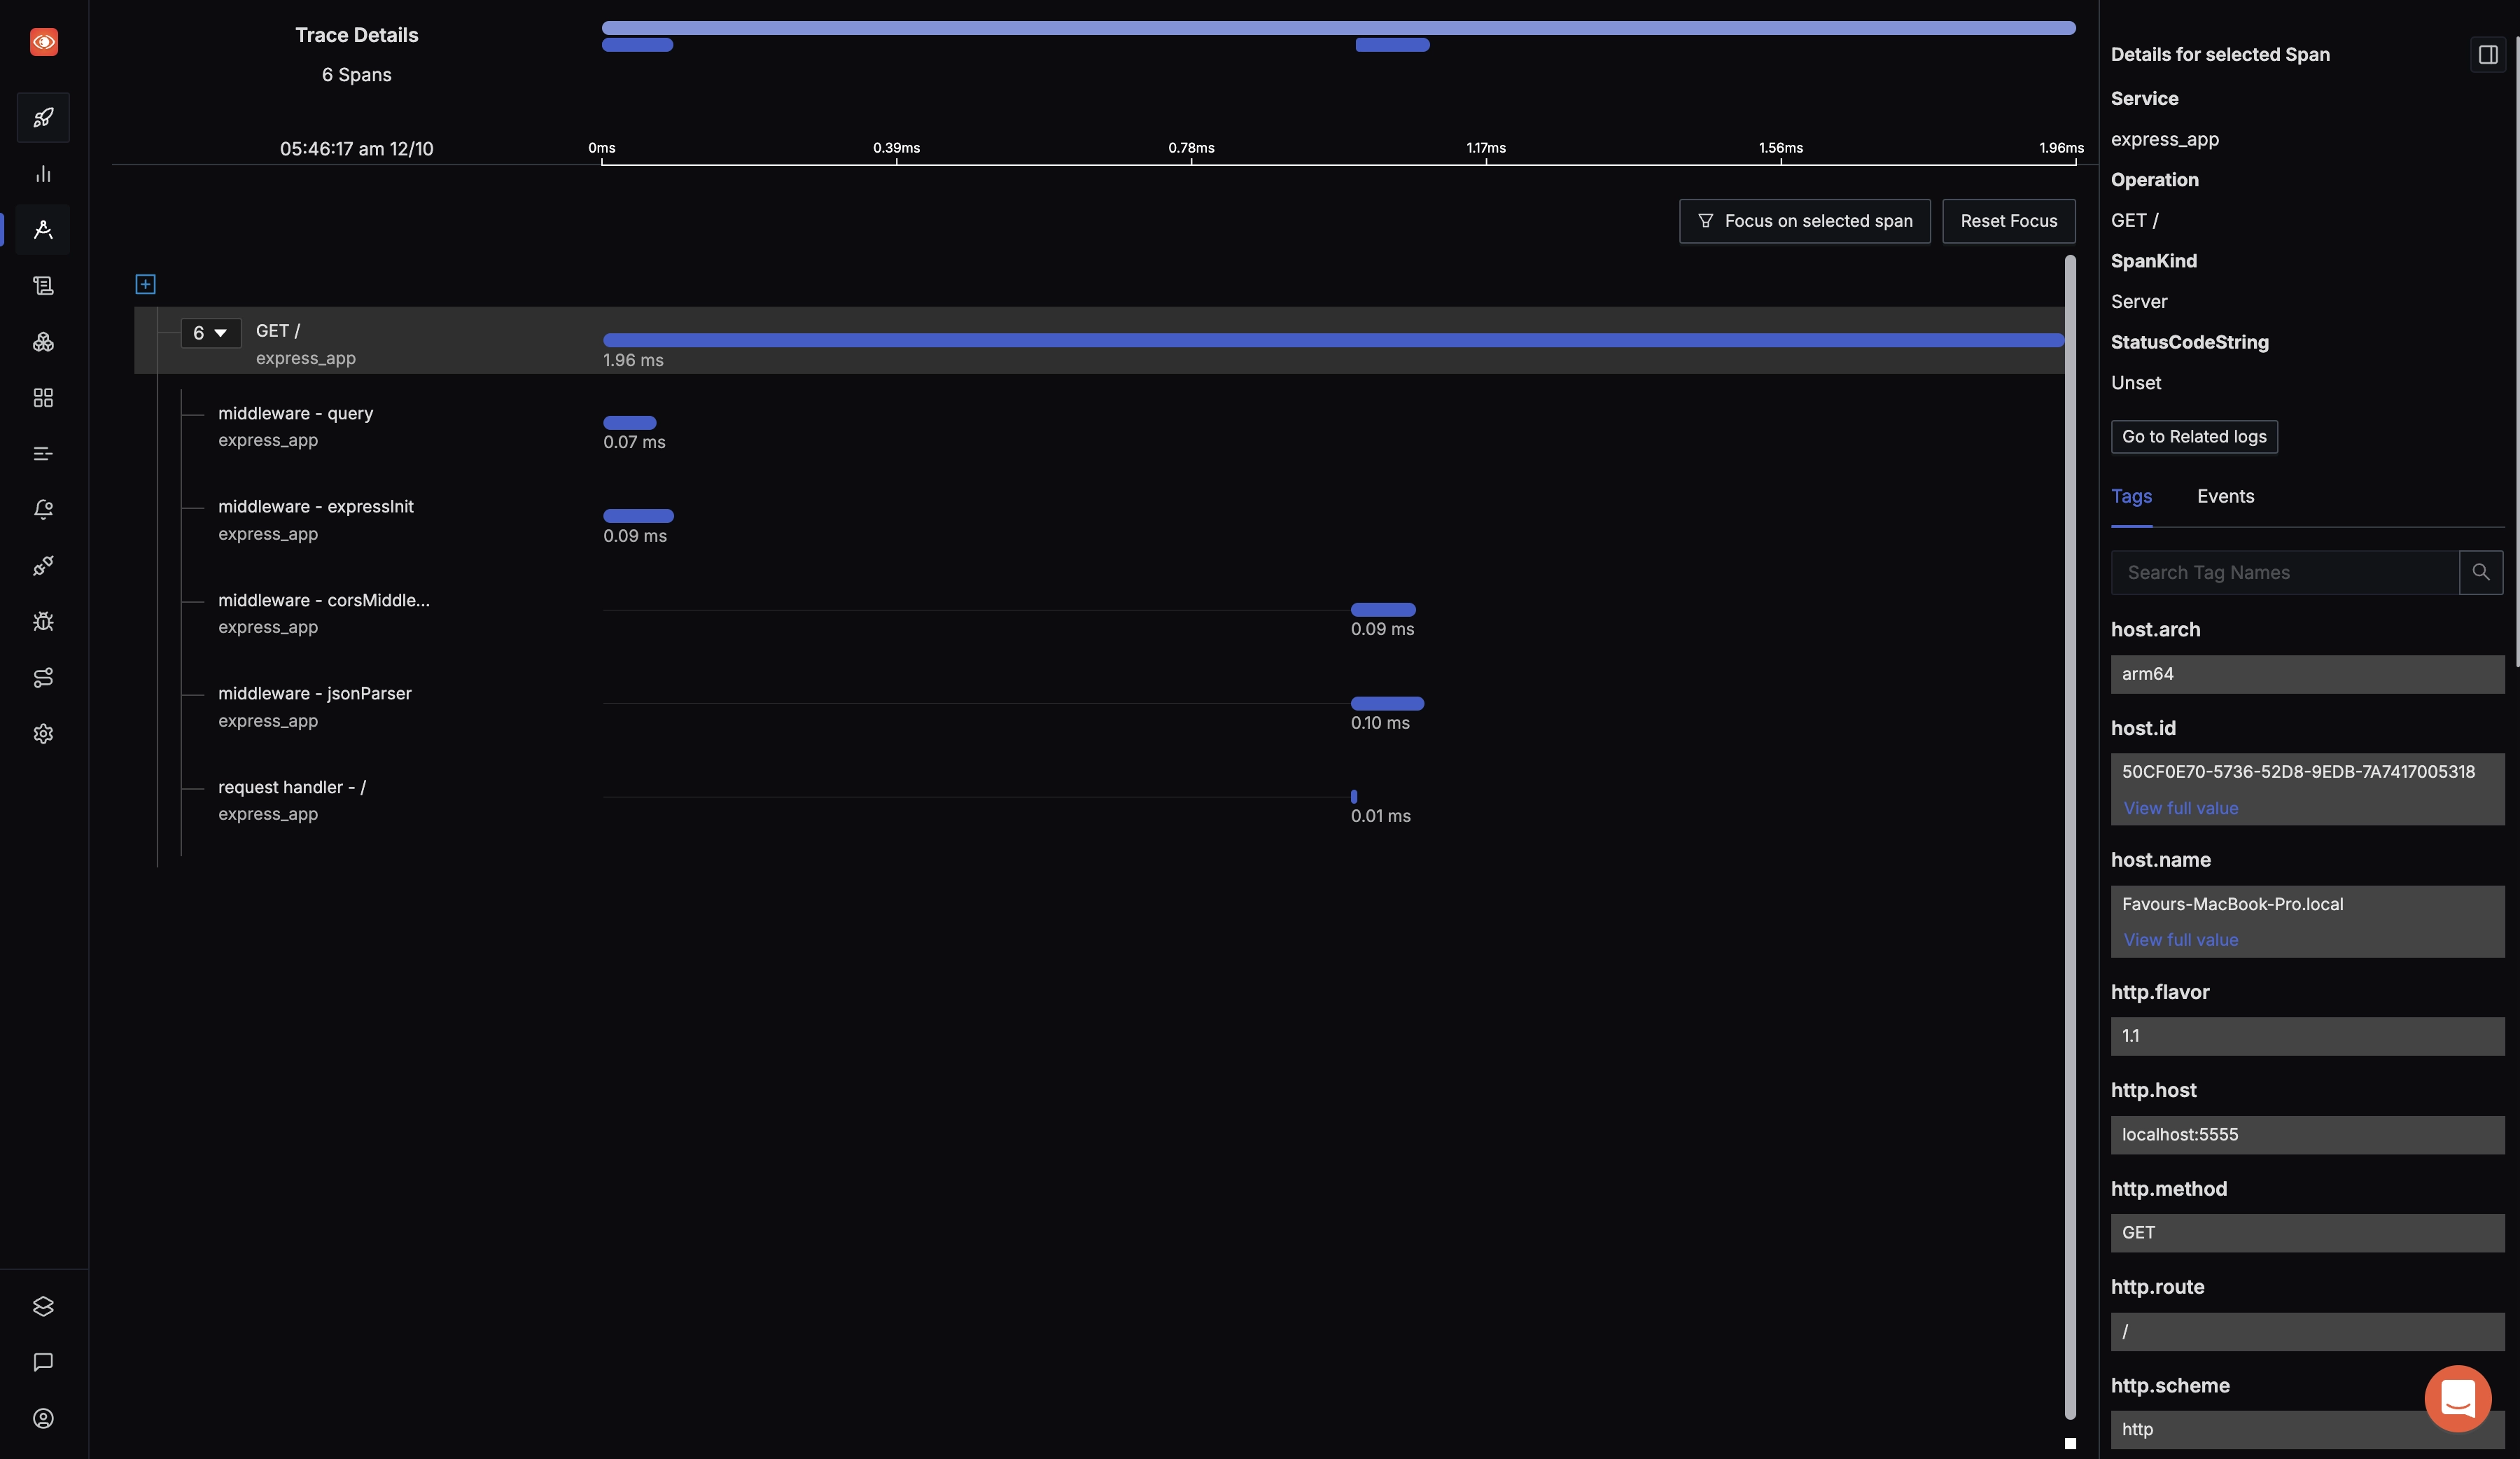
For further analysis, click on a trace to investigate performance issues or latency. SigNoz provides Flamegraphs that allow you to identify the root cause of latency by visualizing the time spent on each part of the request. This helps pinpoint which specific operations or services are causing delays and enables you to optimize your application's performance.

Conclusion
OpenTelemetry makes it very convenient to instrument your Express application. You can then use an open-source APM tool like SigNoz to analyze the performance of your app. As SigNoz offers a full-stack observability tool, you don't have to use multiple tools for your monitoring needs.
Getting started with SigNoz
SigNoz cloud is the easiest way to run SigNoz. Sign up for a free account and get 30 days of unlimited access to all features.
You can also install and self-host SigNoz yourself since it is open-source. With 19,000+ GitHub stars, open-source SigNoz is loved by developers. Find the instructions to self-host SigNoz.
If you have any questions or need any help in setting things up, join our Slack community and ping us in the #support channel.
If you want to read more about SigNoz 👇
Golang Application Monitoring with OpenTelemetry and SigNoz
OpenTelemetry collector - full guide
FAQs
What is OpenTelemetry, and how does it relate to Express applications?
OpenTelemetry is an open-source standard for instrumentation that allows you to collect telemetry data (logs, metrics, and traces) from your applications. For Express applications, OpenTelemetry can be used to monitor performance, track requests, and gather insights into your app's behavior.
How do I set up OpenTelemetry for my Express application?
To set up OpenTelemetry for an Express application:
- Install necessary OpenTelemetry packages (SDK, auto-instrumentations, and exporter).
- Configure environment variables.
- Run your application.
What is SigNoz and how does it work with OpenTelemetry?
SigNoz is an open-source, full-stack Application Performance Monitoring (APM) tool. It can be used as a backend to store and visualize telemetry data collected by OpenTelemetry from your Express application. SigNoz provides dashboards for metrics, distributed tracing, and custom visualizations.
What are the benefits of using OpenTelemetry with Express?
Benefits include:
- Standardized instrumentation across multiple languages and frameworks
- Vendor-agnostic approach, allowing you to switch between different observability backends
- Automatic instrumentation for many common libraries and frameworks
- Ability to collect detailed telemetry data for a better understanding of application performance
How can I visualize the data collected by OpenTelemetry from my Express app?
You can visualize the data using an observability platform like SigNoz. SigNoz provides out-of-the-box visualizations for RED metrics (Rate, Error, and Duration), distributed traces, and allows you to create custom dashboards for your specific needs.
What are RED metrics, and why are they important for monitoring Express apps?
RED metrics stand for Rate (requests per second), Error rate (percentage of failed requests), and Duration (latency of requests). These metrics are crucial for monitoring Express apps as they provide a quick overview of your application's health and performance, allowing you to identify issues rapidly.
How does OpenTelemetry differ from other monitoring solutions for Express.js?
OpenTelemetry stands out due to its vendor-neutral, open-source nature. It provides a standardized way to instrument applications, allowing you to switch between different backends without changing your instrumentation code.
Can OpenTelemetry be used with existing monitoring tools in my Express.js application?
Yes, OpenTelemetry is designed to work alongside existing monitoring solutions. Many popular monitoring tools offer OpenTelemetry integrations, allowing you to enhance your current setup.
What performance impact does OpenTelemetry have on my Express.js application?
While OpenTelemetry does introduce some overhead, it's generally minimal. The impact can be further reduced by implementing sampling strategies and optimizing your instrumentation.
How can I troubleshoot common issues when implementing OpenTelemetry in Express.js?
Common troubleshooting steps include:
- Verifying correct configuration of the SDK and exporters
- Checking for conflicting instrumentation libraries
- Ensuring proper context propagation in asynchronous code
- Reviewing logs for any OpenTelemetry-related errors or warnings


