OpenTelemetry UI - See What’s Possible With OpenTelemetry data
OpenTelemetry is a Cloud Native Computing Foundation(CNCF) project aimed at standardizing the way we instrument applications for generating telemetry data(logs, metrics, and traces). However, OpenTelemetry does not provide storage and visualization for the collected telemetry data. For visualizing OpenTelemetry data, you need an OpenTelemetry UI. The data collected by OpenTelemetry can be sent to a backend of your choice, which can then be visualized.
OpenTelemetry is quietly becoming the web standard for instrumenting cloud-native applications. For applications based on distributed systems, OpenTelemetry becomes a natural choice for instrumentation. There are a few reasons why OpenTelemetry is the preferred choice for generating telemetry data:
- Lightweight: OpenTelemetry APIs are lightweight and are completely decoupled from any implementation. By default, OpenTelemetry APIs are no-op implementations.
- Diverse: OpenTelemetry provides instrumentation in almost all the major programming languages. It also covers instrumentation for a large number of open-source libraries and frameworks.
- Community: OpenTelemetry is backed by a huge community and is incubating under CNCF. It is also backed by major cloud vendors. The huge community support makes it a safe choice for future-proofing your instrumentation layer.
Once telemetry data is collected with OpenTelemetry, it needs to be stored and visualized for end-user consumption. A good visualization of telemetry data collected by OpenTelemetry can lead to quicker insights to debug performance issues.
A few charts possible with OpenTelemetry data can be:
- Application performance metrics charts
- Database calls
- Traces visualized with Flamegraphs and Gantt charts
Before we learn more about visualizations in an OpenTelemetry UI, let’s have a brief overview of OpenTelemetry.
What is OpenTelemetry?
OpenTelemetry is an open-source collection of tools, APIs, and SDKs that aims to standardize the way we generate and collect telemetry data. It follows a specification-driven development. The OpenTelemetry specification has design and implementation guidelines for how the instrumentation libraries should be implemented. In addition, it provides client libraries in all the major programming languages that follow the specification.
OpenTelemetry was formed after the merger of two open-source projects - OpenCensus and OpenTracing in 2019. Since then, it has been the go-to open-source standard for instrumenting cloud-native applications.
The specification is designed into distinct types of telemetry known as signals. Presently, OpenTelemetry has specifications for these three signals:
- Logs
- Metrics and
- Traces
Together, these three signals form the three pillars of observability. OpenTelemetry is the bedrock for setting up an observability framework. The application code is instrumented using OpenTelemetry client libraries, which enables the generation of telemetry data. Once the telemetry data is generated and collected, you need to configure the OpenTelemetry exporter to send data to a backed analysis tool like SigNoz.
Why do we need an OpenTelemetry UI?
OpenTelemetry UI serves as a powerful tool for monitoring, analyzing, and optimizing the performance and behavior of your applications and infrastructure. It provides a user-friendly interface for visualizing and comprehending the performance and behavior of applications and underlying infrastructure. This, in turn, helps in making informed decisions based on real-time and historical data.
Here are some key benefits of using an OpenTelemetry UI:
- Debugging and troubleshooting: With an OpenTelemetry UI, identifying errors and performance bottlenecks in distributed applications becomes swift. For instance, it aids in pinpointing which service(s) might be experiencing delays or encountering errors, streamlining the debugging and troubleshooting process to uncover the root cause.
- Monitoring and observability: An OpenTelemetry UI allows for continuous monitoring of the performance and overall health of distributed applications. This empowers Engineers to observe trends in performance metrics, error rates, and other vital indicators over time.
- Alerting: An OpenTelemetry UI provides the ability to set alerts for specific events, such as when performance thresholds are exceeded or errors occur. In the event of a critical service outage, these alerts promptly notify Engineers, enabling them to take immediate action.
- Analytics and reporting: An OpenTelemetry UI can be used to analyze data collected by OpenTelemetry to identify trends and patterns. For instance, it is useful for identifying which services are most frequently called or which services are most likely to fail.
What kind of visualization should an OpenTelemetry UI include?
An effective OpenTelemetry UI should incorporate a range of visualizations tailored to provide comprehensive insights into the performance and behavior of applications and infrastructure.
Here are some key types of visualizations that should be included:
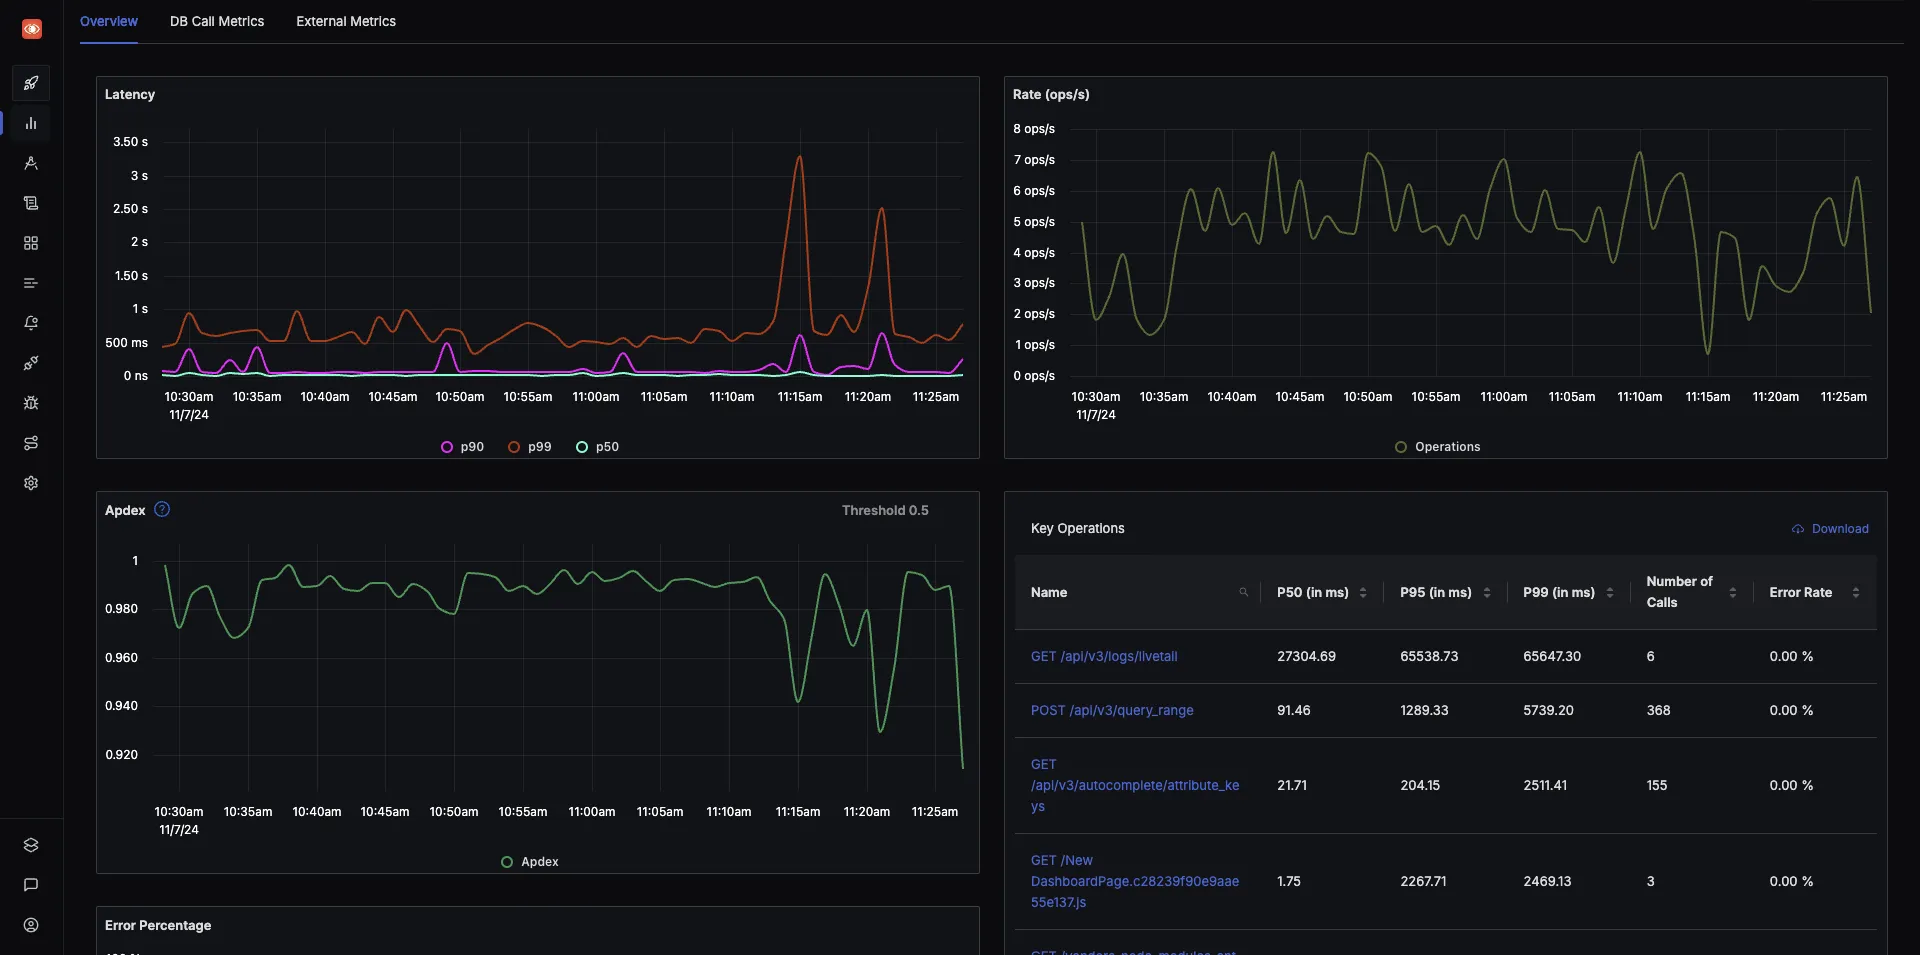
APM metrics
APM metrics are essential for understanding how applications perform in real-world scenarios. Some key APM metrics are:
- Latency - p90, p99, p50 latency of a service
- Request rates
- Error rates
- Apdex
An OpenTelemetry UI should include APM metrics to provide a comprehensive view of application performance. APM metrics mentioned above can be calculated from trace data collected by OpenTelemetry.
Distributed Tracing
Distributed tracing is a powerful observability feature for tracking the journey of a request as it flows through the various components of a distributed system. It provides a comprehensive view of user requests across various services and network boundaries. It can help identify performance bottlenecks and optimize system performance.
In an OpenTelemetry UI, you should be able to do the following with OpenTelemetry trace data:
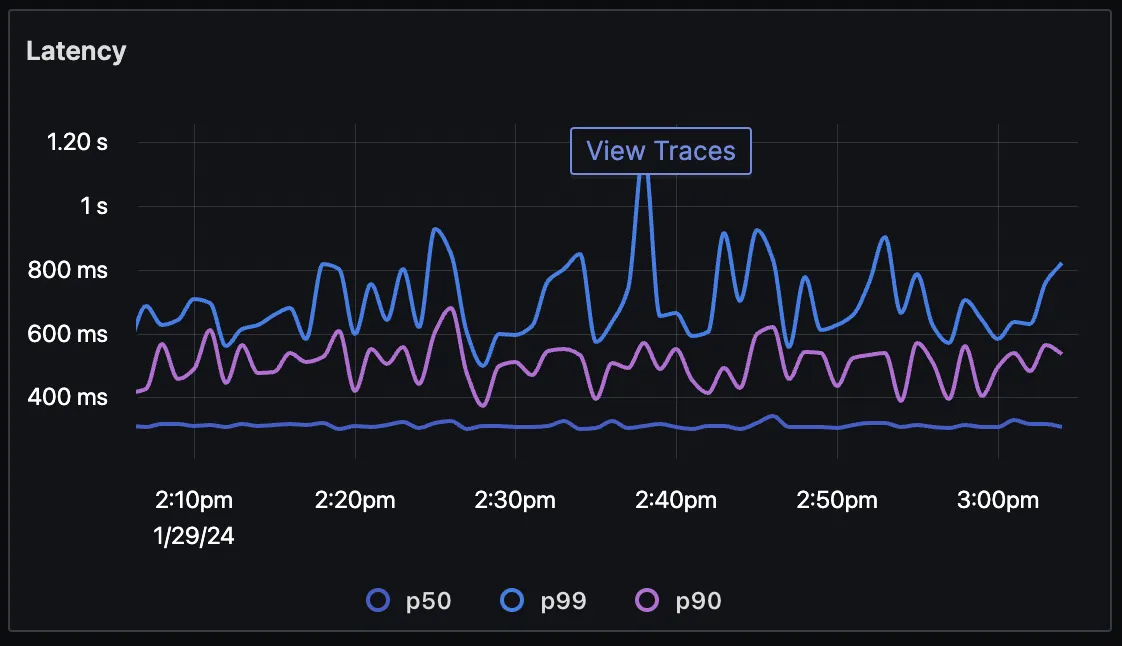
Switch easily from application metrics to corresponding trace data.
This allows you to investigate trace data around timestamps where APM metrics are not performing well.
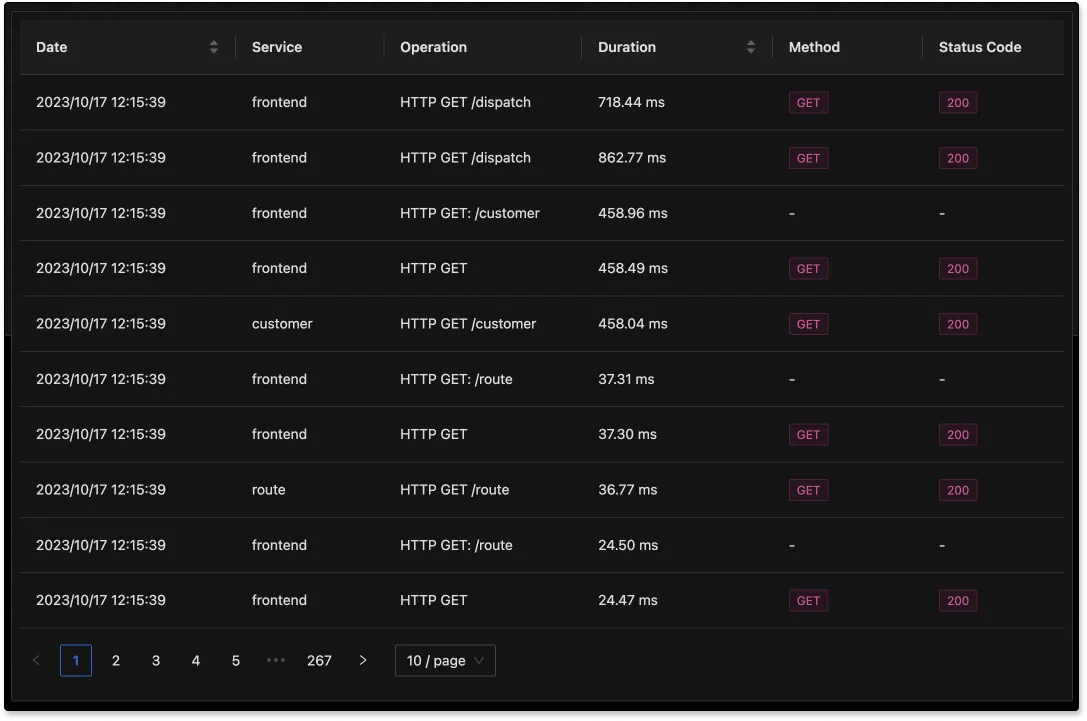
List view of all spans
This allows you to sort through spans based on duration. You can also apply filters to see spans only for a particular service.
Charts for aggregates on trace data
This is a powerful visualization available in some OpenTelemetry UI like SigNoz. You can apply aggregates like avg, p90, p99, etc. and group it by things like service.name, http.method, status.code , etc.

Visualizations like above in an OpenTelemetry UI helps you dig deeper for application insights and makes debugging easier.
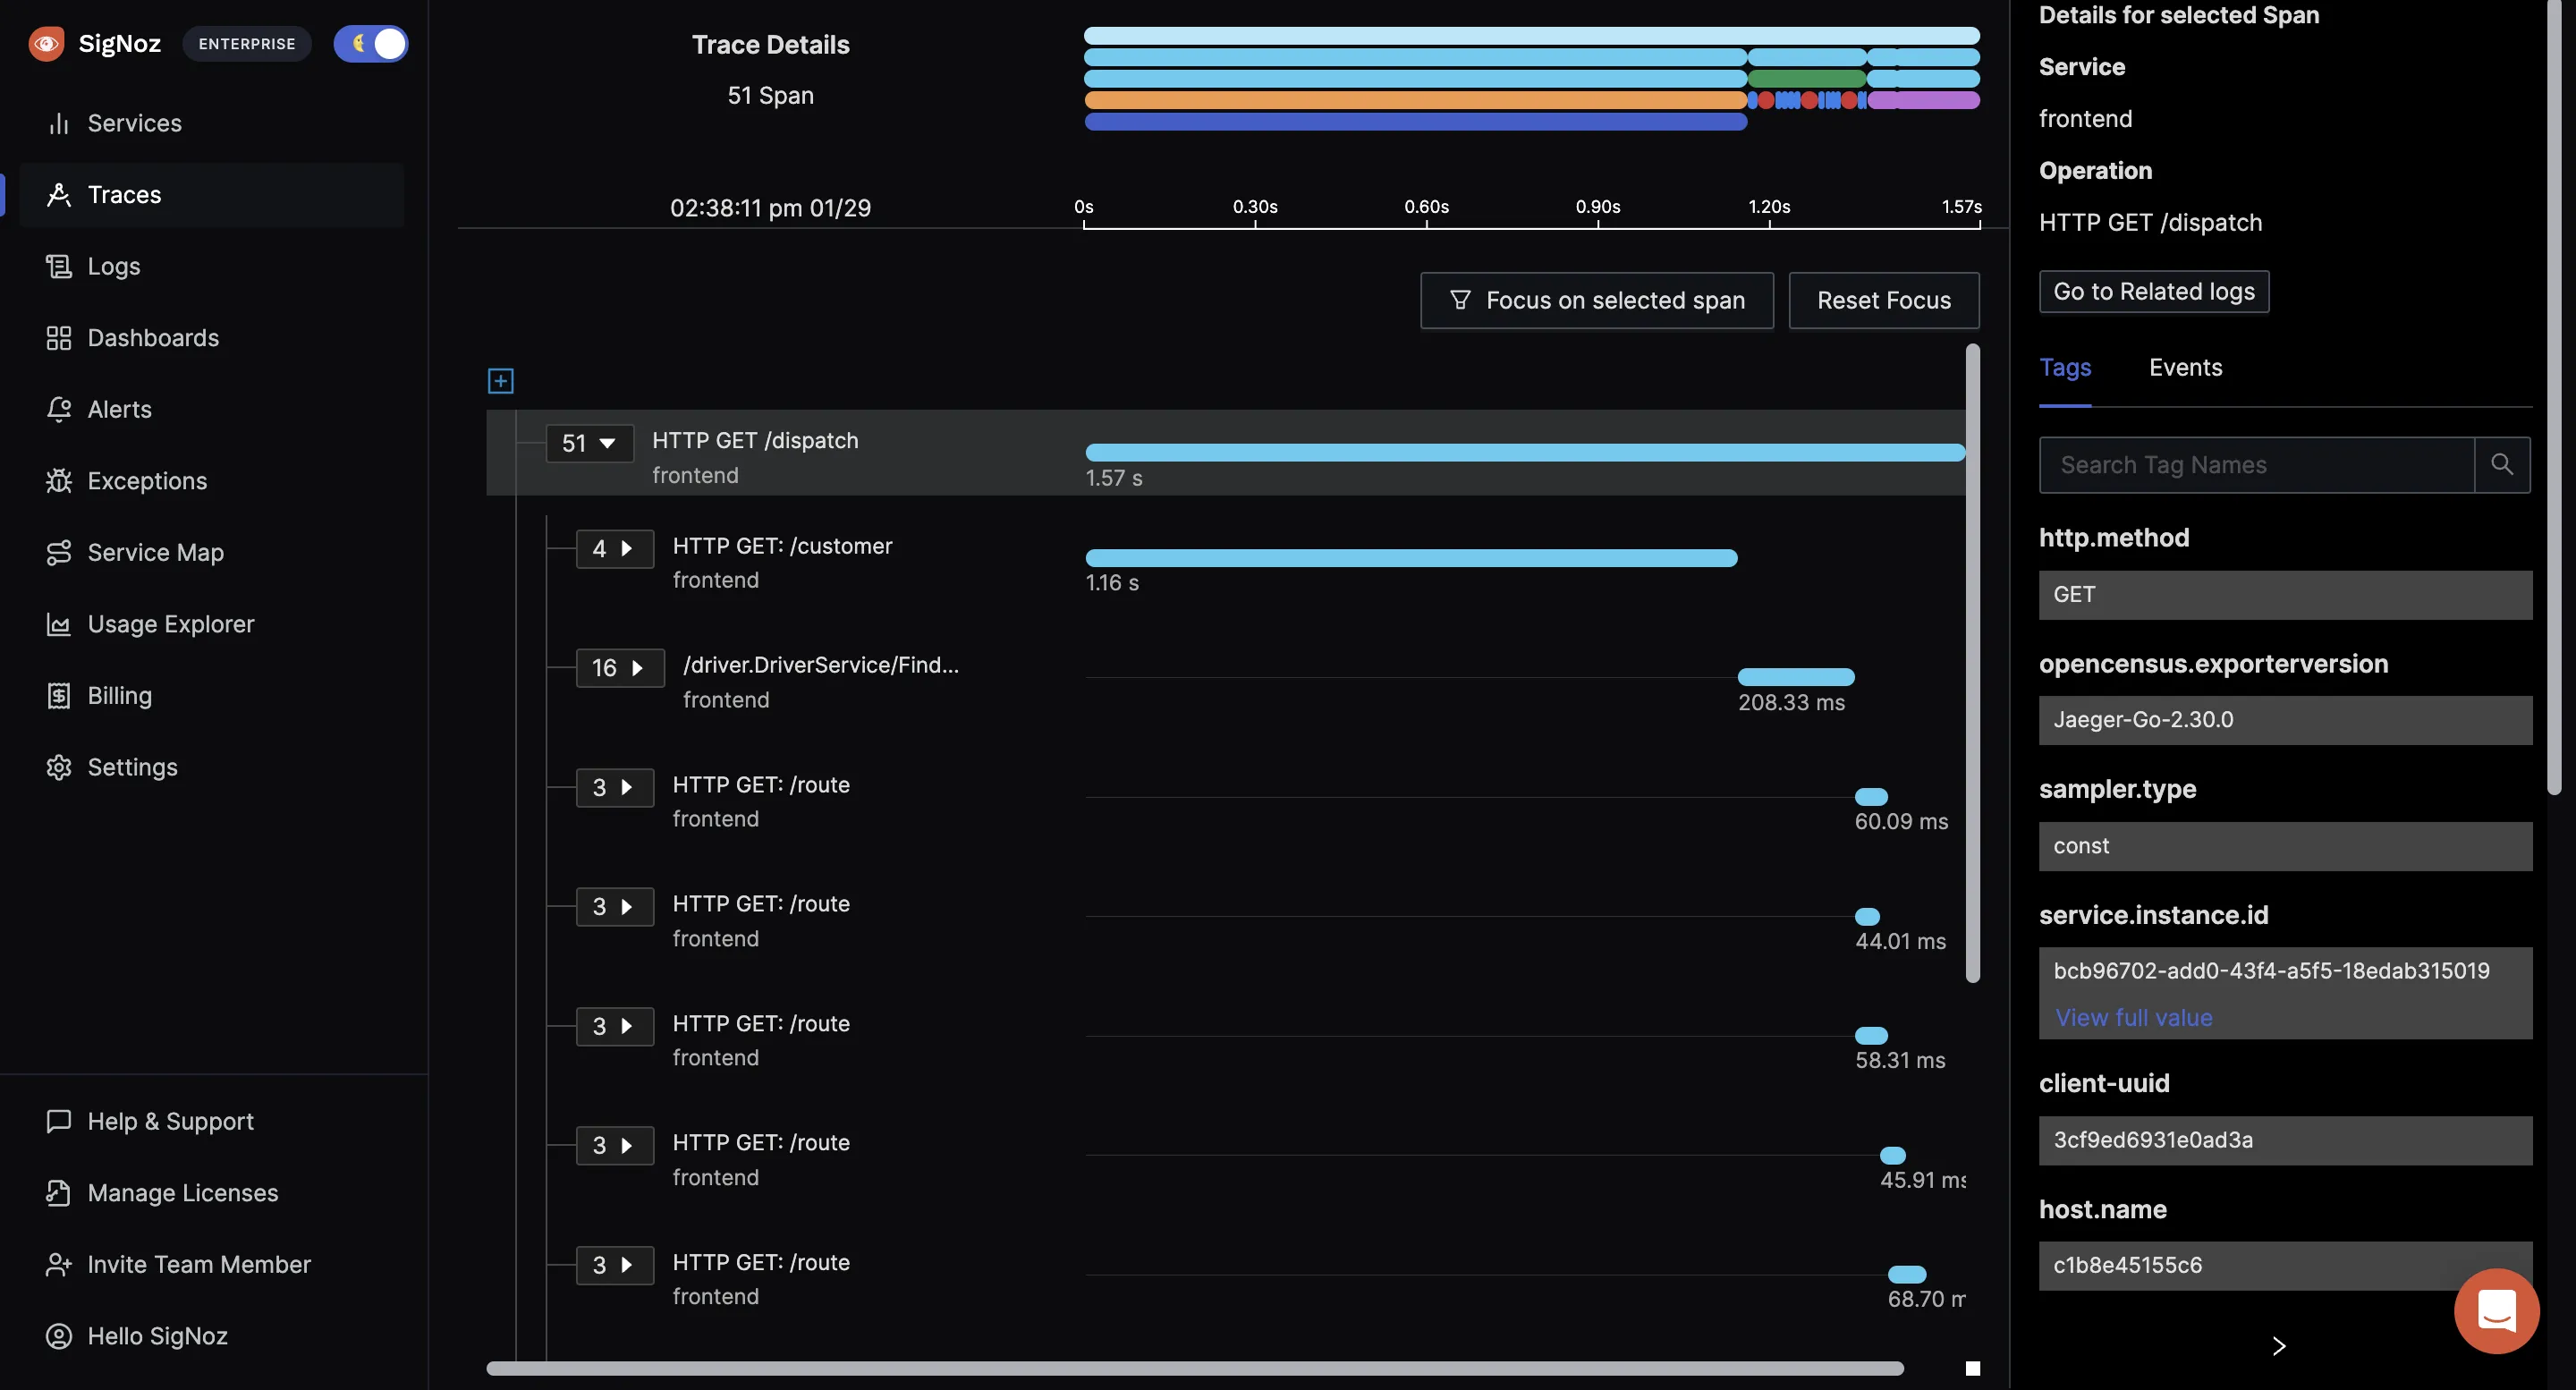
Flamegraphs & Gantt charts
Flamegraphs and Gantt charts are two powerful visualization features that can be used to analyze OpenTelemetry data. Flamegraphs can be used to visualize the flow of requests in a trace. Gantt charts provide a timeline view of task execution, helping to identify resource contention and bottlenecks.
Trace exploration with queries
Trace exploration with queries refers to the capability within an observability tool, to search and analyze traces (sequences of events) based on specific criteria or conditions.
A good OpenTelemetry UI empowers developers to perform targeted investigations. They can achieve this by applying filters or conditions to the traces, allowing them to narrow down their search. This focused approach enables them to concentrate on specific transactions, requests, or events within a distributed system.
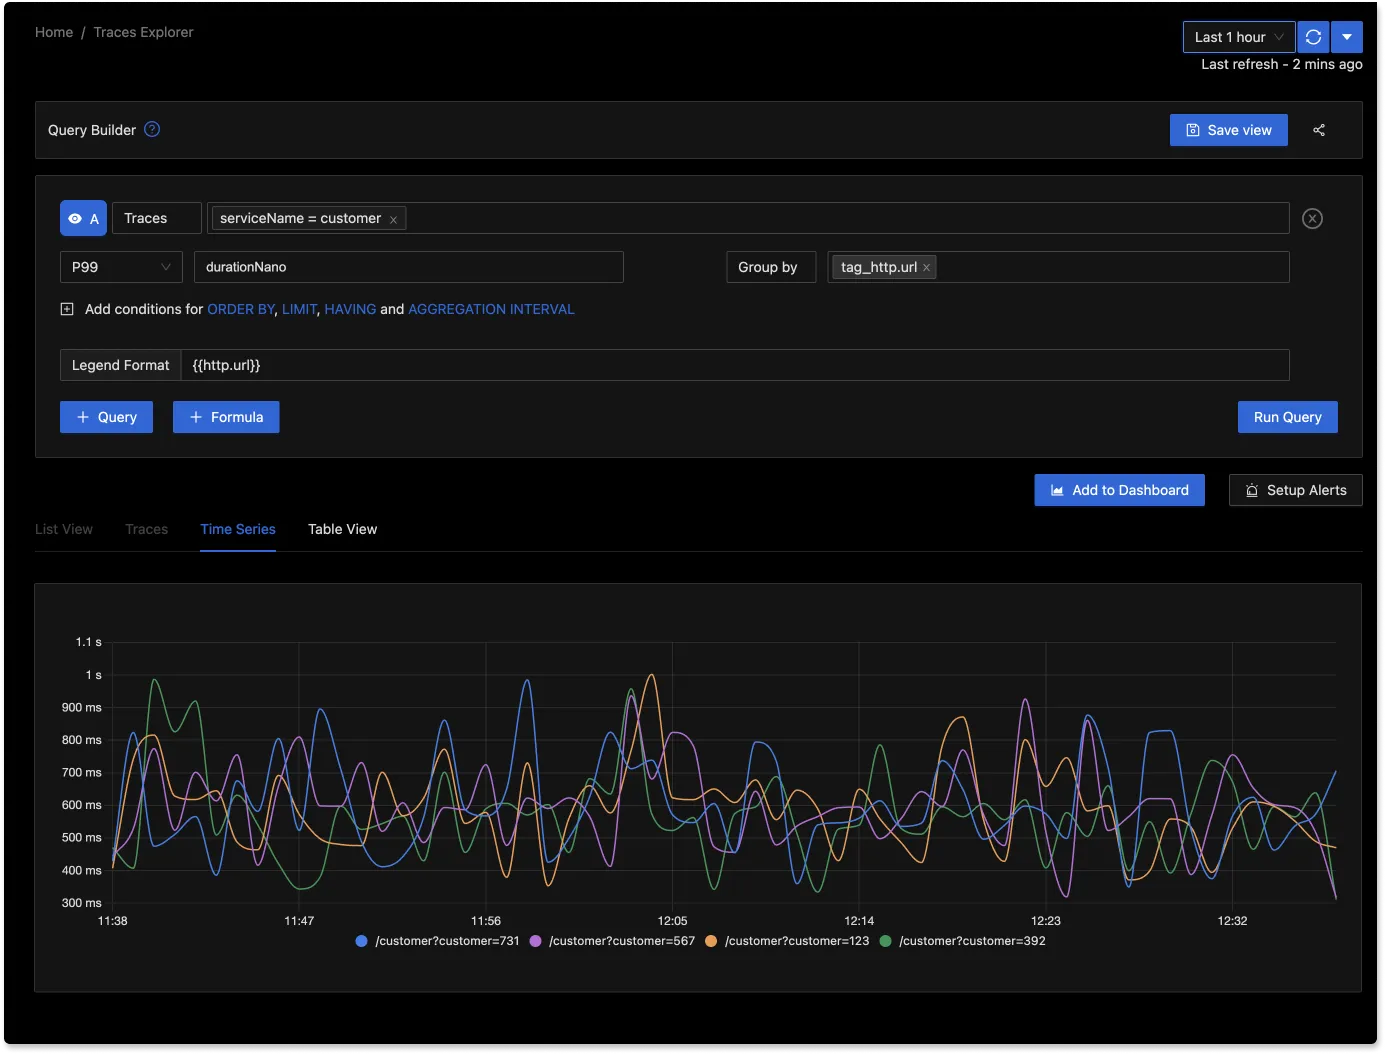
In production environments, trace exploration with queries proves invaluable. For instance, during a service outage, they become instrumental in troubleshooting.
Metrics Dashboard
OpenTelemetry provides a OpenTelemetry collector using which you can collect any kind of metrics and visualize it in an OpenTelemetry UI.
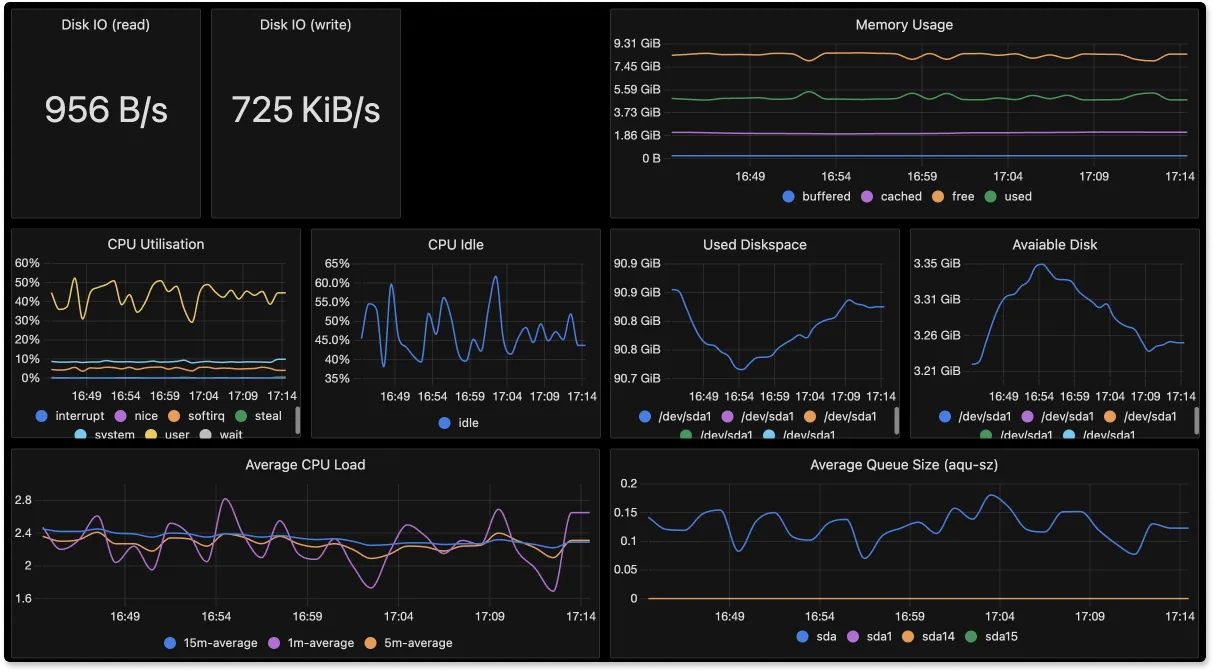
A metrics dashboard displays a collection of key performance indicators (KPIs) and metrics relevant to the system's health and performance. This can include metrics related to resource utilization (e.g. CPU, memory), network traffic, and application-specific metrics.
An OpenTelemetry UI should include visualization for a metrics dashboard, like a host metric and Kubernetes metrics dashboard.
- Host metrics dashboard
This dashboard provides a specialized view of performance indicators specific to the underlying host system. It captures crucial data related to the utilization of system resources, including CPU, memory utilization, disk usage, and network activity. These metrics are instrumental in fine-tuning resource allocation and uncovering possible performance constraints.
- Kubernetes metrics
Similar to the Host Metrics Dashboard, the Kubernetes Metrics Dashboard focuses on monitoring and analyzing performance metrics. However, it is specifically tailored to Kubernetes environments, which are commonly used for container orchestration. This offers detailed visibility at the container level, encompassing metrics concerning resource usage, health, and overall performance.
Logs
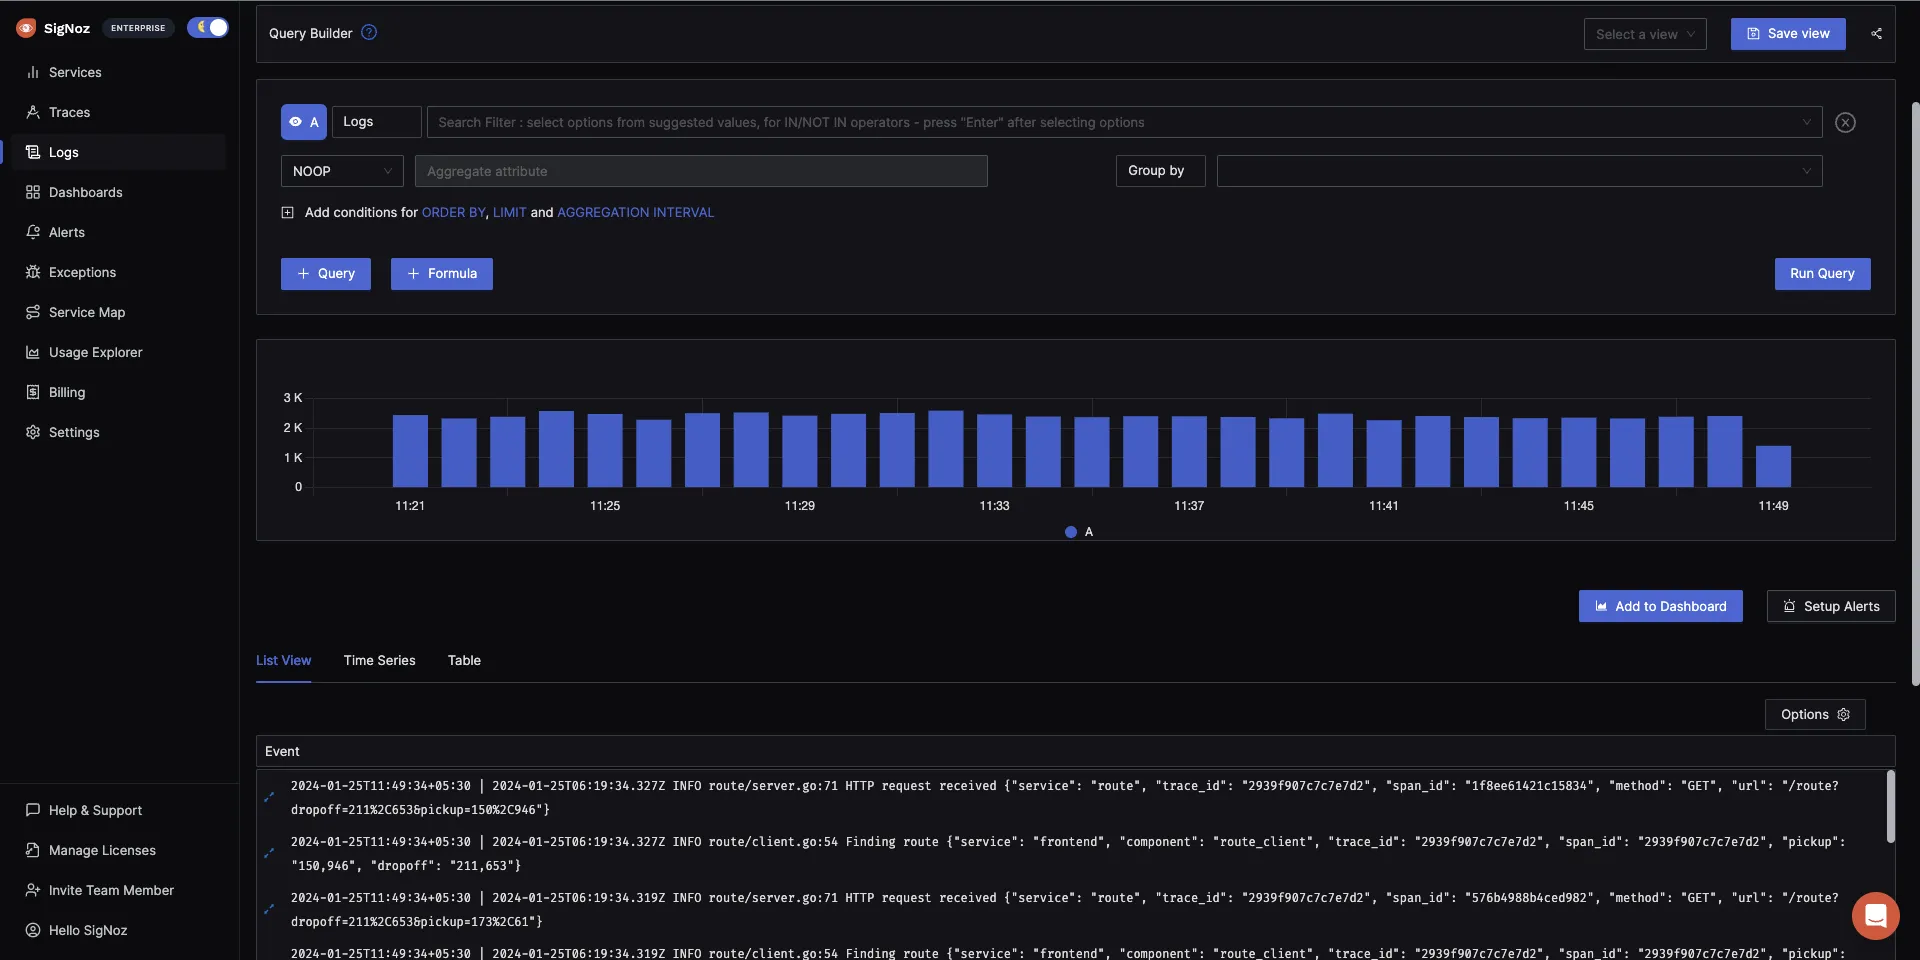
Logs provide a detailed record of events and activities within an application or system, providing in-depth insights into events, errors, and transactions, enabling effective troubleshooting and analysis.
An OpenTelemetry UI should include a logs visualization for the following benefits:
- Proactive System Health Monitoring: Through continuous log monitoring, potential system vulnerabilities and impending issues can be identified and addressed before they escalate into full-blown outages. This preemptive approach is crucial for maintaining uninterrupted service.
- Centralized Log View: A centralized view of logs from all components of a distributed system streamlines the process of issue identification and troubleshooting. This consolidated perspective offers a comprehensive overview of system activities.
- Dynamic Filtering and Rapid Search Capabilities: These capabilities allow developers to efficiently sift through logs, to precisely locate specific information even within large and extensive log datasets.
- Visual Data Representation: Visual representation aids in the identification of trends, patterns, and anomalies within the log data, enabling more detailed analysis.
You can choose any OpenTelemetry backend to send data to. Of course, our choice is SigNoz - an observability tool built natively on OpenTelemetry.
SigNoz - an open-source APM built natively for OpenTelemetry
SigNoz is an open-source full-stack APM tool that provides application metrics, distributed tracing, and logging capabilities, all under a single dashboard. You can also correlate these telemetry signals to debug your application issues quickly.
SigNoz is built to support OpenTelemetry natively, which is quietly becoming the world standard for generating and managing telemetry data.
Some of the things SigNoz can help you track:
- Out-of-the-box charts for application metrics like p90, p99, latency, error rates, request rates, etc.
- Distributed tracing to get end-to-end visibility of your services
- Monitor any metrics important to you, build dashboards for specific use cases
- Logs Management equipped with a powerful search and filter query builder
- Exceptions monitoring to track exceptions in your application
- Easy to set alerts with DIY query builder
Getting started with OpenTelemetry
To start with OpenTelemetry visualization, you first need to instrument your application code with OpenTelemetry client libraries. Opentelemetry also provides auto-instrumentation agents for some programming languages like Java. With auto-instrumentation, you can start to monitor your application with minimal code changes.
Below are the steps required to start with OpenTelemetry visualization:
- Instrument application code with language-specific OpenTelemetry libraries
- Configure OpenTelemetry Exporters to send data to SigNoz
- Visualize and analyze telemetry data using SigNoz dashboards
OpenTelemetry has language-specific instrumentation steps. You can explore our blog for specific instructions for different programming languages:
Getting started with SigNoz
SigNoz Cloud is the easiest way to run SigNoz. Sign up for a free account and get 30 days of unlimited access to all features.
You can also install and self-host SigNoz yourself since it is open-source. With 24,000+ GitHub stars, open-source SigNoz is loved by developers. Find the instructions to self-host SigNoz.
FAQs
Does OpenTelemetry have a UI?
No, OpenTelemetry itself doesn't provide a UI. OpenTelemetry is a collection of tools, APIs, and SDKs for generating and collecting telemetry data. For visualization, you need to use a separate backend and UI tool, such as SigNoz, Jaeger, or Zipkin.
What is the purpose of OpenTelemetry?
The main purpose of OpenTelemetry is to standardize the way telemetry data (metrics, traces, and logs) is generated, collected, and transmitted in distributed systems. It aims to make instrumentation consistent across various languages and frameworks, enabling better observability in complex, cloud-native environments.
What is telemetry in frontend?
In frontend development, telemetry refers to the collection of data about how users interact with a web application. This can include performance metrics (like page load times), user behavior data (like click patterns), and error reporting. Frontend telemetry helps developers understand user experience and application performance from the client-side perspective.
What is the difference between OpenTelemetry and Prometheus?
OpenTelemetry and Prometheus serve different purposes in the observability stack:
- OpenTelemetry is a standard for generating, collecting, and exporting telemetry data (metrics, traces, and logs).
- Prometheus is primarily a metrics collection and alerting system. It uses a pull-based model to scrape metrics from targets.
While OpenTelemetry can be used to collect metrics that Prometheus can scrape, it also handles traces and logs, which Prometheus does not.
What is the difference between Jaeger and OpenTelemetry collector?
- Jaeger is a distributed tracing system that can be used as a backend for storing and visualizing trace data.
- The OpenTelemetry Collector is a vendor-agnostic component that can receive, process, and export telemetry data to various backends, including Jaeger.
The OpenTelemetry Collector is more versatile as it can handle metrics and logs in addition to traces, and can send data to multiple backends simultaneously.
Who is behind OpenTelemetry?
OpenTelemetry is a Cloud Native Computing Foundation (CNCF) project. It was formed by merging the OpenCensus (from Google) and OpenTracing (from Uber) projects. It's now supported by a large community of contributors from various companies including Google, Microsoft, Lightstep, Splunk, and many others.
Is OpenTelemetry push or pull?
OpenTelemetry supports both push and pull models, depending on the signal type and configuration:
- For traces and logs, it typically uses a push model.
- For metrics, it can support both push and pull models, depending on the exporter configuration.
When to use OpenTelemetry?
You should consider using OpenTelemetry:
- When building or maintaining distributed systems or microservices architectures.
- When you need a standardized way to instrument your applications across different languages and frameworks.
- When you want to future-proof your observability strategy and avoid vendor lock-in.
- When you need comprehensive observability data (metrics, traces, and logs) from your applications.
What are the cons of OpenTelemetry?
While OpenTelemetry offers many benefits, some potential drawbacks include:
- Learning curve: It can be complex to set up and configure, especially for large systems.
- Overhead: Instrumentation can add some performance overhead, though it's generally minimal.
- Evolving standard: As it's still evolving, there might be changes or inconsistencies across different language implementations.
- Requires additional tools: OpenTelemetry doesn't provide storage or visualization, so you need to integrate with other tools.
What is the difference between telemetry and OpenTelemetry?
- Telemetry is a general term referring to the collection of measurements or other data at remote points and their automatic transmission to receiving equipment for monitoring.
- OpenTelemetry is a specific, open-source framework and standard for generating, collecting, and exporting telemetry data. It provides a standardized way to implement telemetry in software systems.
Is OpenTelemetry free?
Yes, OpenTelemetry is free and open-source. It's released under the Apache 2.0 license. However, some backends or visualization tools you might use with OpenTelemetry may have associated costs.
What is the main purpose of telemetry?
The main purpose of telemetry is to collect data about the performance, usage, and behavior of systems or applications, often from remote or inaccessible locations. This data is used for monitoring, troubleshooting, optimization, and making informed decisions about system management and development.
What is the difference between OpenTelemetry and OpenTracing?
OpenTracing was one of the precursor projects to OpenTelemetry, focusing specifically on distributed tracing. OpenTelemetry is a more comprehensive project that:
- Covers metrics and logs in addition to traces.
- Provides a more complete set of tools and APIs for instrumentation.
- Is actively developed and supported by the CNCF, while OpenTracing is now in maintenance mode.
How to visualize OpenTelemetry data?
To visualize OpenTelemetry data:
- Choose a compatible backend system (e.g., SigNoz, Jaeger, Zipkin, Prometheus).
- Configure your OpenTelemetry Collector or SDK to export data to this backend.
- Use the UI provided by your chosen backend to view and analyze the data.
- Alternatively, you can use general-purpose visualization tools like Grafana, which can connect to various data sources.
Which of the following are features of OpenTelemetry?
Key features of OpenTelemetry include:
- Support for multiple languages and frameworks
- Standardized data collection for metrics, traces, and logs
- Vendor-agnostic design
- Automatic instrumentation capabilities
- Flexible data export options
- Support for custom instrumentation
- Sampling and data processing capabilities
Further Reading
