Using OpenTelemetry Collector Loki Receiver to Send Logs to SigNoz [Code Tutorial]
In this tutorial, you will learn how to collect logs using the Loki receiver in OpenTelemetry Collector to send logs to SigNoz. If you’re using Promtail to collect logs, you can send them to SigNoz instead of Loki via the OpenTelemetry Collector.
In this tutorial, we cover:
- What is OpenTelemetry Collector?
- How does OpenTelemetry Collector collect data?
- Collecting logs with Loki receiver in OpenTelemetry Collector
- Prerequisites
- Setting up SigNoz
- Setting up the sample Flask application for logs
- Setting up OpenTelemetry Collector
- Configuring Promtail
- Visualizing Loki logs with the SigNoz dashboard
- Setting up alerts
- Conclusion
If you want to jump straight into implementation, start with this prerequisites section.
Loki is an open-source log aggregation tool developed by Grafana Labs. It is inspired by Prometheus and is designed to be cost-effective and easy to operate. But Loki also has some limitations. Loki is designed to keep indexing low. It does not support high cardinality. For example, if you create a label for the user's IP address, you will have thousands of log streams, as every user will have a unique IP. This can make Loki very slow as it requires building a huge index.
Instead of Loki, you can use SigNoz. It uses ClickHouse as a database and is much more efficient in storing and querying log data.
Logs Performance Benchmark: SigNoz vs Elastic vs Loki
OpenTelemetry collector is a crucial component of the OpenTelemetry ecosystem. Let’s have a brief overview of the OpenTelemetry Collector.
What is OpenTelemetry Collector?
OpenTelemetry Collector is a stand-alone service provided by OpenTelemetry. It can be used as a telemetry-processing system with a lot of flexible configurations that gather and process observability data, such as traces, metrics, and logs, from different parts of a software system. It then sends this data to chosen destinations, allowing for centralized analysis and monitoring. The Collector simplifies the task of collecting and exporting telemetry data in cloud-native environments.
How does OpenTelemetry Collector collect data?
Data collection in OpenTelemetry Collector is facilitated through receivers. Receivers are configured via YAML under the top-level receivers tag. To ensure a valid configuration, at least one receiver must be enabled.
Below is an example of an otlp receiver:
receivers:
  otlp:
    protocols:
      grpc:
      http:
The OTLP receiver accepts data in the OTLP format through gRPC or HTTP. There are advanced configurations that you can enable via the YAML file.
Once a receiver is configured, it needs to be enabled to start the data flow. This involves setting up pipelines within a service. A pipeline acts as a streamlined pathway for data, outlining how it should be processed and where it should go. A pipeline comprises of the following:
Below is an example pipeline configuration:
service:
  pipelines:
    metrics:
      receivers: [otlp, httpcheck]
      processors: [batch]
      exporters: [otlp]
Collecting logs with Loki receiver in OpenTelemetry Collector
The Loki receiver in the OpenTelemetry collector implements the Loki push API. To send data to OpenTelemetry Collector, you need to configure your Promtail to send logs to the collector and enable the Loki receiver in OpenTelemetry Collector.
To demonstrate the entire setup, we’re using a sample flask app that generates logs and saves them in a local file. Promtail is used to collect logs from this file.
Let’s get into the demo.
Prerequisites
- A sample Flask app that generates logs
- A SigNoz cloud account
Setting up SigNoz
You need a backend to which you can send the collected data for monitoring and visualization. SigNoz is an OpenTelemetry-native APM that is well-suited for visualizing OpenTelemetry data.
SigNoz cloud is the easiest way to run SigNoz. You can sign up here for a free account and get 30 days of unlimited access to all features.
You can also install and self-host SigNoz yourself. Check out the docs for installing self-host SigNoz.
Setting up the sample Flask application for logs
To run the Flask application in the background and capture its logs in a designated file, you can use the following command:
nohup python app.py > flask.log 2>&1 &
This command initiates the Flask application in the background and redirects all generated logs to a file named flask.log.
Note down the path where this file exists.
Setting up OpenTelemetry Collector
The OpenTelemetry Collector offers various deployment options to suit different environments and preferences. It can be deployed using Docker, Kubernetes, Nomad, or directly on Linux systems. You can find all the installation options here. For this article, the OpenTelemetry Collector will be installed manually.
We are assuming that the OpenTelemetry Collector will be installed on the same host as your Promtail server for this tutorial.
Download the OpenTelemetry Collector
Download the appropriate binary package for your Linux or macOS distribution from the OpenTelemetry Collector releases page. We are using the latest version available at the time of writing this tutorial.
curl --proto '=https' --tlsv1.2 -fOL https://github.com/open-telemetry/opentelemetry-collector-releases/releases/download/v0.89.0/otelcol-contrib_0.89.0_darwin_arm64.tar.gz
For macOS users, download the binary package specific to your system.
| Build   | Architecture   |
| ------- | -------------- |
| M1 Chip | arm64          |
| Intel   | amd64 (x86-64) |
Extract the package
Create a new directory named otelcol-contrib and then extract the contents of the otelcol-contrib_0.89.0_darwin_arm64.tar.gz archive into this newly created directory with the following command:
mkdir otelcol-contrib && cd otelcol-contrib
Extract the contents of the binary package in that directory:
tar xvzf otelcol-contrib_0.89.0_darwin_arm64.tar.gz -C otelcol-contrib
Set up the Configuration file:
In the same otelcol-contrib directory, create a config.yaml file:
touch config.yaml
Paste the below config into the file:
# Receivers for the OpenTelemetry Collector
receivers:
  otlp:
    protocols:
      grpc: {} # gRPC protocol for the OTLP receiver
      http: {}  # HTTP protocol for the OTLP receiver
  loki:
    protocols:
      http:
        endpoint: "0.0.0.0:3100" # Endpoint for the Loki receiver
    use_incoming_timestamp: true # Whether to use the incoming timestamp for the Loki receiver

# Processors for the OpenTelemetry Collector
processors:
  batch:
    send_batch_size: 1000 # Size of the batches to send
    timeout: 10s # Timeout for the batch processor

  memory_limiter:
    check_interval: 5s
    limit_mib: 4000
    spike_limit_mib: 500

# Exporters for the OpenTelemetry Collector
exporters:
  otlp:
    endpoint: "ingest.{region}.signoz.cloud:443"
    tls:
      insecure: false
    timeout: 20s # Adjust the timeout value as needed
    headers:
      "signoz-ingestion-key": "<SIGNOZ_INGESTION_KEY>"

# Service configuration for the OpenTelemetry Collector
service:
  telemetry:
    logs:
      level: debug
      initial_fields:
        service: loki
  pipelines:
    logs:
      receivers: [otlp, loki] # Receivers to use for the logs pipeline
      processors: [batch] # Processors to use for the logs pipeline
      exporters: [otlp] # Exporters to use for the logs pipeline
We have configured the Loki receiver to listen for log entries at the endpoint: 0.0.0.0:3100.
The Loki receiver is a component of the OpenTelemetry Collector designed to receive logs in the Loki format and transform them into the OTLP format. This allows the OpenTelemetry Collector to process and export logs in a standardized format.
The Loki receiver essentially acts as a bridge between Promtail and the OpenTelemetry Collector.
It receives logs from Promtail, transforms them from the Loki format to the OTLP format, and then passes them to the OpenTelemetry Collector for further processing and exporting to SigNoz. You can find more information on the OpenTelemetry Loki receiver here.
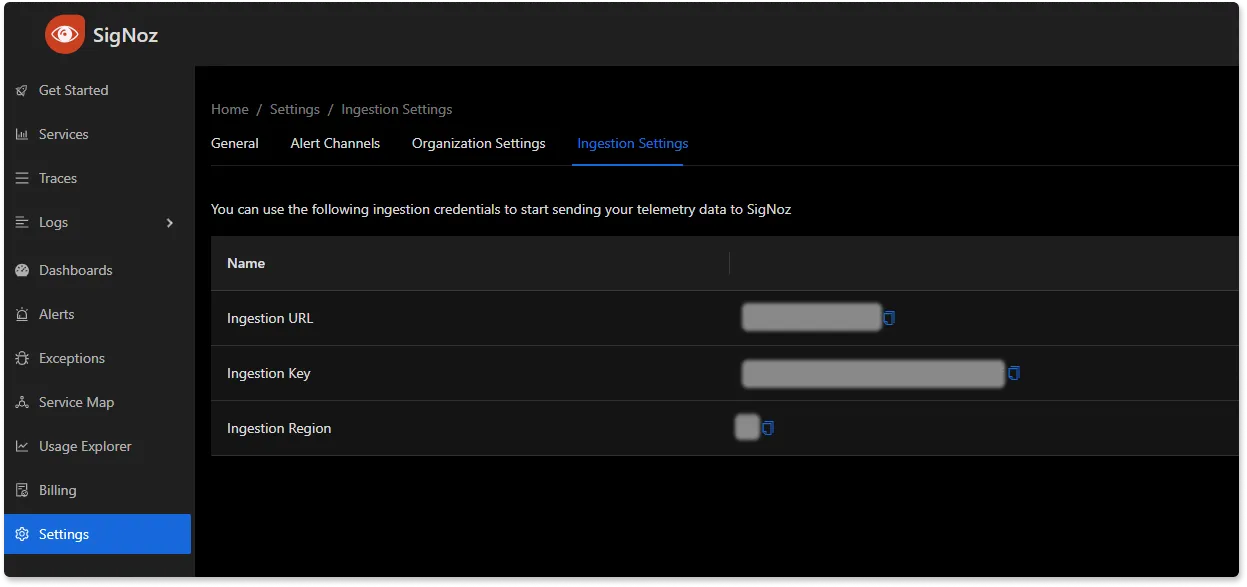
Replace {region} with the region for your SigNoz cloud account and <SIGNOZ_INGESTION_KEY> with the ingestion key for your account. You can find these settings in the SigNoz dashboard under Settings > Ingestion Settings.
Run the Collector service
In the same otelcol-contrib directory, run the below command to start the Collector service:
./otelcol-contrib --config ./config.yaml
You should receive a similar output to show it has started successfully:
./otelcol-contrib --config ./config.yaml
2023-12-06T03:49:57.218+0100    info    service@v0.89.0/telemetry.go:85 Setting up own telemetry...     {"service": "loki"}
2023-12-06T03:49:57.221+0100    info    service@v0.89.0/telemetry.go:202        Serving Prometheus metrics      {"service": "loki", "address": ":8888", "level": "Basic"}
2023-12-06T03:49:57.221+0100    debug   exporter@v0.89.0/exporter.go:273        Beta component. May change in the future.       {"service": "loki", "kind": "exporter", "data_type": "logs", "name": "otlp"}
2023-12-06T03:49:57.222+0100    debug   processor@v0.89.0/processor.go:287      Stable component.       {"service": "loki", "kind": "processor", "name": "batch", "pipeline": "logs"}
2023-12-06T03:49:57.222+0100    debug   receiver@v0.89.0/receiver.go:294        Beta component. May change in the future.       {"service": "loki", "kind": "receiver", "name": "otlp", "data_type": "logs"}
2023-12-06T03:49:57.223+0100    debug   receiver@v0.89.0/receiver.go:294        Alpha component. May change in the future.      {"service": "loki", "kind": "receiver", "name": "loki", "data_type": "logs"}
2023-12-06T03:49:57.223+0100    info    service@v0.89.0/service.go:143  Starting otelcol-contrib...     {"service": "loki", "Version": "0.89.0", "NumCPU": 12}
2023-12-06T03:49:57.224+0100    info    extensions/extensions.go:34     Starting extensions...  {"service": "loki"}
2023-12-06T03:49:57.224+0100    info    zapgrpc/zapgrpc.go:178  [core] [Channel #1] Channel created     {"service": "loki", "grpc_log": true}
2023-12-06T03:49:57.224+0100    info    zapgrpc/zapgrpc.go:178  [core] [Channel #1] original dial target is: "ingest.in.signoz.cloud:443"       {"service": "loki", "grpc_log": true}
2023-12-06T03:49:57.224+0100    info    zapgrpc/zapgrpc.go:178  [core] [Channel #1] parsed dial target is: {URL:{Scheme:ingest.in.signoz.cloud Opaque:443 User: Host: Path: RawPath: OmitHost:false ForceQuery:false RawQuery: Fragment: RawFragment:}}      {"service": "loki", "grpc_log": true}
2023-12-06T03:49:57.224+0100    info    zapgrpc/zapgrpc.go:178  [core] [Channel #1] fallback to scheme "passthrough"    {"service": "loki", "grpc_log": true}
2023-12-06T03:49:57.224+0100    info    zapgrpc/zapgrpc.go:178  [core] [Channel #1] parsed dial target is: {URL:{Scheme:passthrough Opaque: User: Host: Path:/ingest.in.signoz.cloud:443 RawPath: OmitHost:false ForceQuery:false RawQuery: Fragment: RawFragment:}} {"service": "loki", "grpc_log": true}
2023-12-06T03:49:57.224+0100    info    zapgrpc/zapgrpc.go:178  [core] [Channel #1] Channel authority set to "ingest.in.signoz.cloud:443"       {"service": "loki", "grpc_log": true}
Configuring Promtail
If you already have promtail running, skip to setting up the configuration file.
Download Promtail
Run the following commands to download, unzip, and grant executable permissions to the Promtail binary file. Ensure you have the latest version; at the time of this article, it's v2.8.6. Check the official GitHub page for the most recent release.
curl -LO https://github.com/grafana/loki/releases/download/v2.8.6/promtail-darwin-amd64.zip
unzip promtail-darwin-amd64.zip -d /Users/deimos/Desktop/Loki-Promtail
chmod a+x "promtail-darwin-amd64"
For macOS users, download the binary package specific to your system.
| Build   | Architecture   |
| ------- | -------------- |
| M1 Chip | arm64          |
| Intel   | amd64 (x86-64) |
Setting up the Configuration file
In your directory, create a config file for Promtail:
touch promtail-local-config.yaml
In the configuration file, you will configure an endpoint to which Promtail will push log entries. Here, we will push logs to http://localhost:3100/loki/api/v1/push. This is the endpoint for which we have enabled the Loki receiver in the OpenTelemetry Collector.
We will be installing the OpenTelemetry Collector on the same host, and hence, we can push the log entries to a localhost endpoint.
Paste the below contents into the file:
# Promtail server configuration
server:
  http_listen_address: 127.0.0.1
  http_listen_port: 9080 # Port for Promtail to listen on
  grpc_listen_port: 0    # Port for Promtail to listen on for gRPC. Set to 0 to disable gRPC.

# Position file for Promtail to keep track of the position in the logs files
positions:
  filename: /tmp/positions.yaml

# Clients to send logs to.
clients:
  - url: http://localhost:3100/loki/api/v1/push

# Configuration for scraping logs from the host system
scrape_configs:
  - job_name: system
    static_configs:
    - targets:
        - localhost # Target to scrape logs from. In this case, it's the local system
      labels:
        job: varlogs # Label for the logs. Useful for linking metrics and logs
        __path__:  /var/log/*log # Path to the log files to scrape

  - job_name: flask-app
    static_configs:
    - targets:
        - localhost:5000
      labels:
        job: flasklogs # Label for the logs. Useful for linking metrics and logs
        __path__:  /Users/deimos/Desktop/Loki-Promtail/flask.log # Path to the log files to scrape
The provided configuration file defines the settings for a Promtail server. It outlines the server’s listening ports, position file location, log clients, and log scraping configurations. In this config file, Promtail scrapes logs from two targets, the local system and the Flask application. It then sends the scraped logs to the Loki receiver, a component of the OpenTelemetry Collector, at the endpoint http://localhost:3100/loki/api/v1/push. This is the endpoint that the Loki receiver exposes for receiving logs. You can get more information on this in the Loki docs.
Replace the /Users/deimos/Desktop/Loki-Promtail/flask.log with the correct path on your system where the flask.log file is located.
Start Promtail with the below command:
./promtail-darwin-amd64 -config.file=promtail-local-config.yaml
Run this command in the directory where Promtail was extracted to
To see Promtail running, visit http://localhost:9080/targets on your browser.
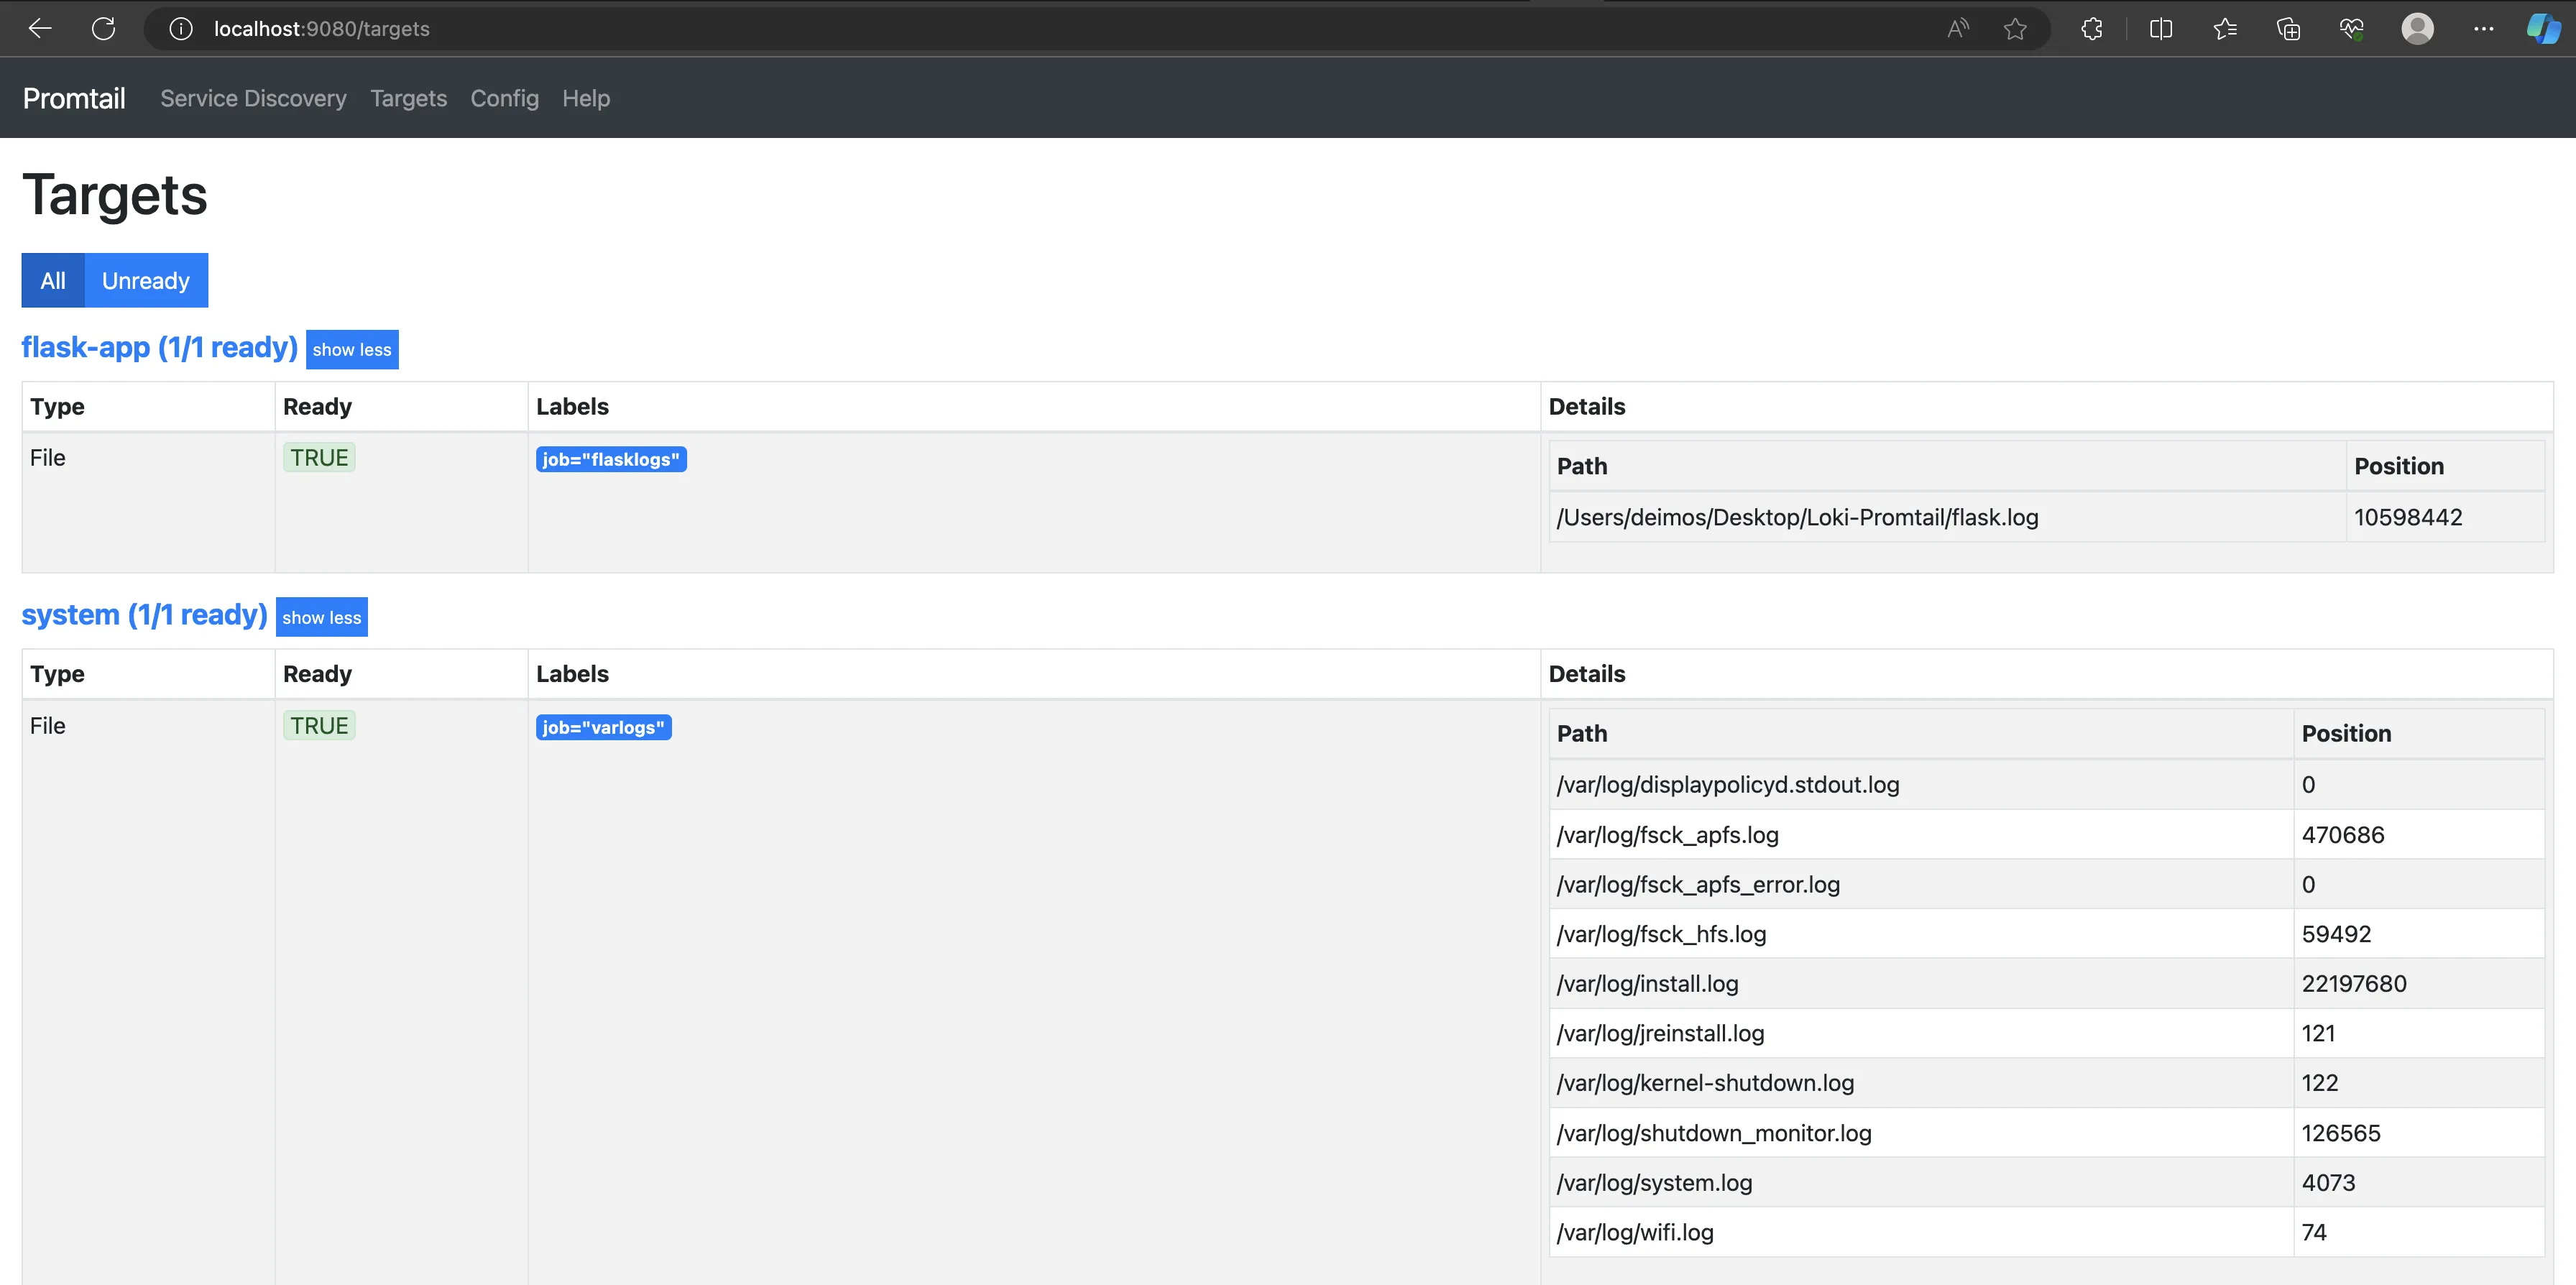
The above image shows that Promtail is running and scraping logs from the specified targets.
Visualizing Loki logs with the SigNoz dashboard
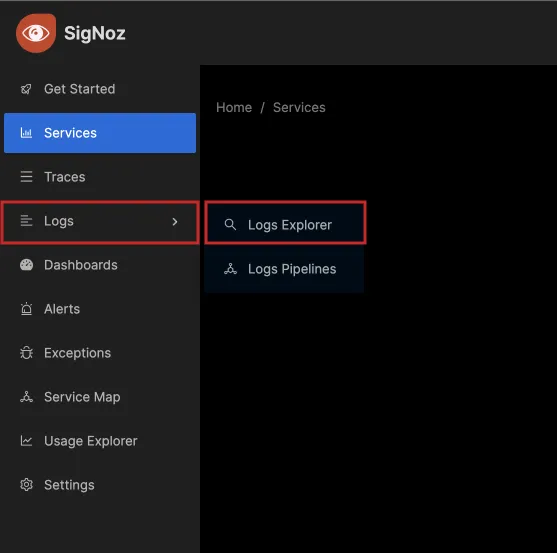
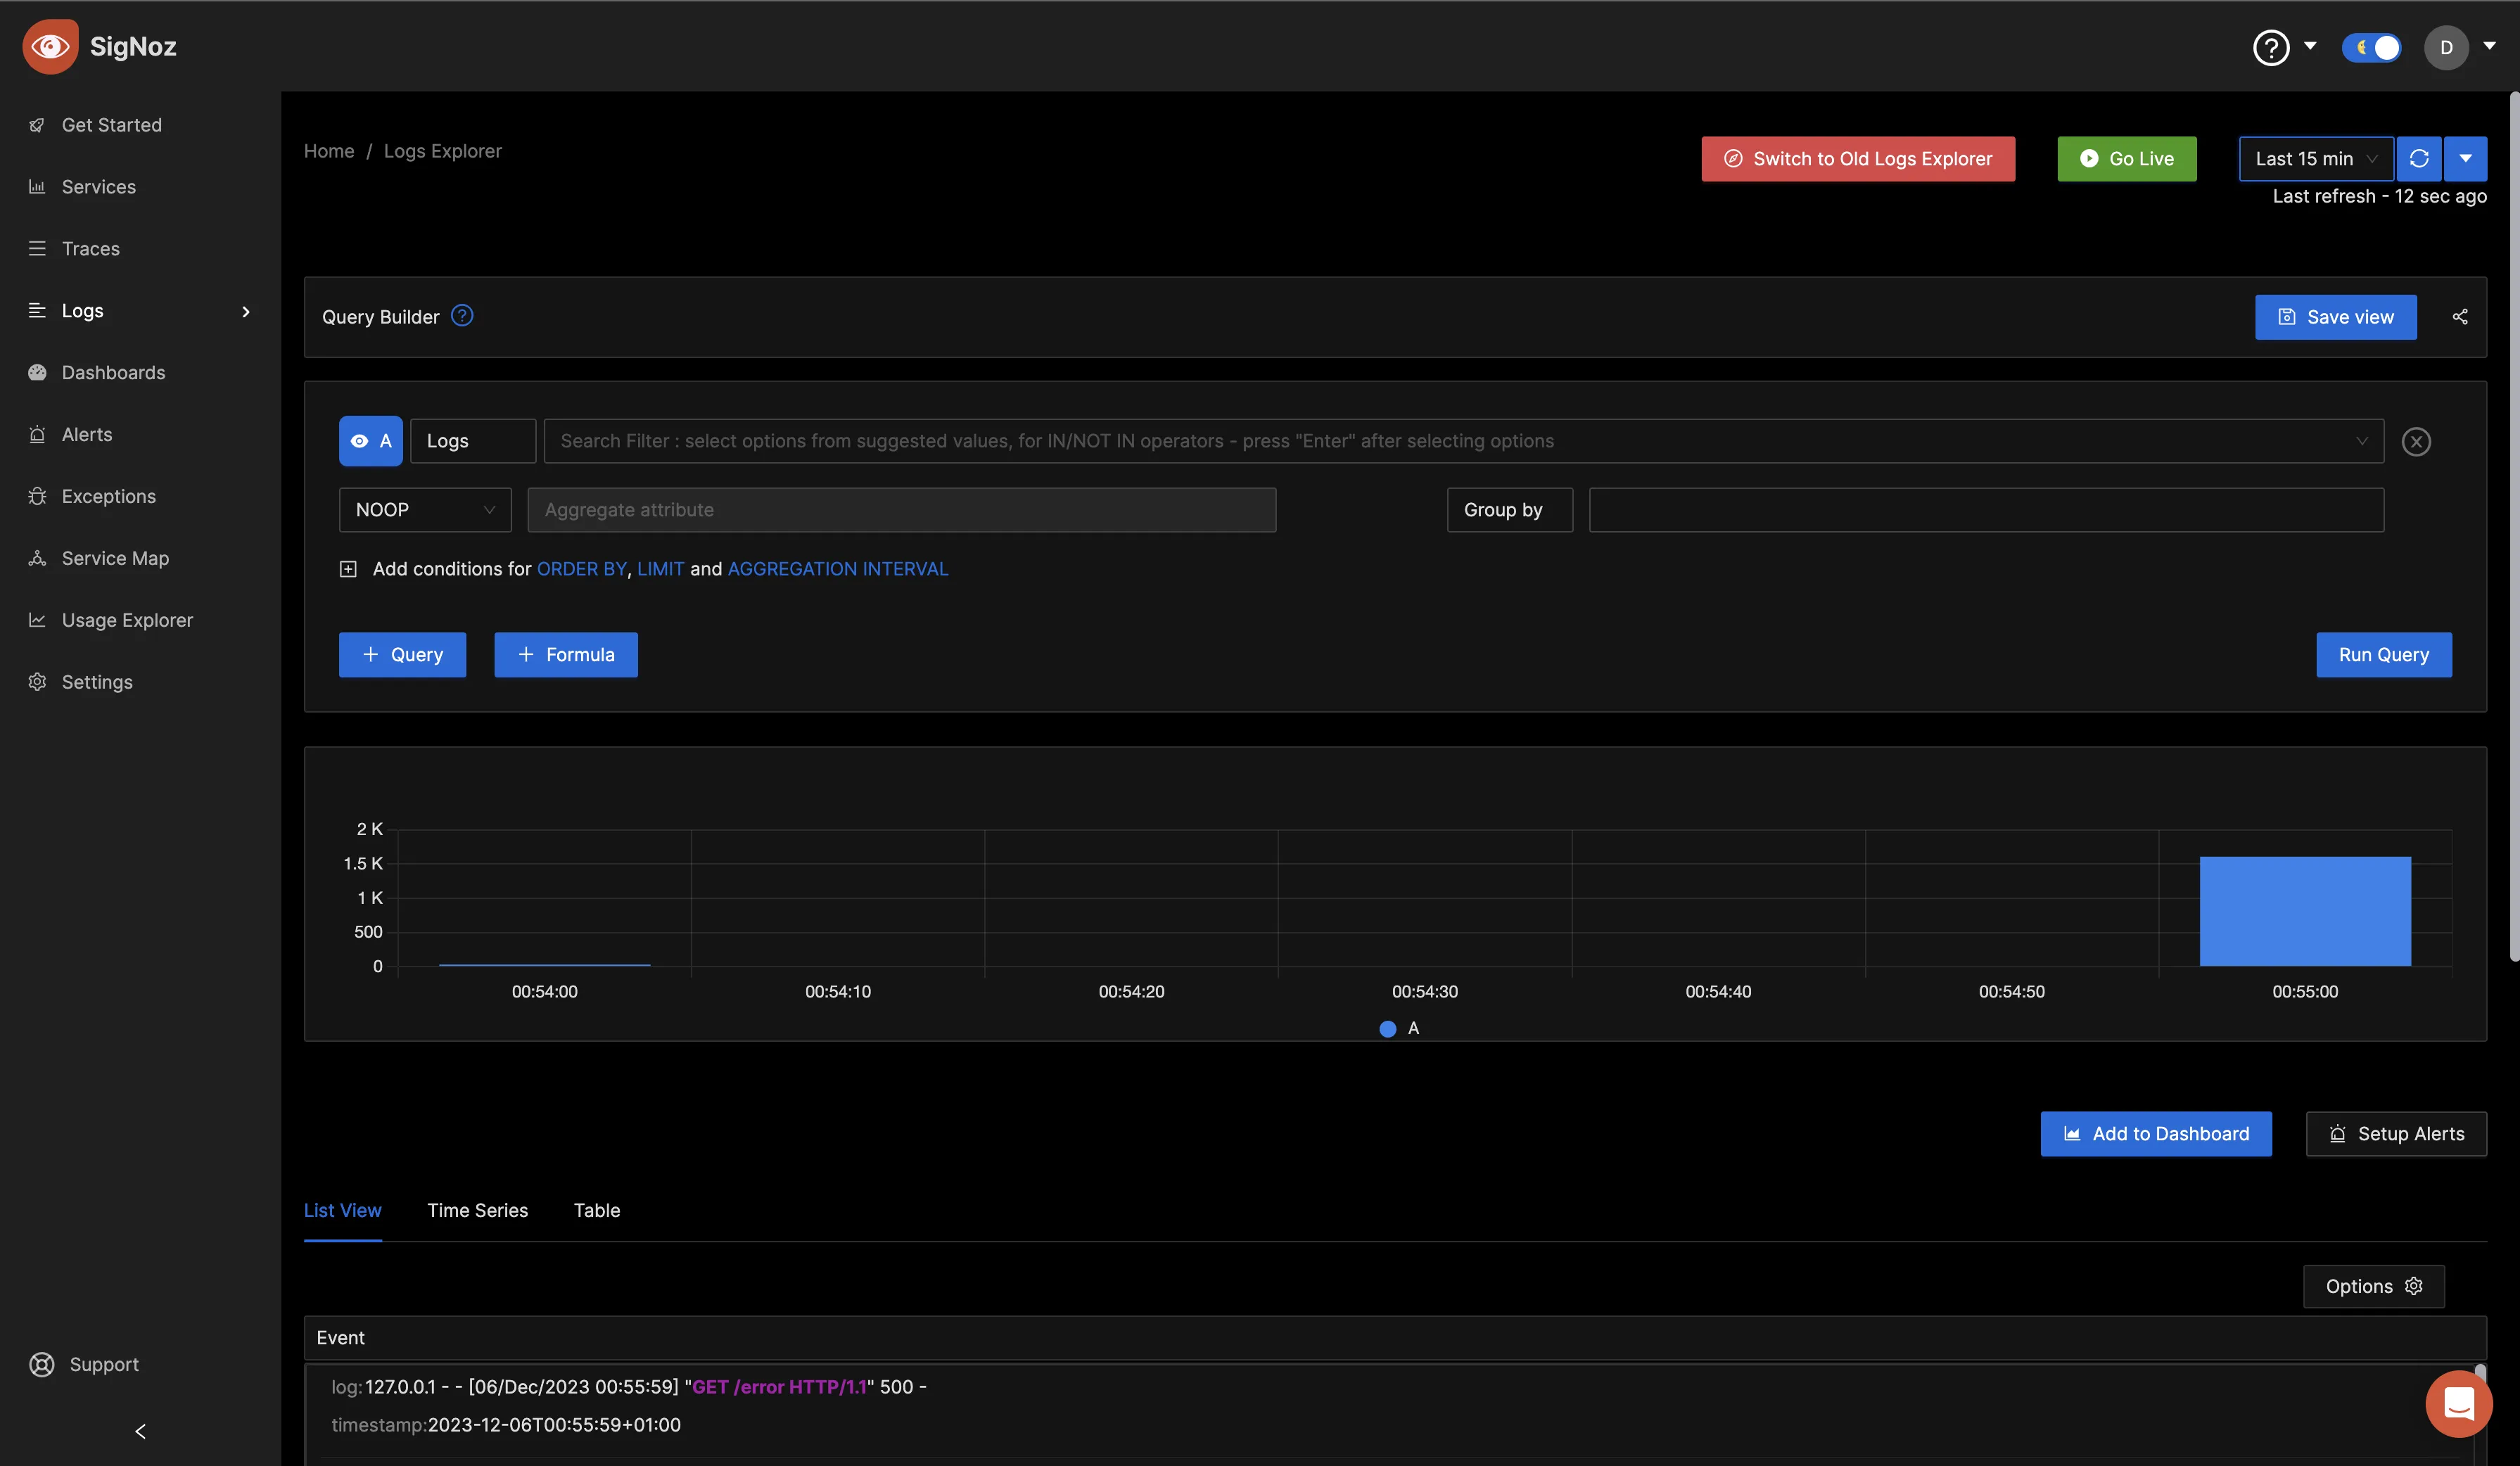
Once the Collector service has been started successfully, navigate to your SigNoz Cloud account and access the “Logs tab” and click on “Logs Explorer”.
Verify that the OpenTelemetry Collector is sending the collected logs to your SigNoz cloud account.
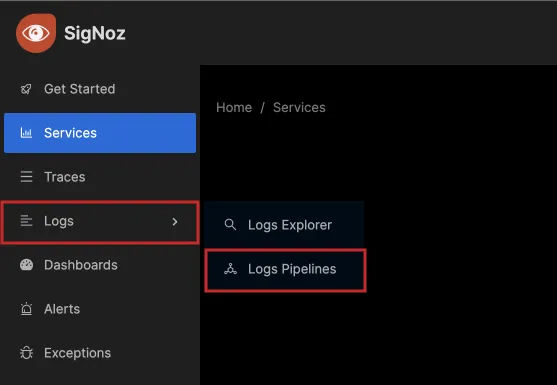
Once confirmed that logs are being received, go back to the “Logs” tab and click on “Logs Pipelines”.
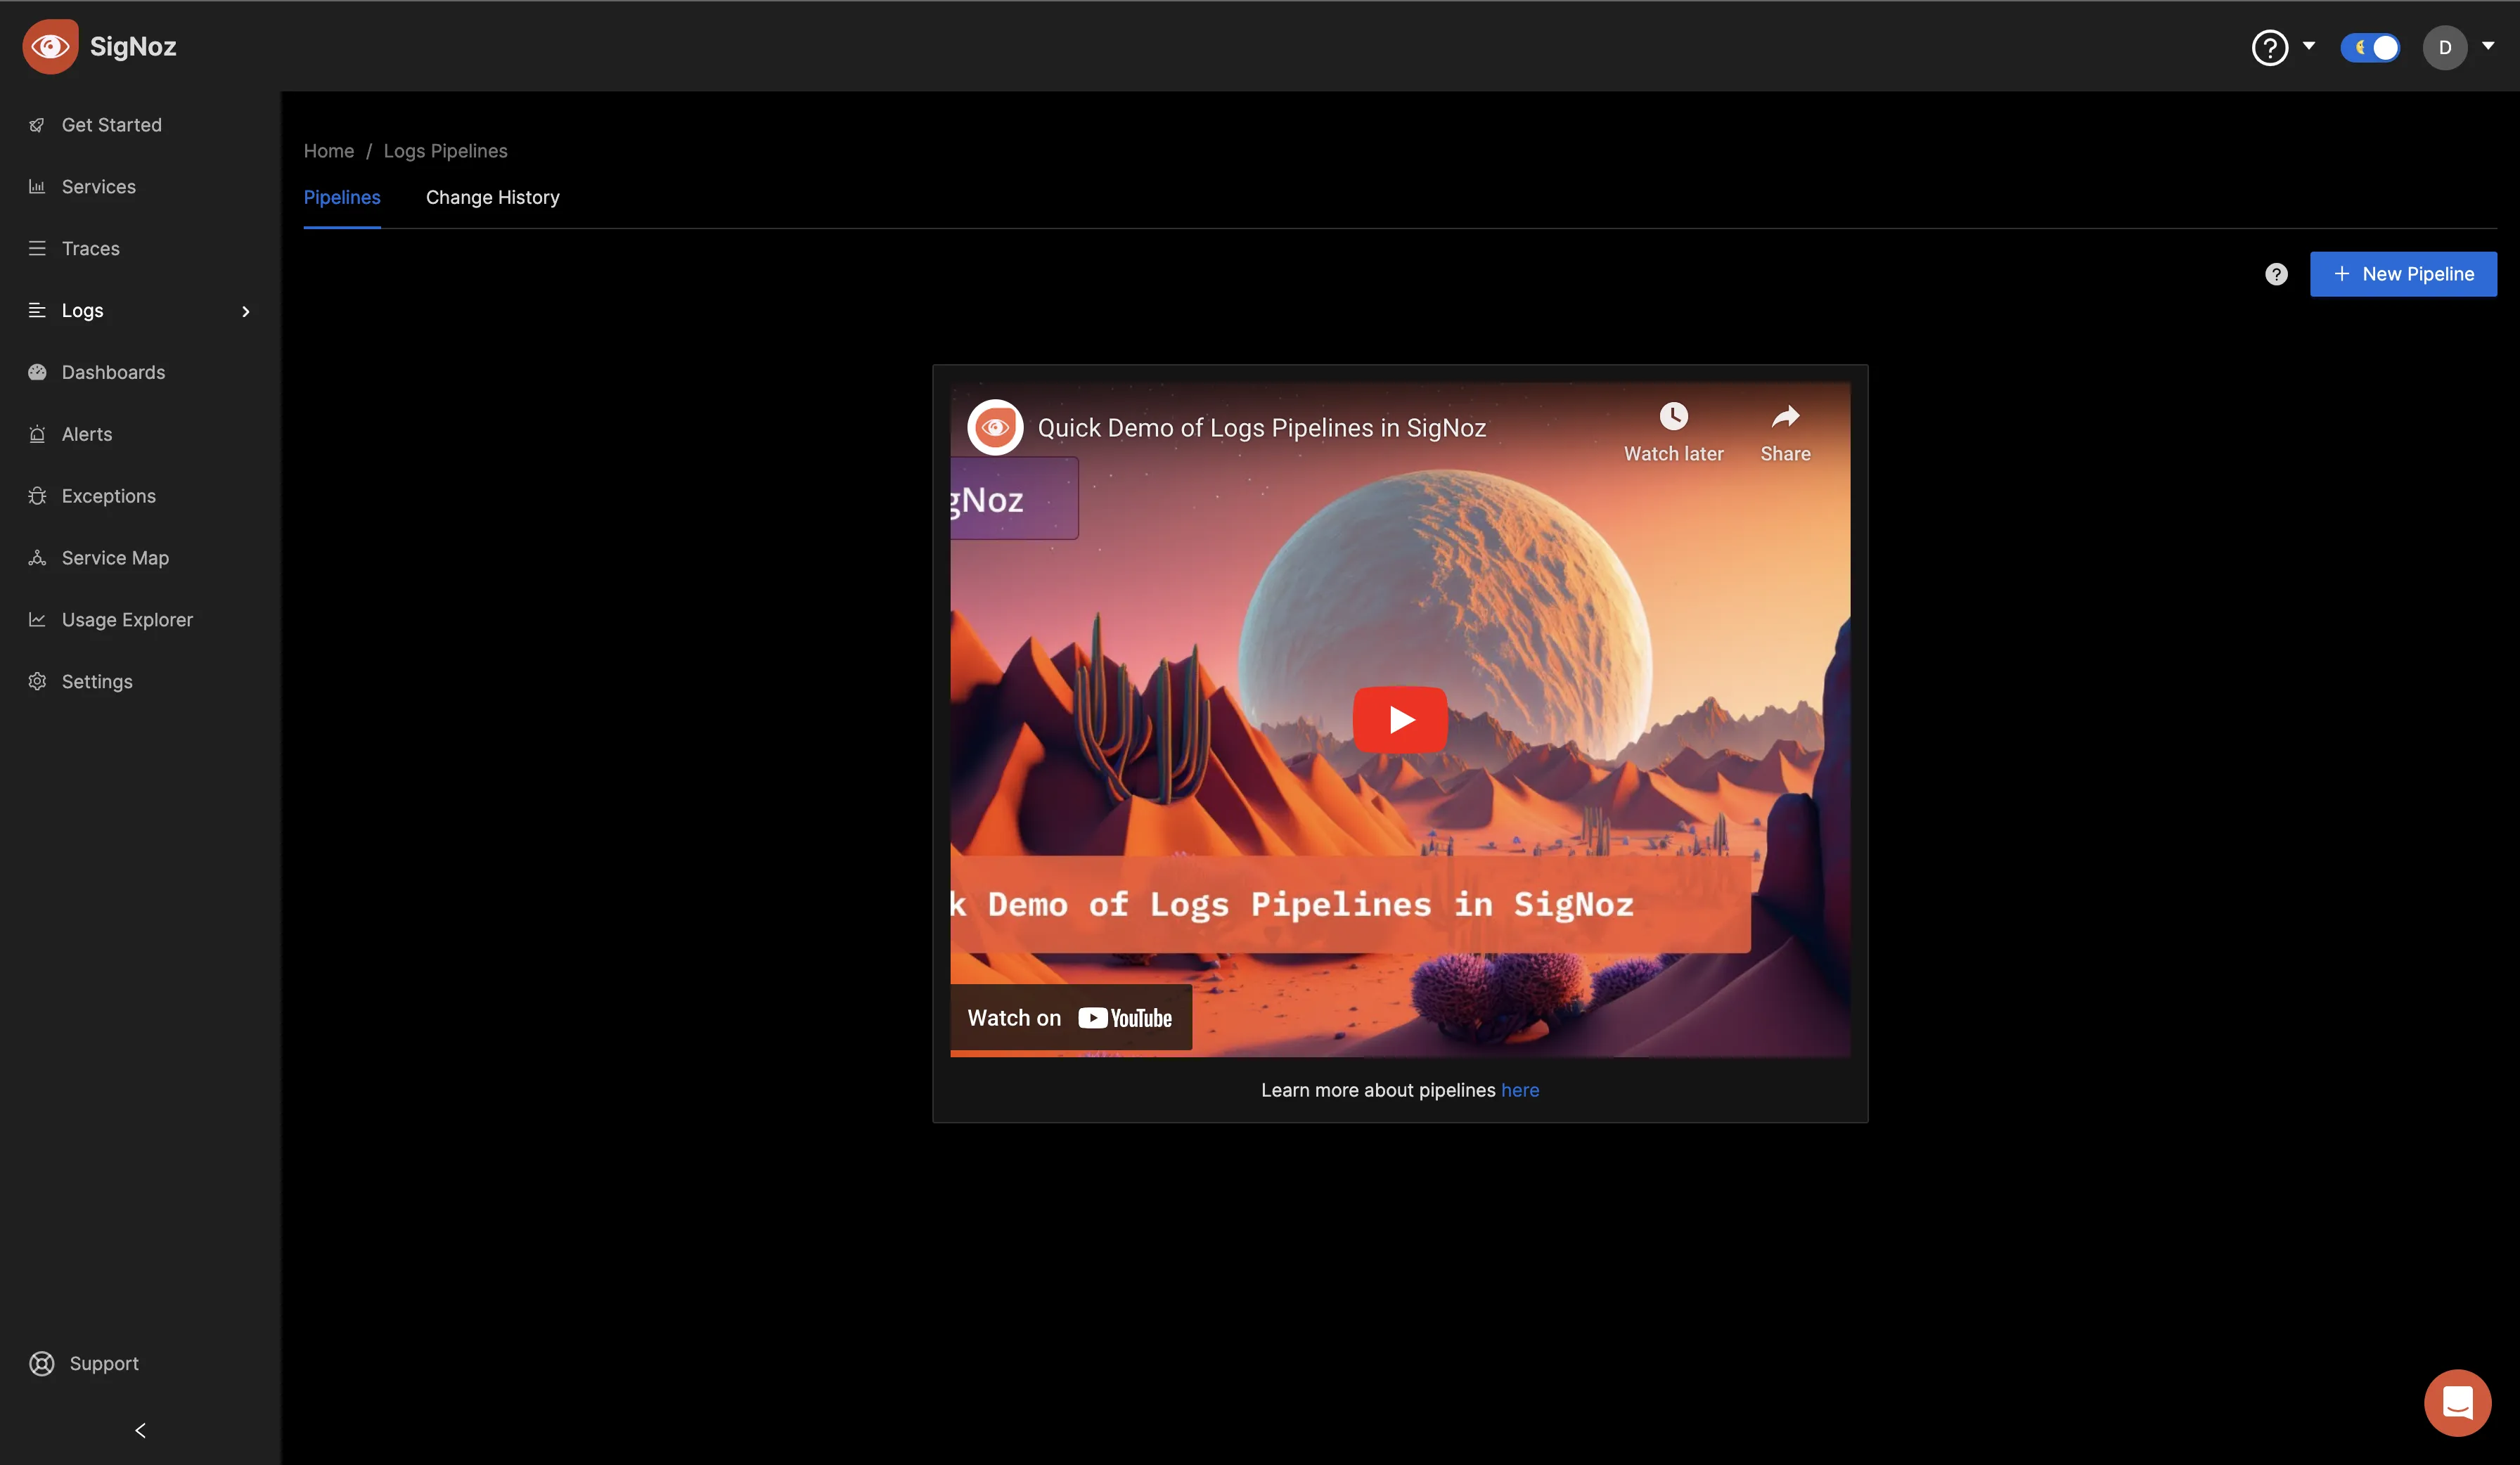
Logs Pipelines are a set of rules for transforming logs before they get stored in the database. They allow you to preprocess your logs to suit your querying and aggregation needs. You can learn more about Logs pipelines in the SigNoz docs.
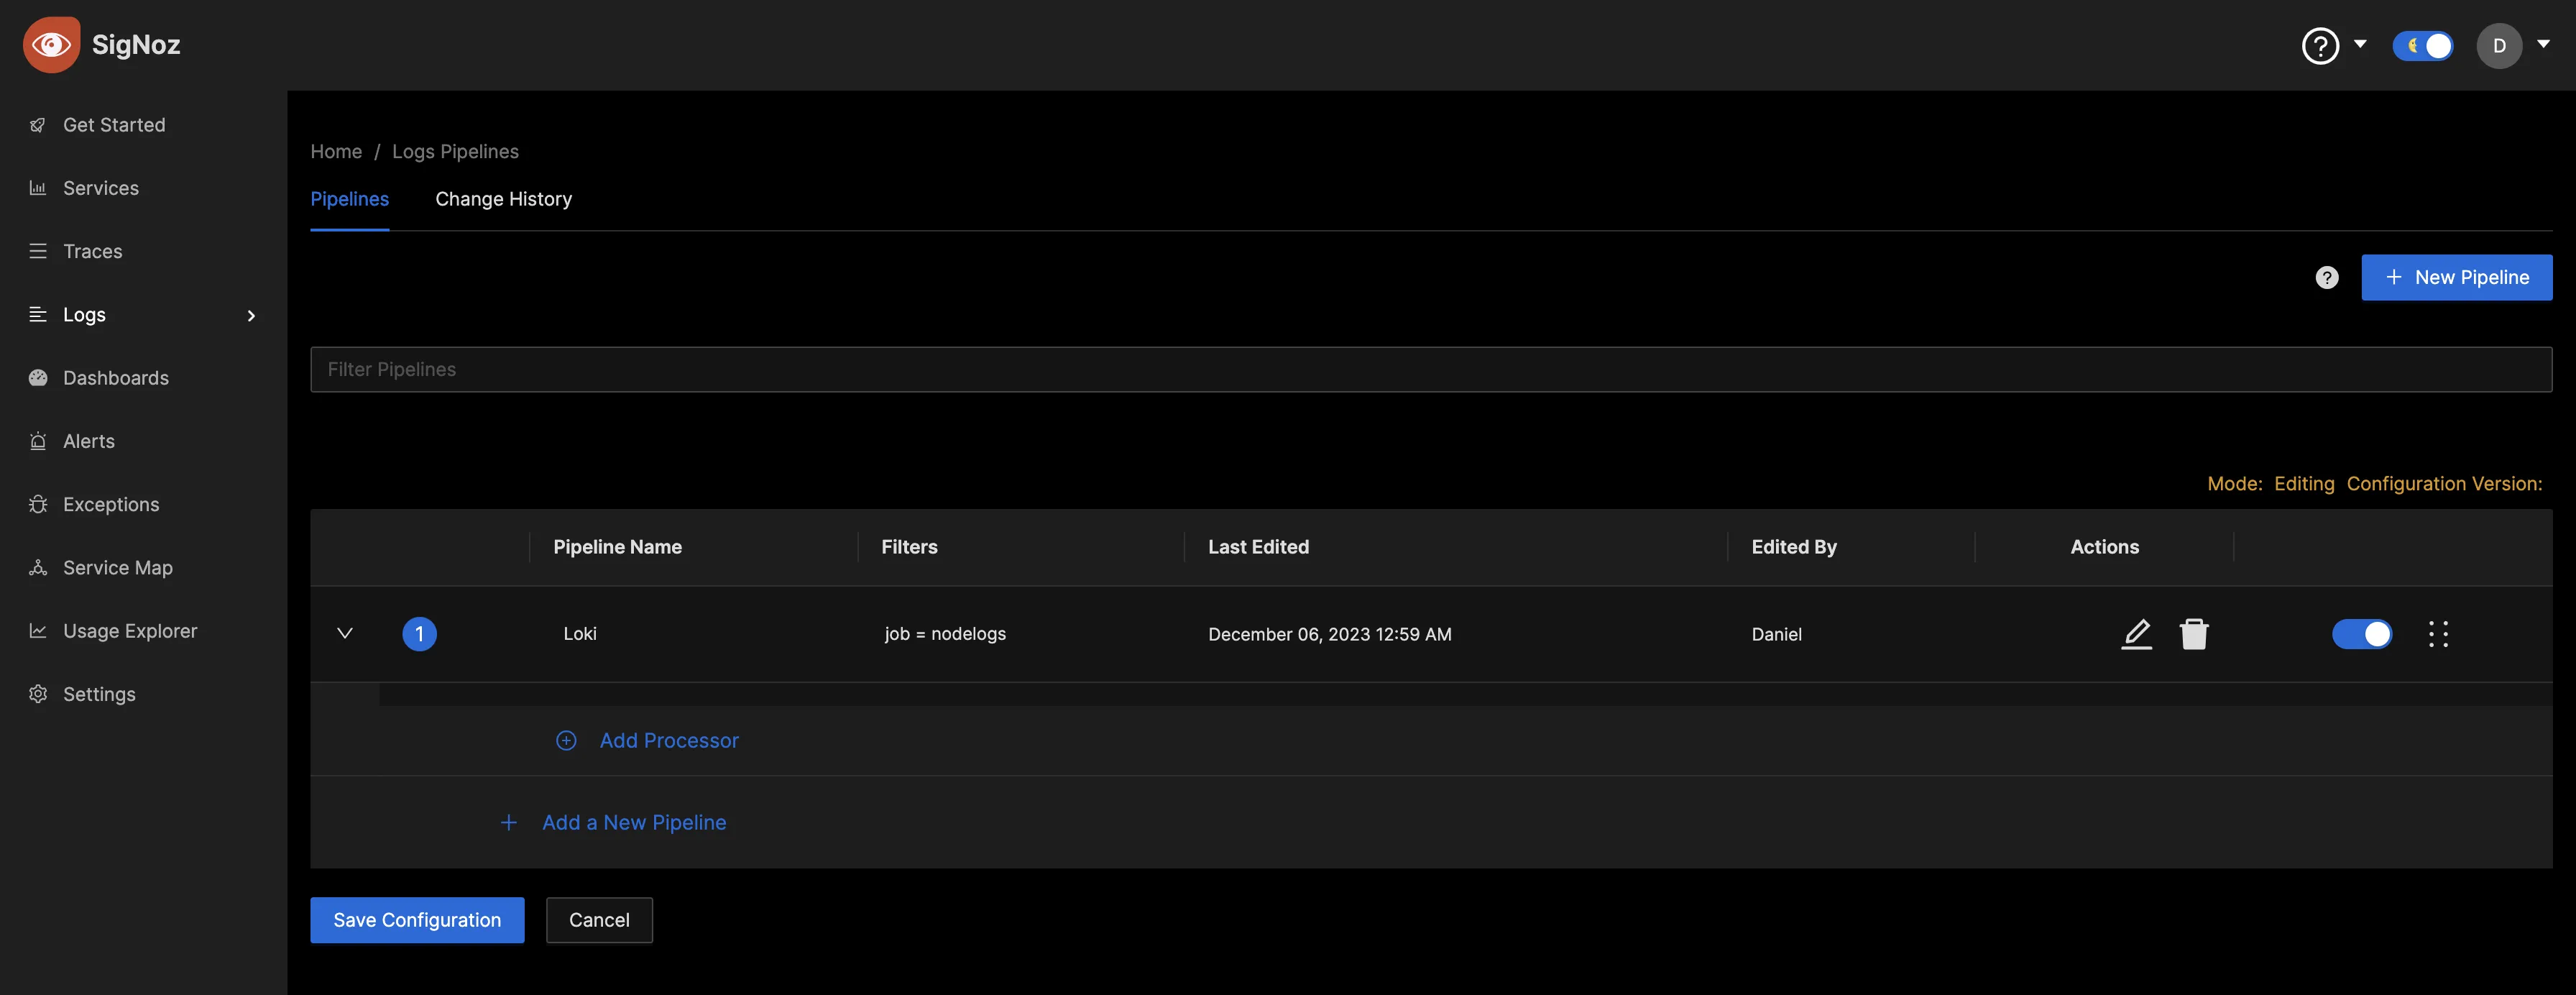
In the Logs Pipelines page, click on the “+ New Pipeline” button to create a new pipeline:
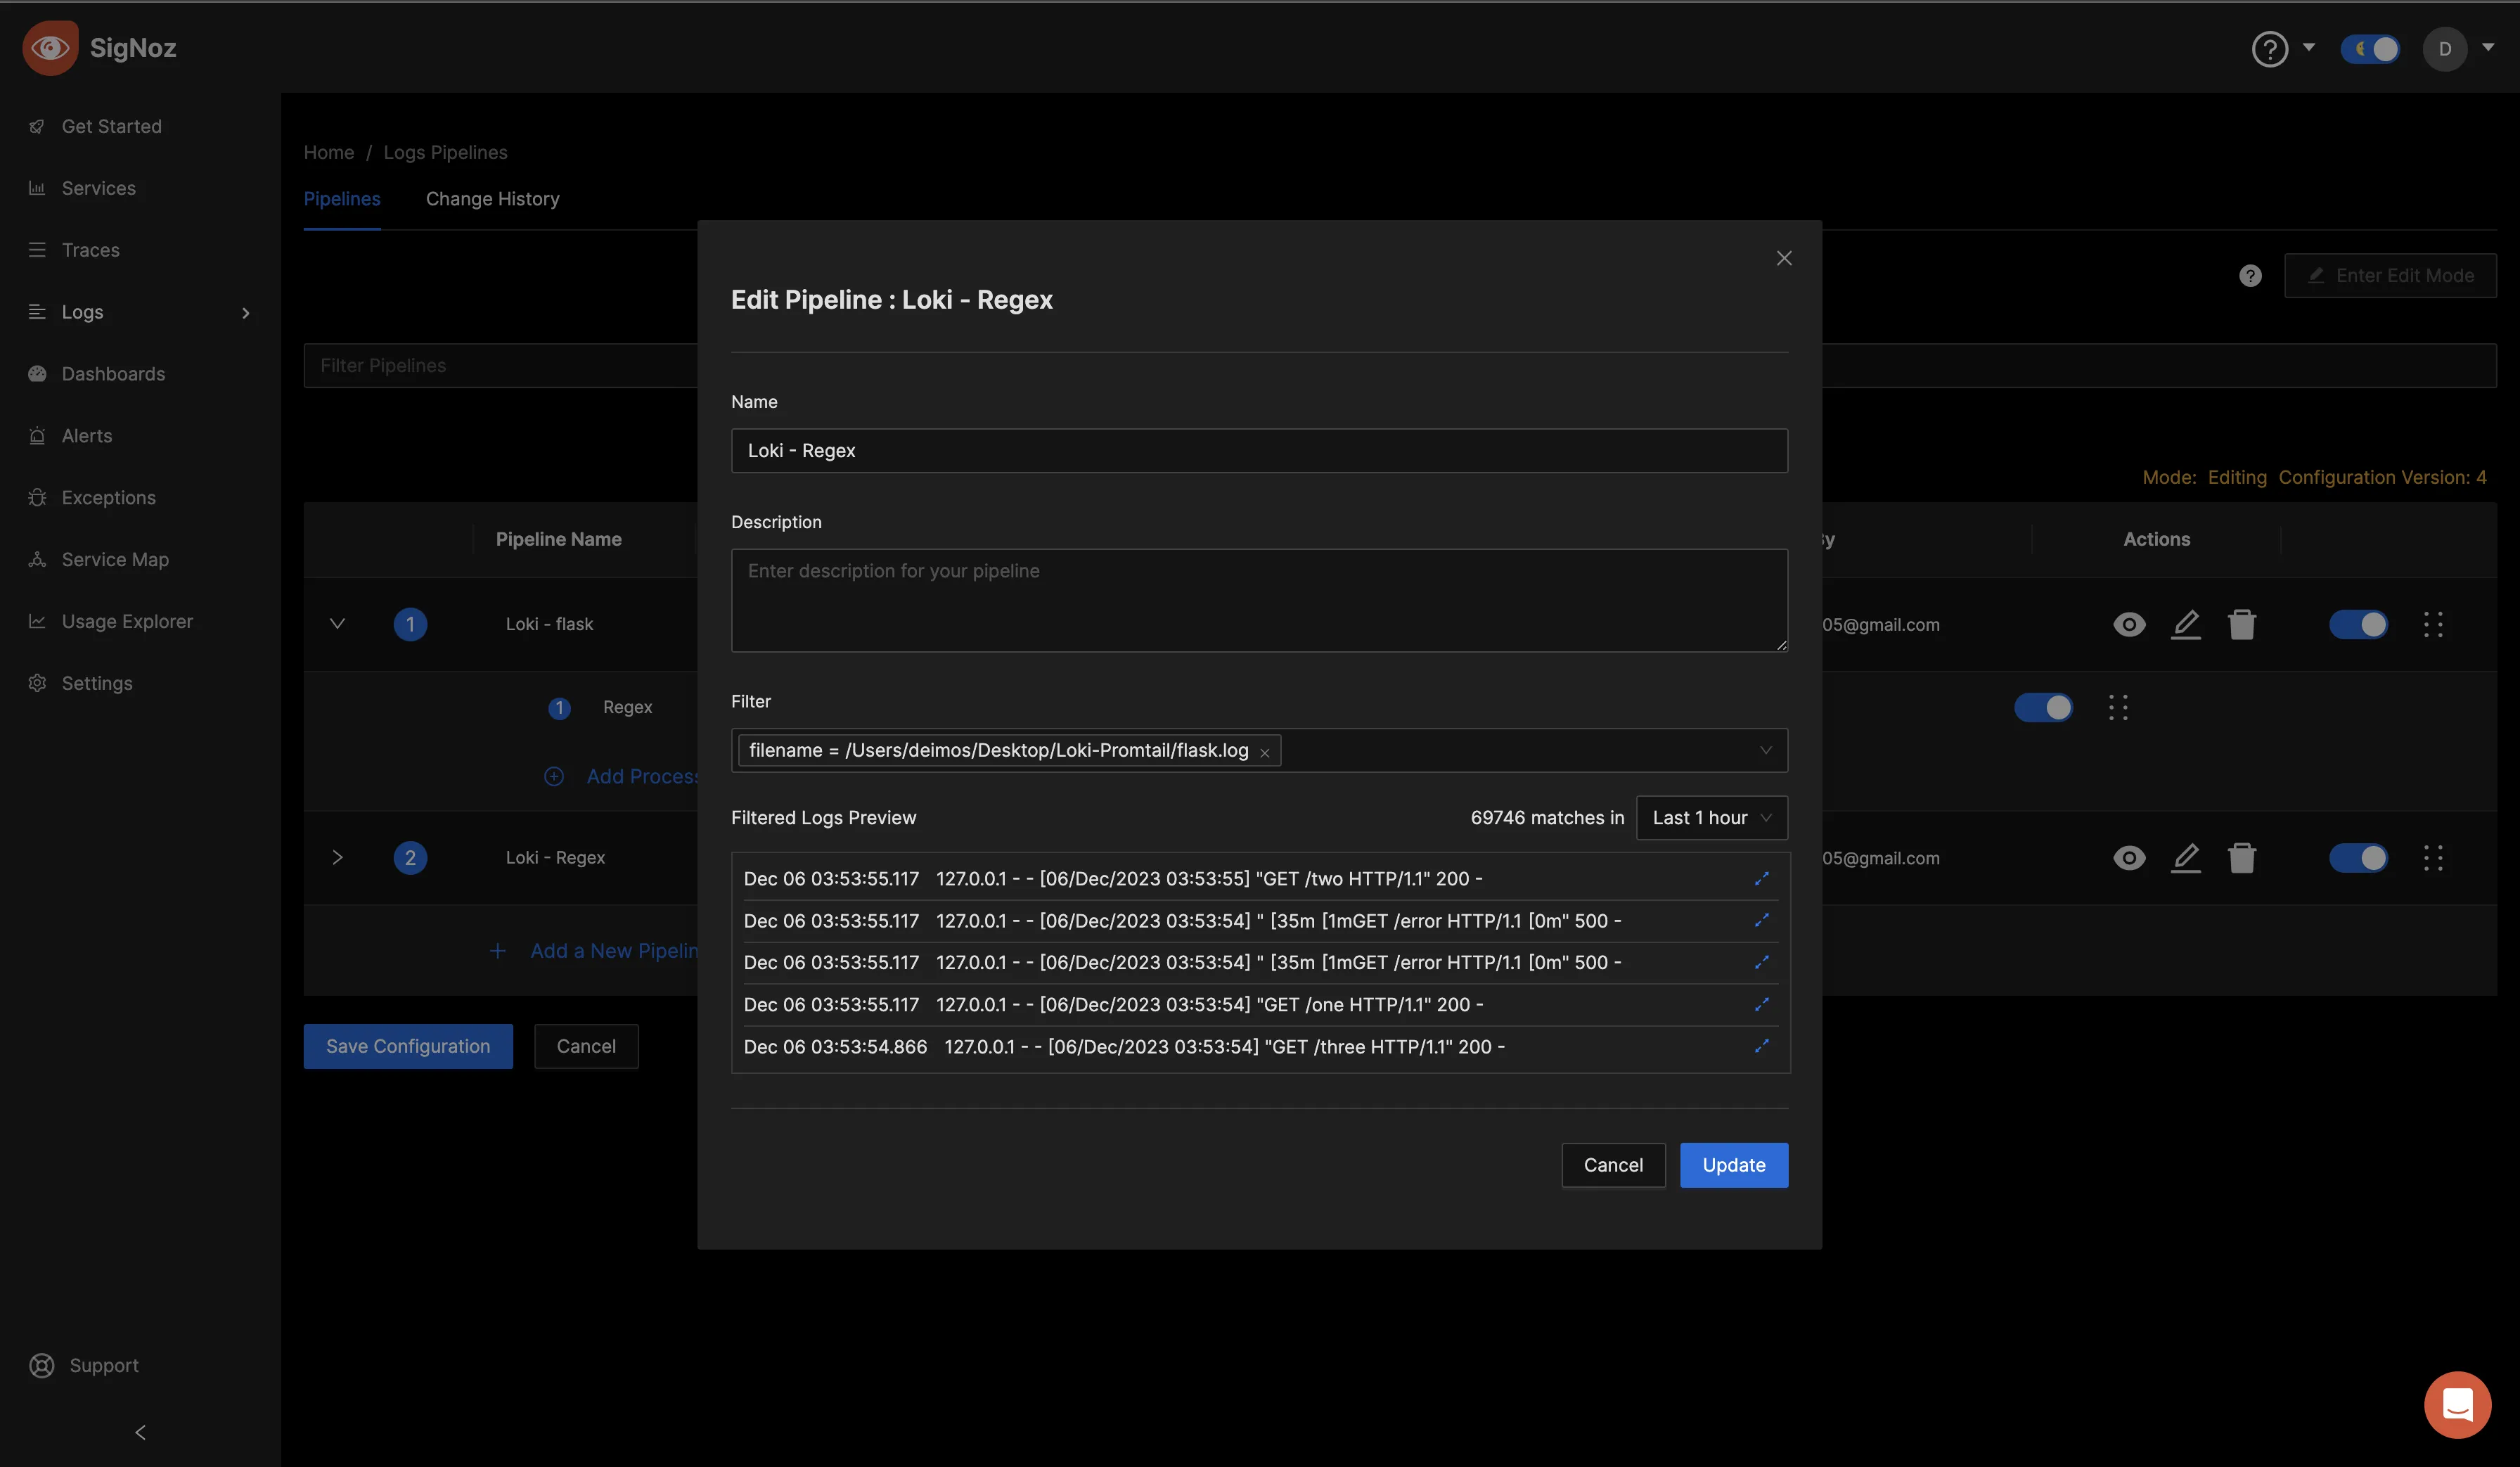
Specify a name of your preference for the pipeline, optionally include a description, and choose a filter to apply to the pipeline. In the below image, the filter was set to the filename=/path/to/the/flask.logfile. Upon selection, preview the filtered logs in the "Filter Logs Preview" section. Once satisfied with the configuration, proceed to create the pipeline.
After successfully creating the pipeline, a processor needs to be created for that pipeline.
In the context of logs and data processing pipelines, a "processor" refers to a component that performs specific operations on the logs as they flow through the pipeline. Processors are used to manipulate, transform, or enrich the log data according to predefined rules or configurations.
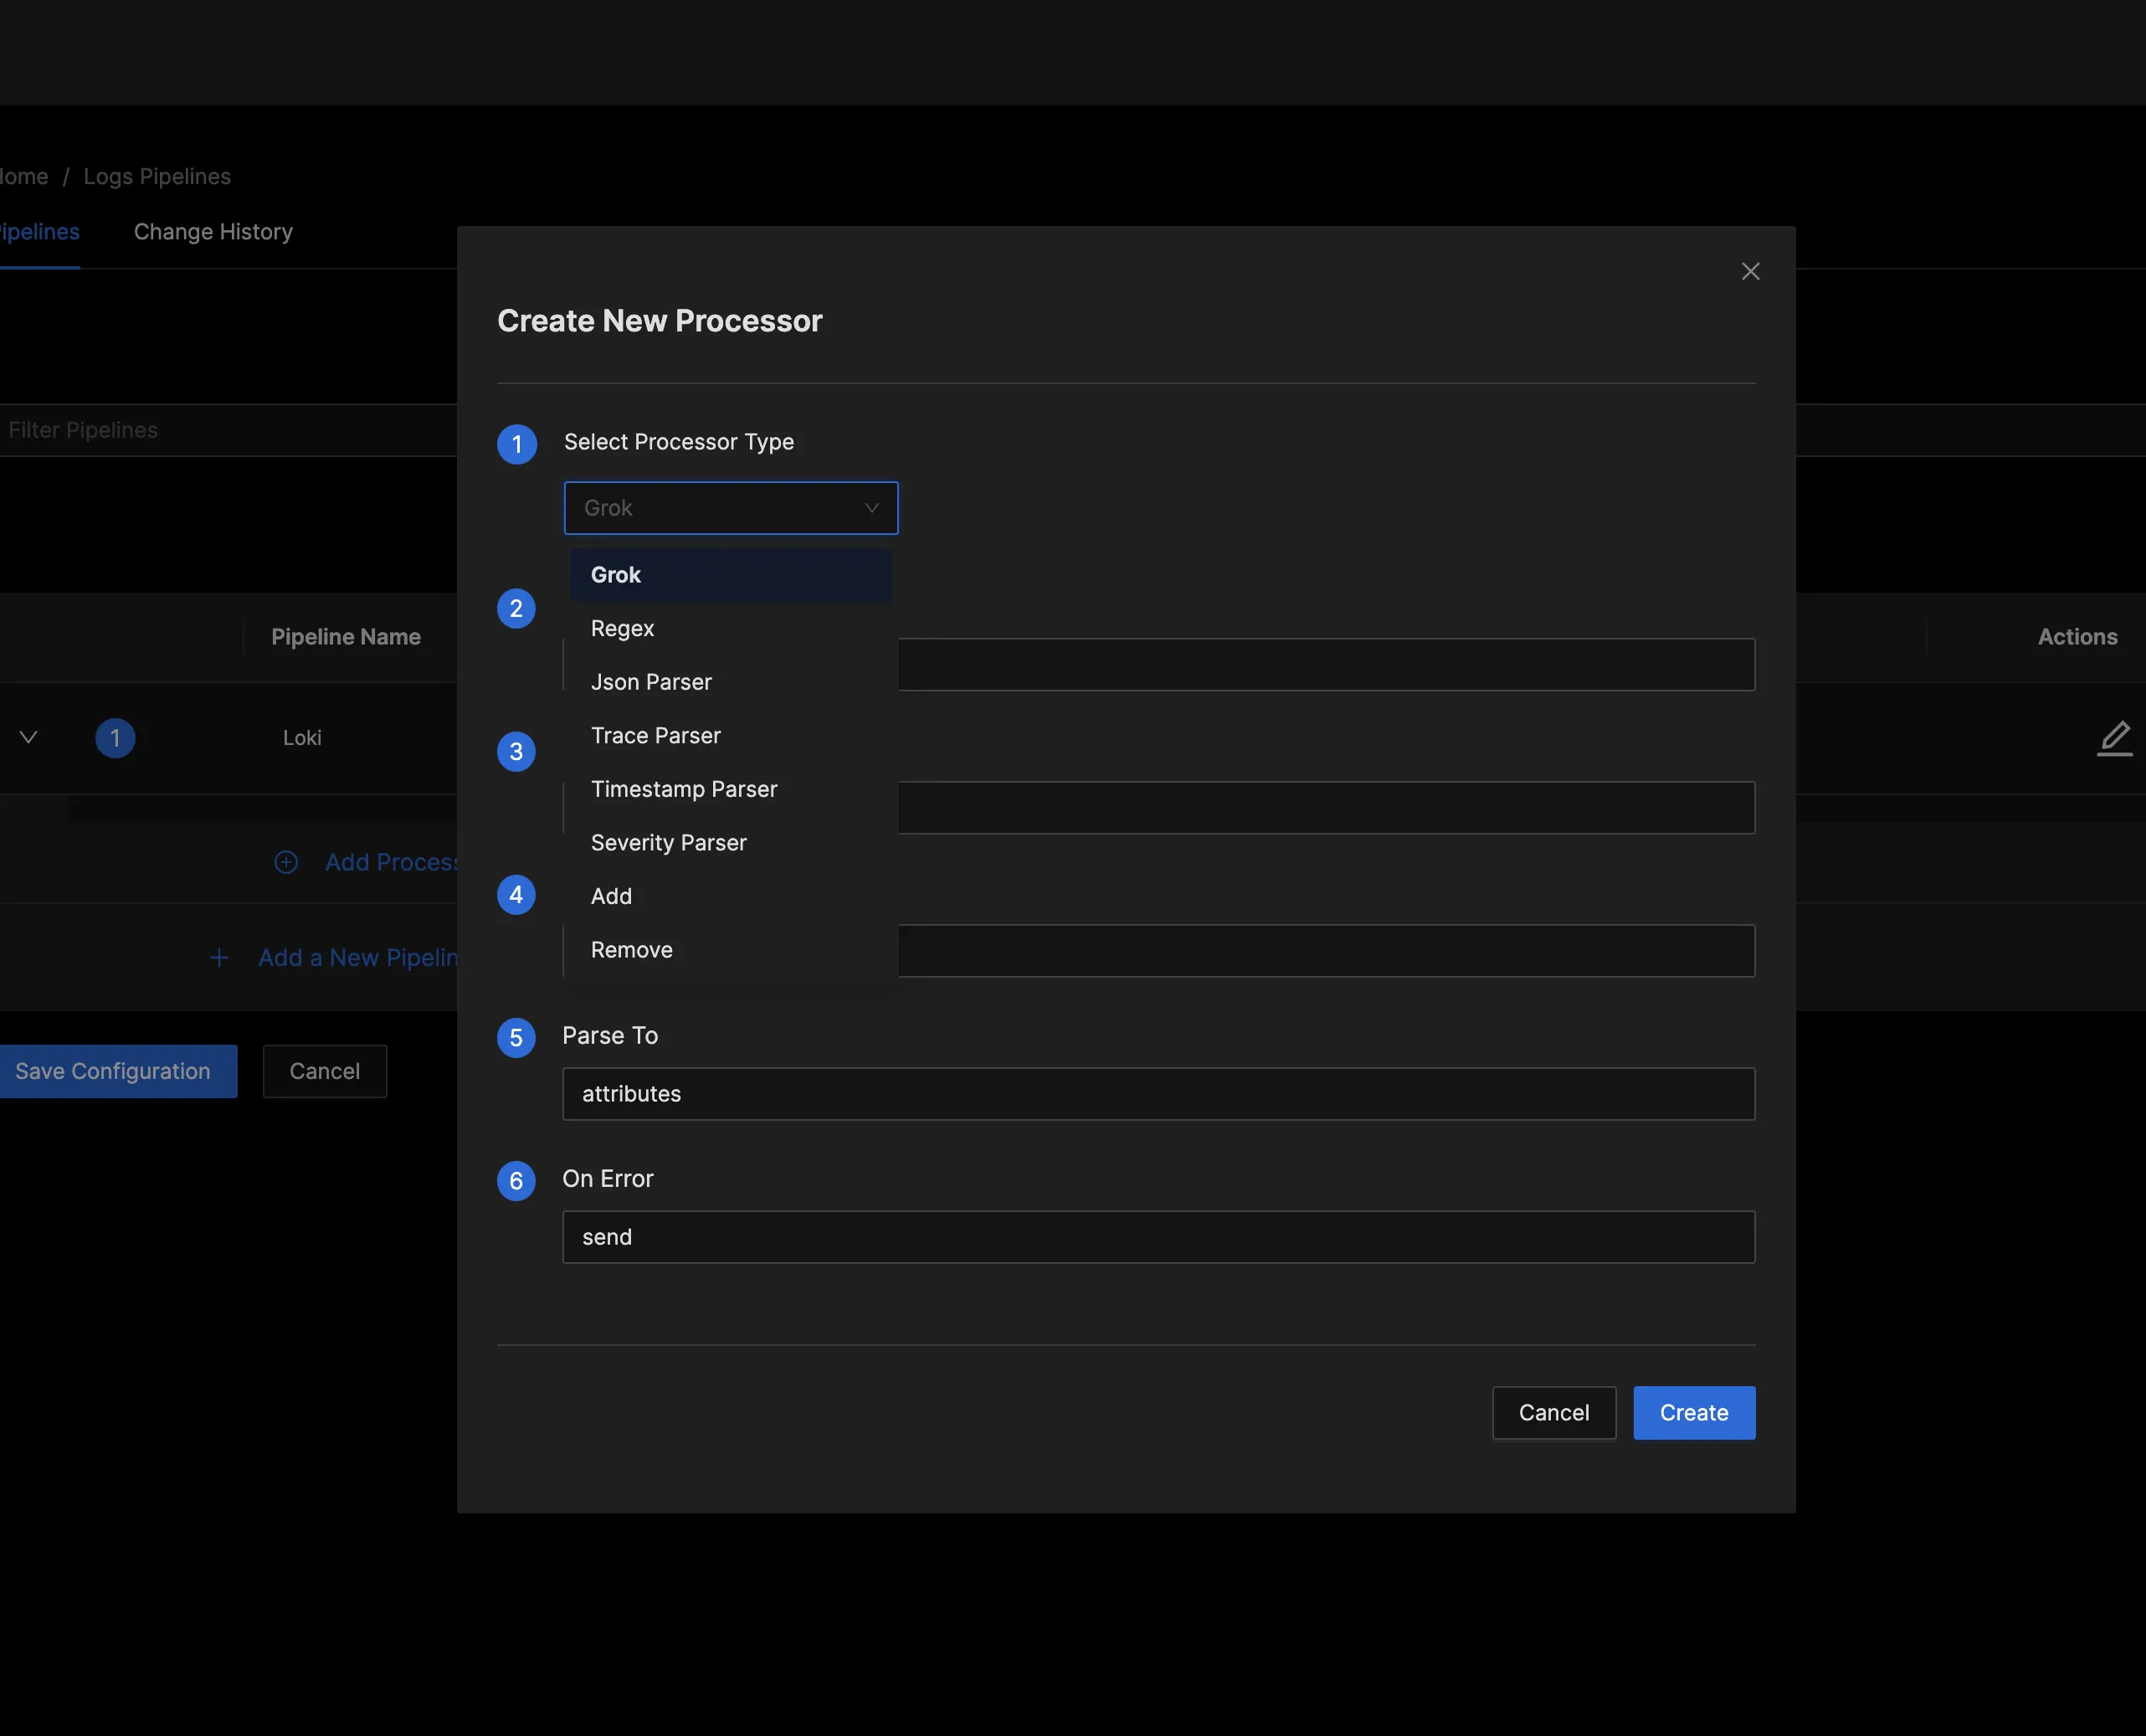
Click "Add Processor" to choose a method for processing the logs.
There are several processor types to select from; pick any one of your choice. For this example, select the “Regex” processor type.
Regular expressions, often abbreviated as “regex,” are powerful and flexible sequences of characters that define a search pattern. It is a tool used for pattern matching within strings, making it useful for tasks such as string validation, search and replace operations, and data extraction. You can learn more about Regex here.
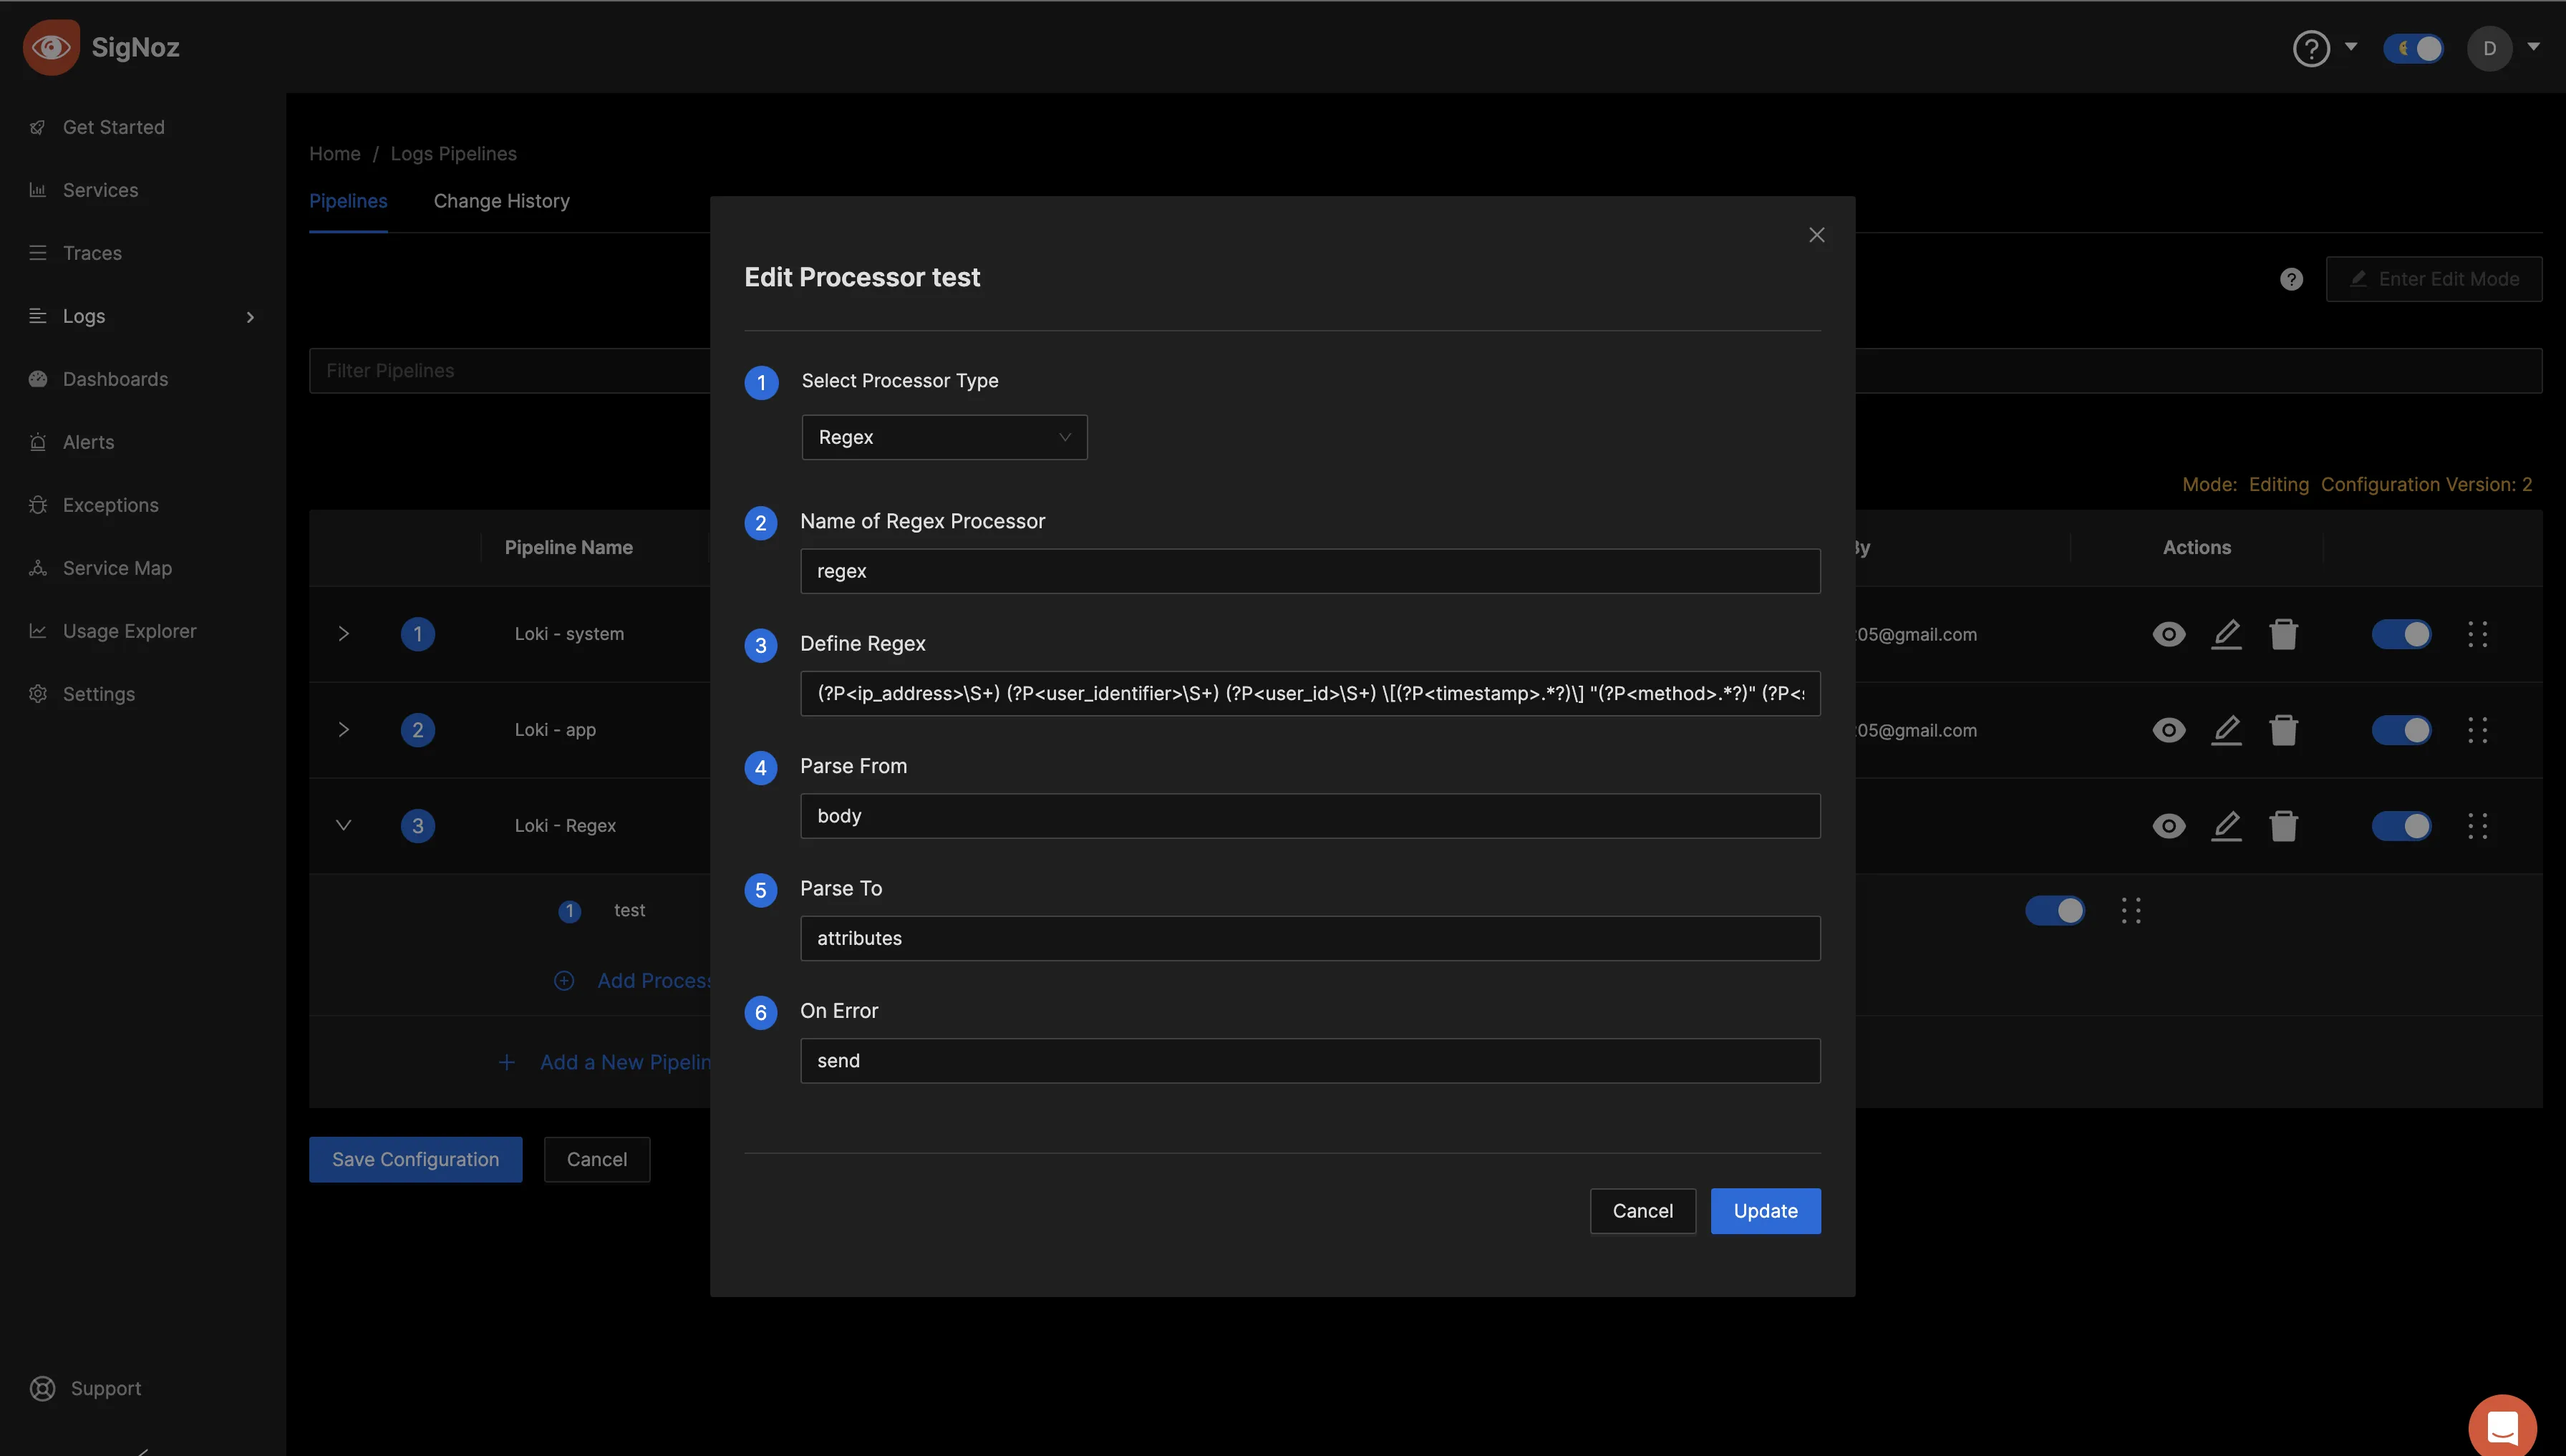
Give it a name and define the Regex expression as:
(?P<ip_address>\S+) (?P<user_identifier>\S+) (?P<user_id>\S+) \[(?P<timestamp>.*?)\] "(?P<method>.*?)" (?P<status_code>\d+) (?P<size>\S+)
This regex extracts specific pieces of information from log entries that follow a structured format. The named groups (ip_address, user_identifier, etc.) make it easier to reference and work with these captured values once the regex matches a log entry.
Set Parse from to body, Parse to to attributes and On Error to send, then save/update.
You can view the processor settings by clicking on the eye icon for that particular pipeline.
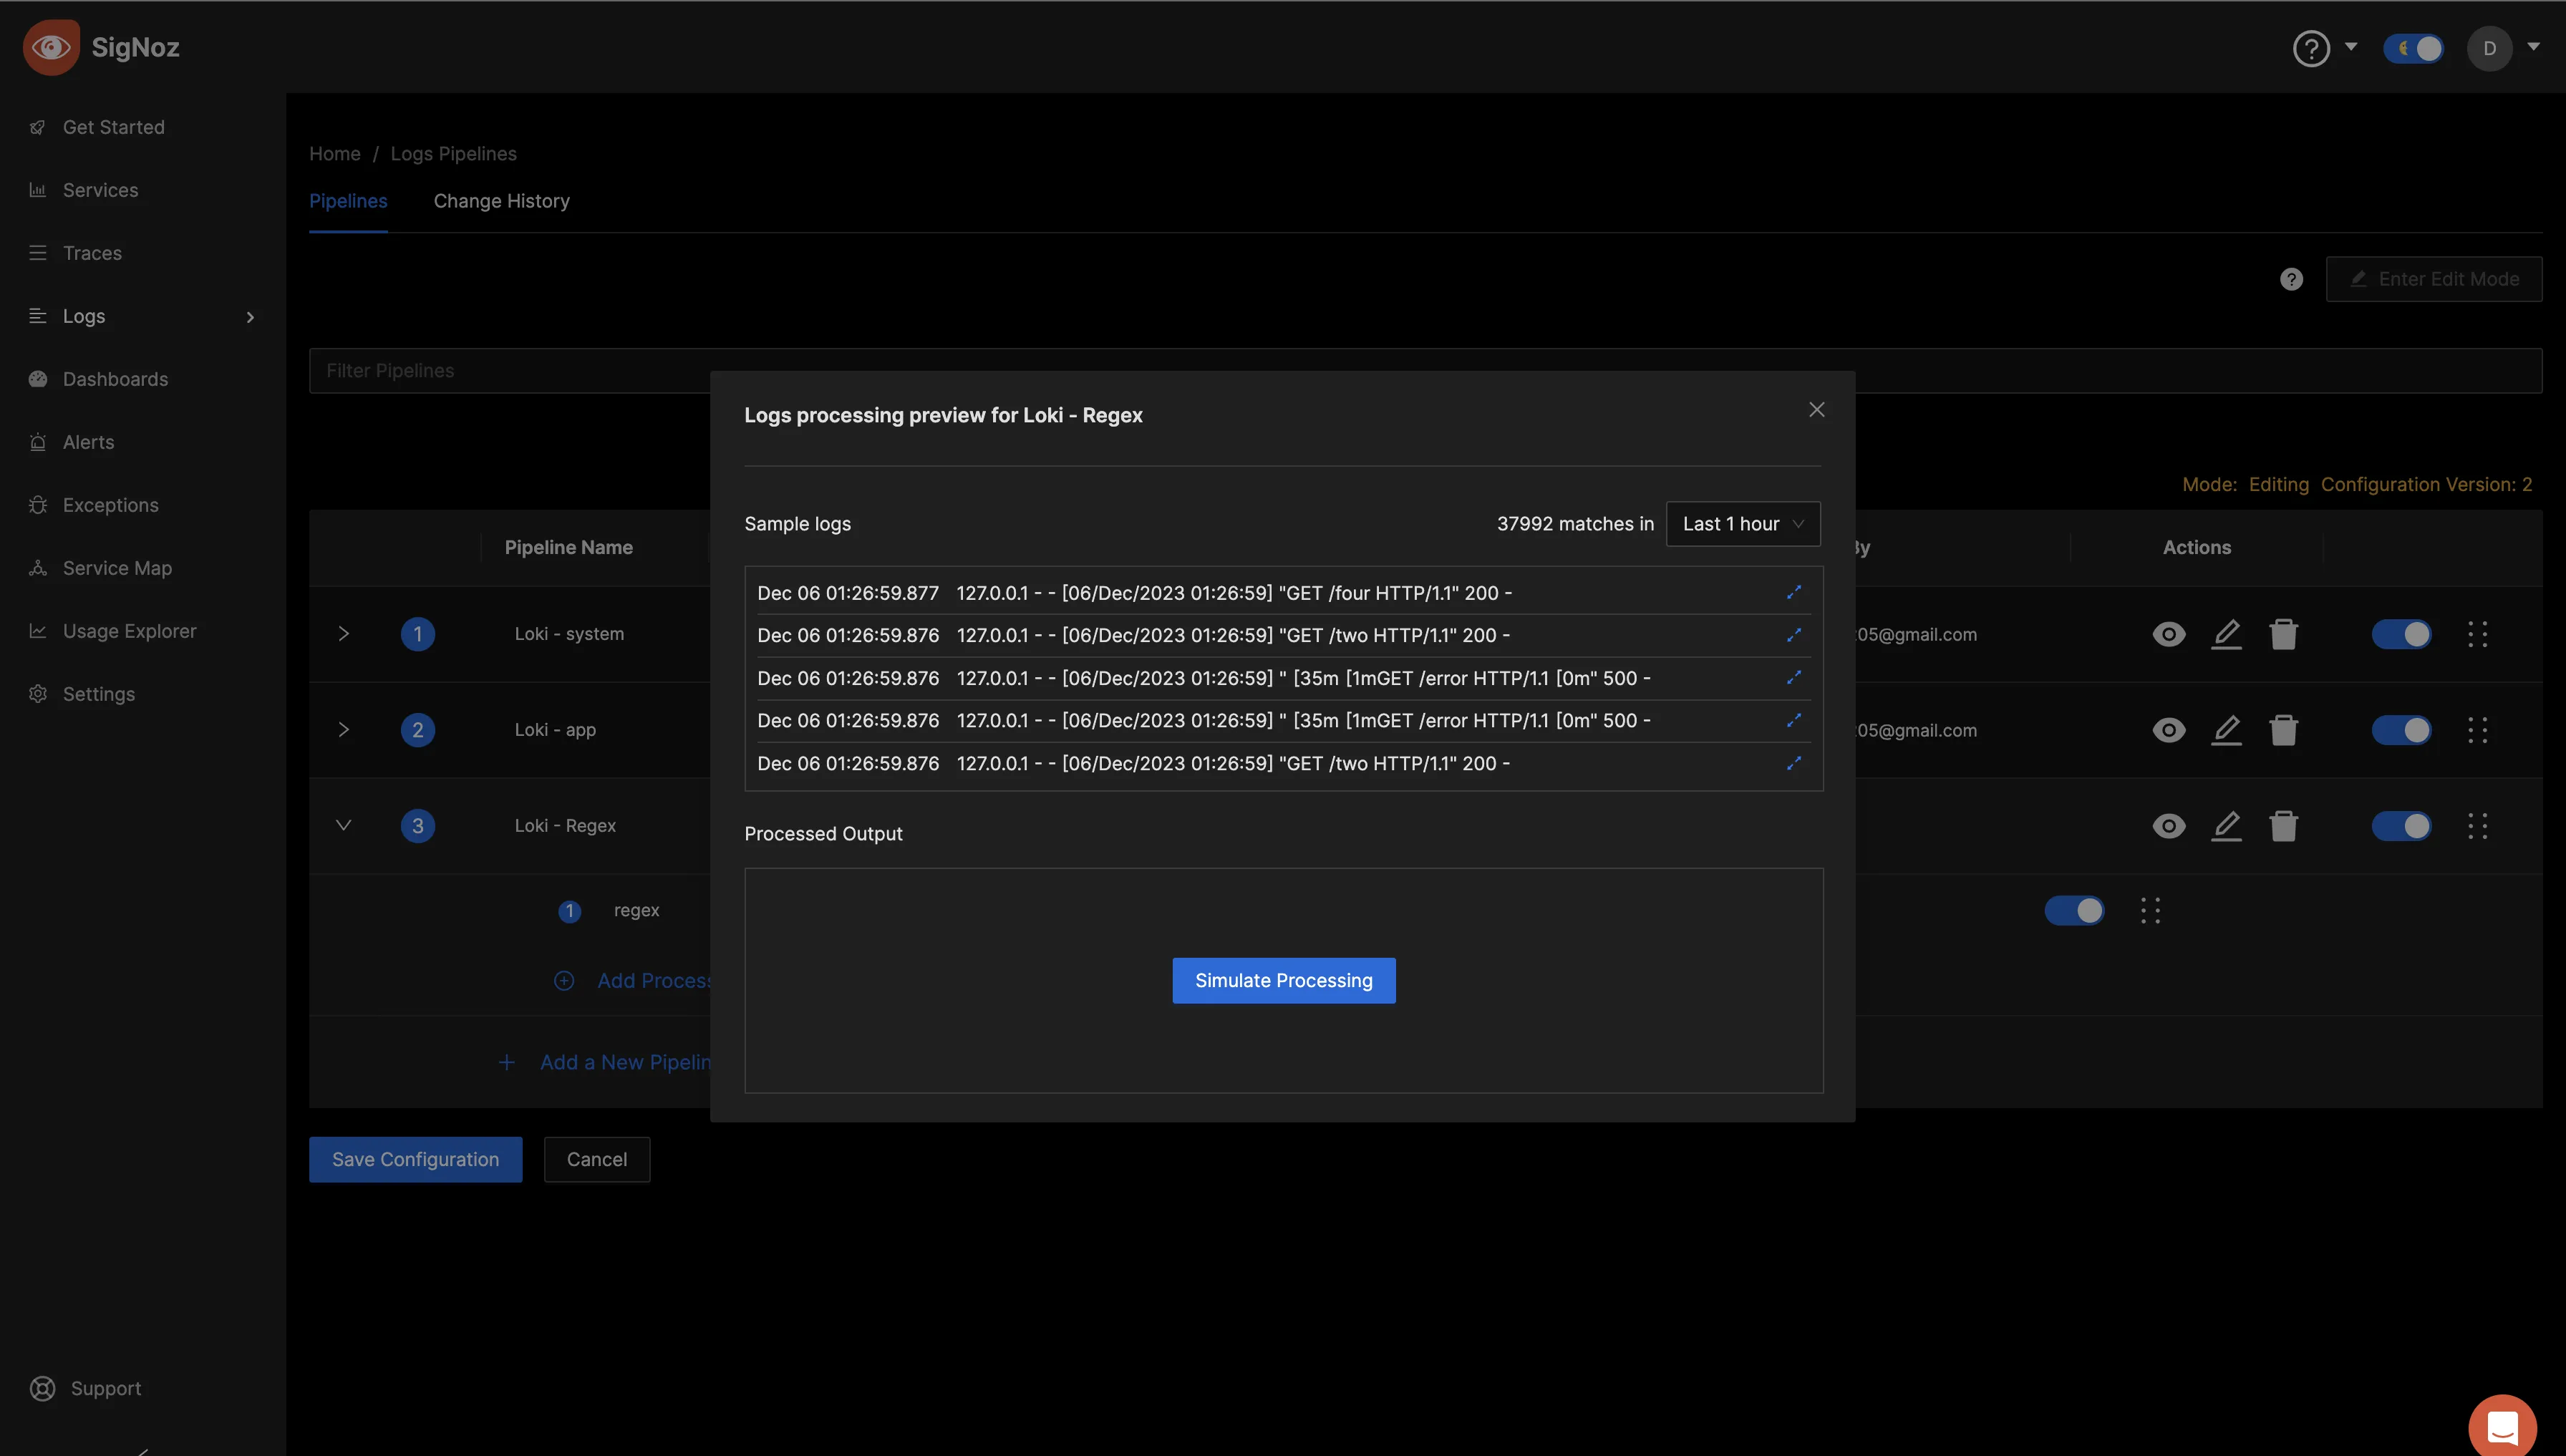
Select the opposing blue arrows to view the initial format of the logs.
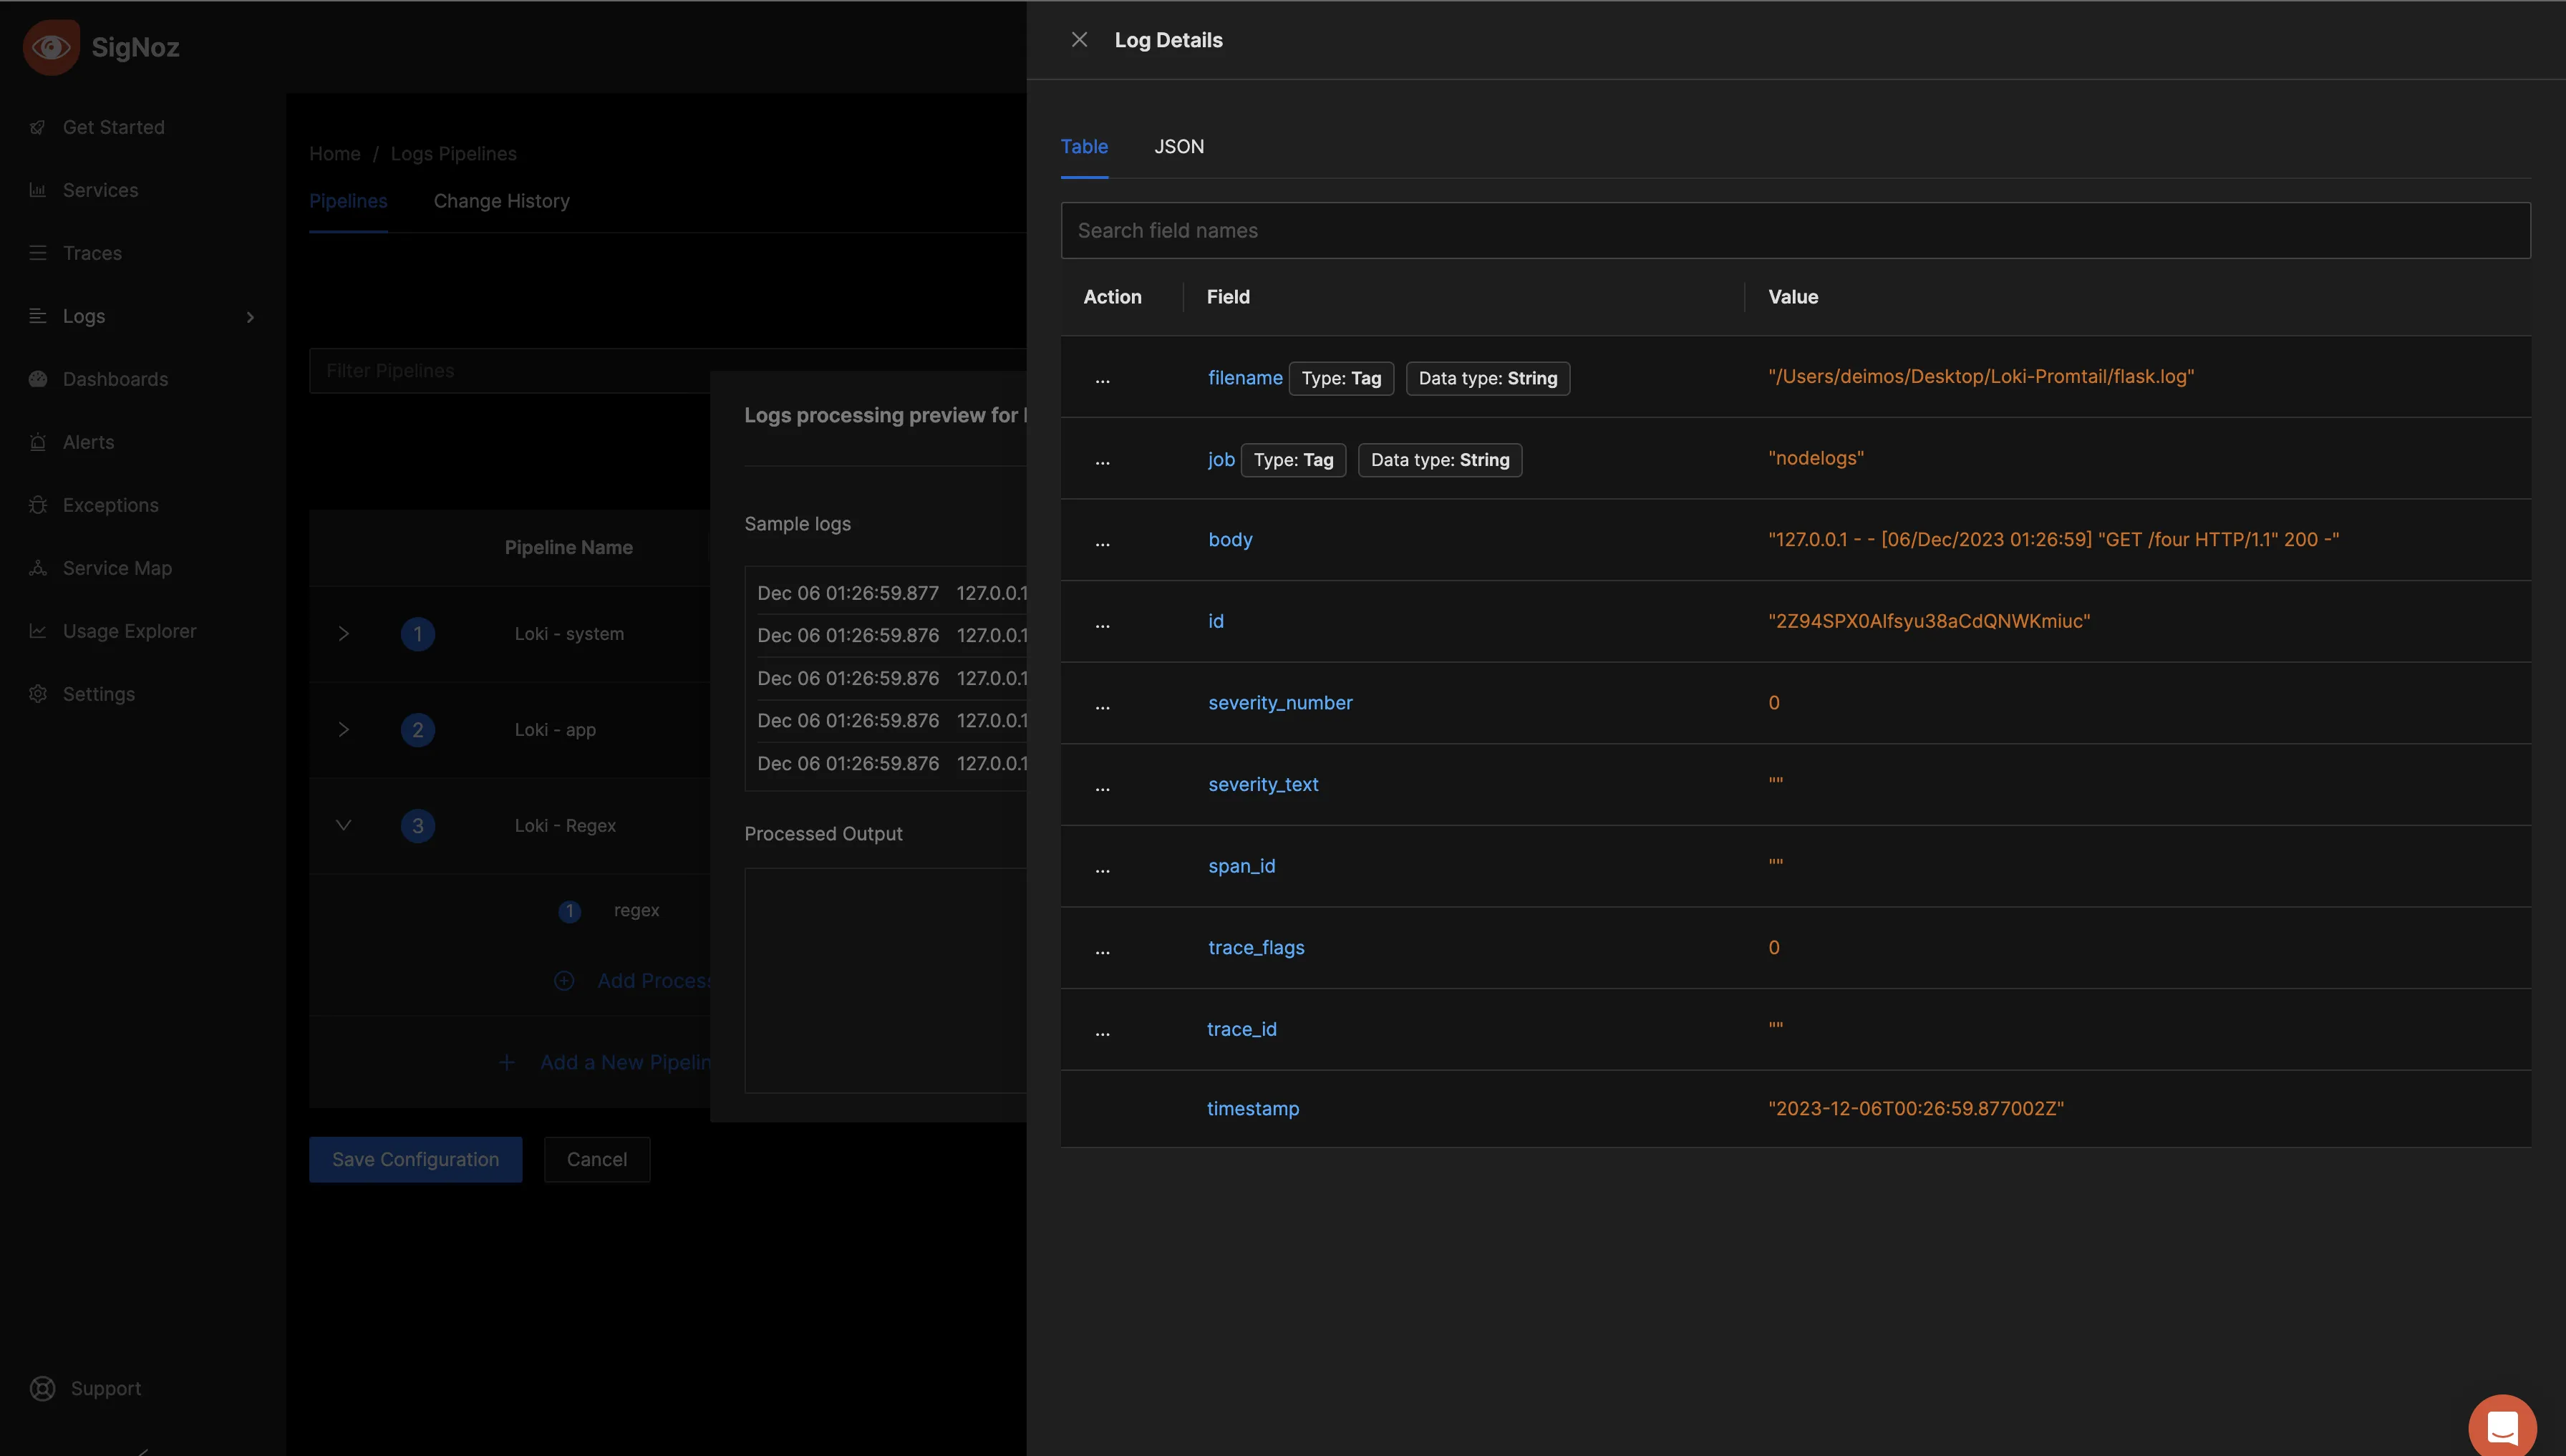
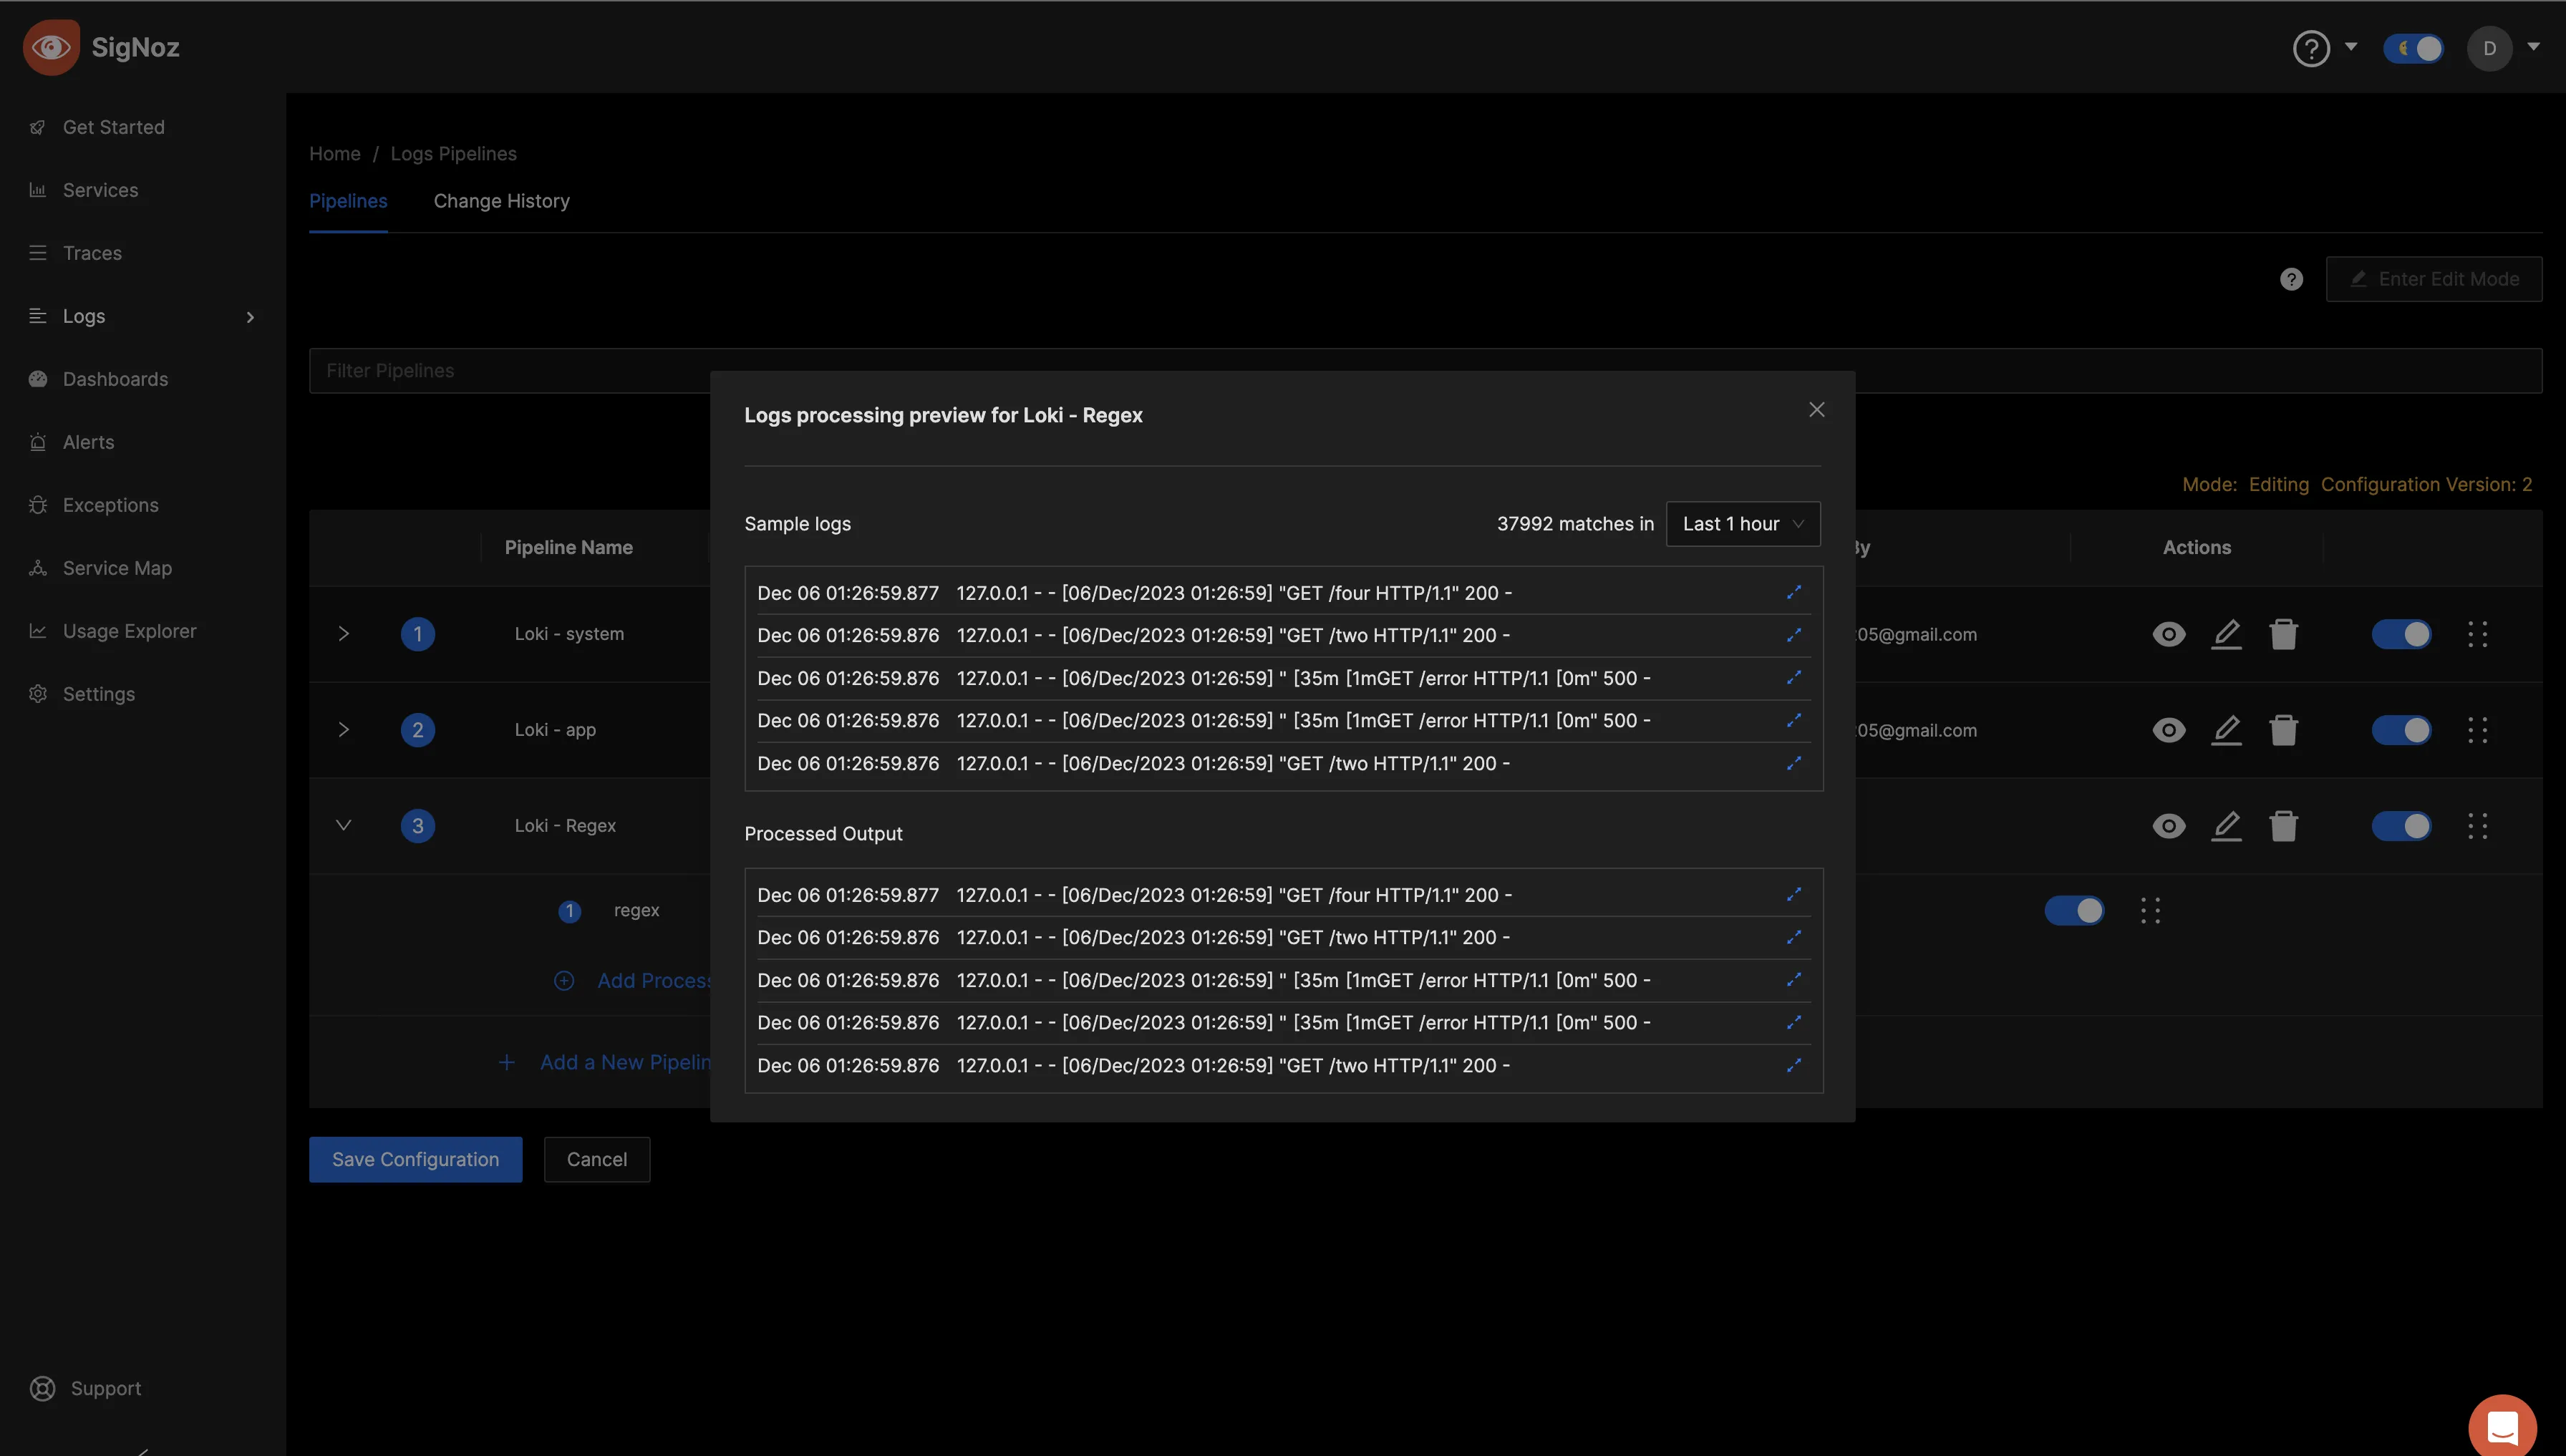
Return to the previous screen and select "Simulate Processing." Next, click on the opposing blue arrows under the “Processed Output” tab to examine the logs after processing.
The processed logs should look as below:
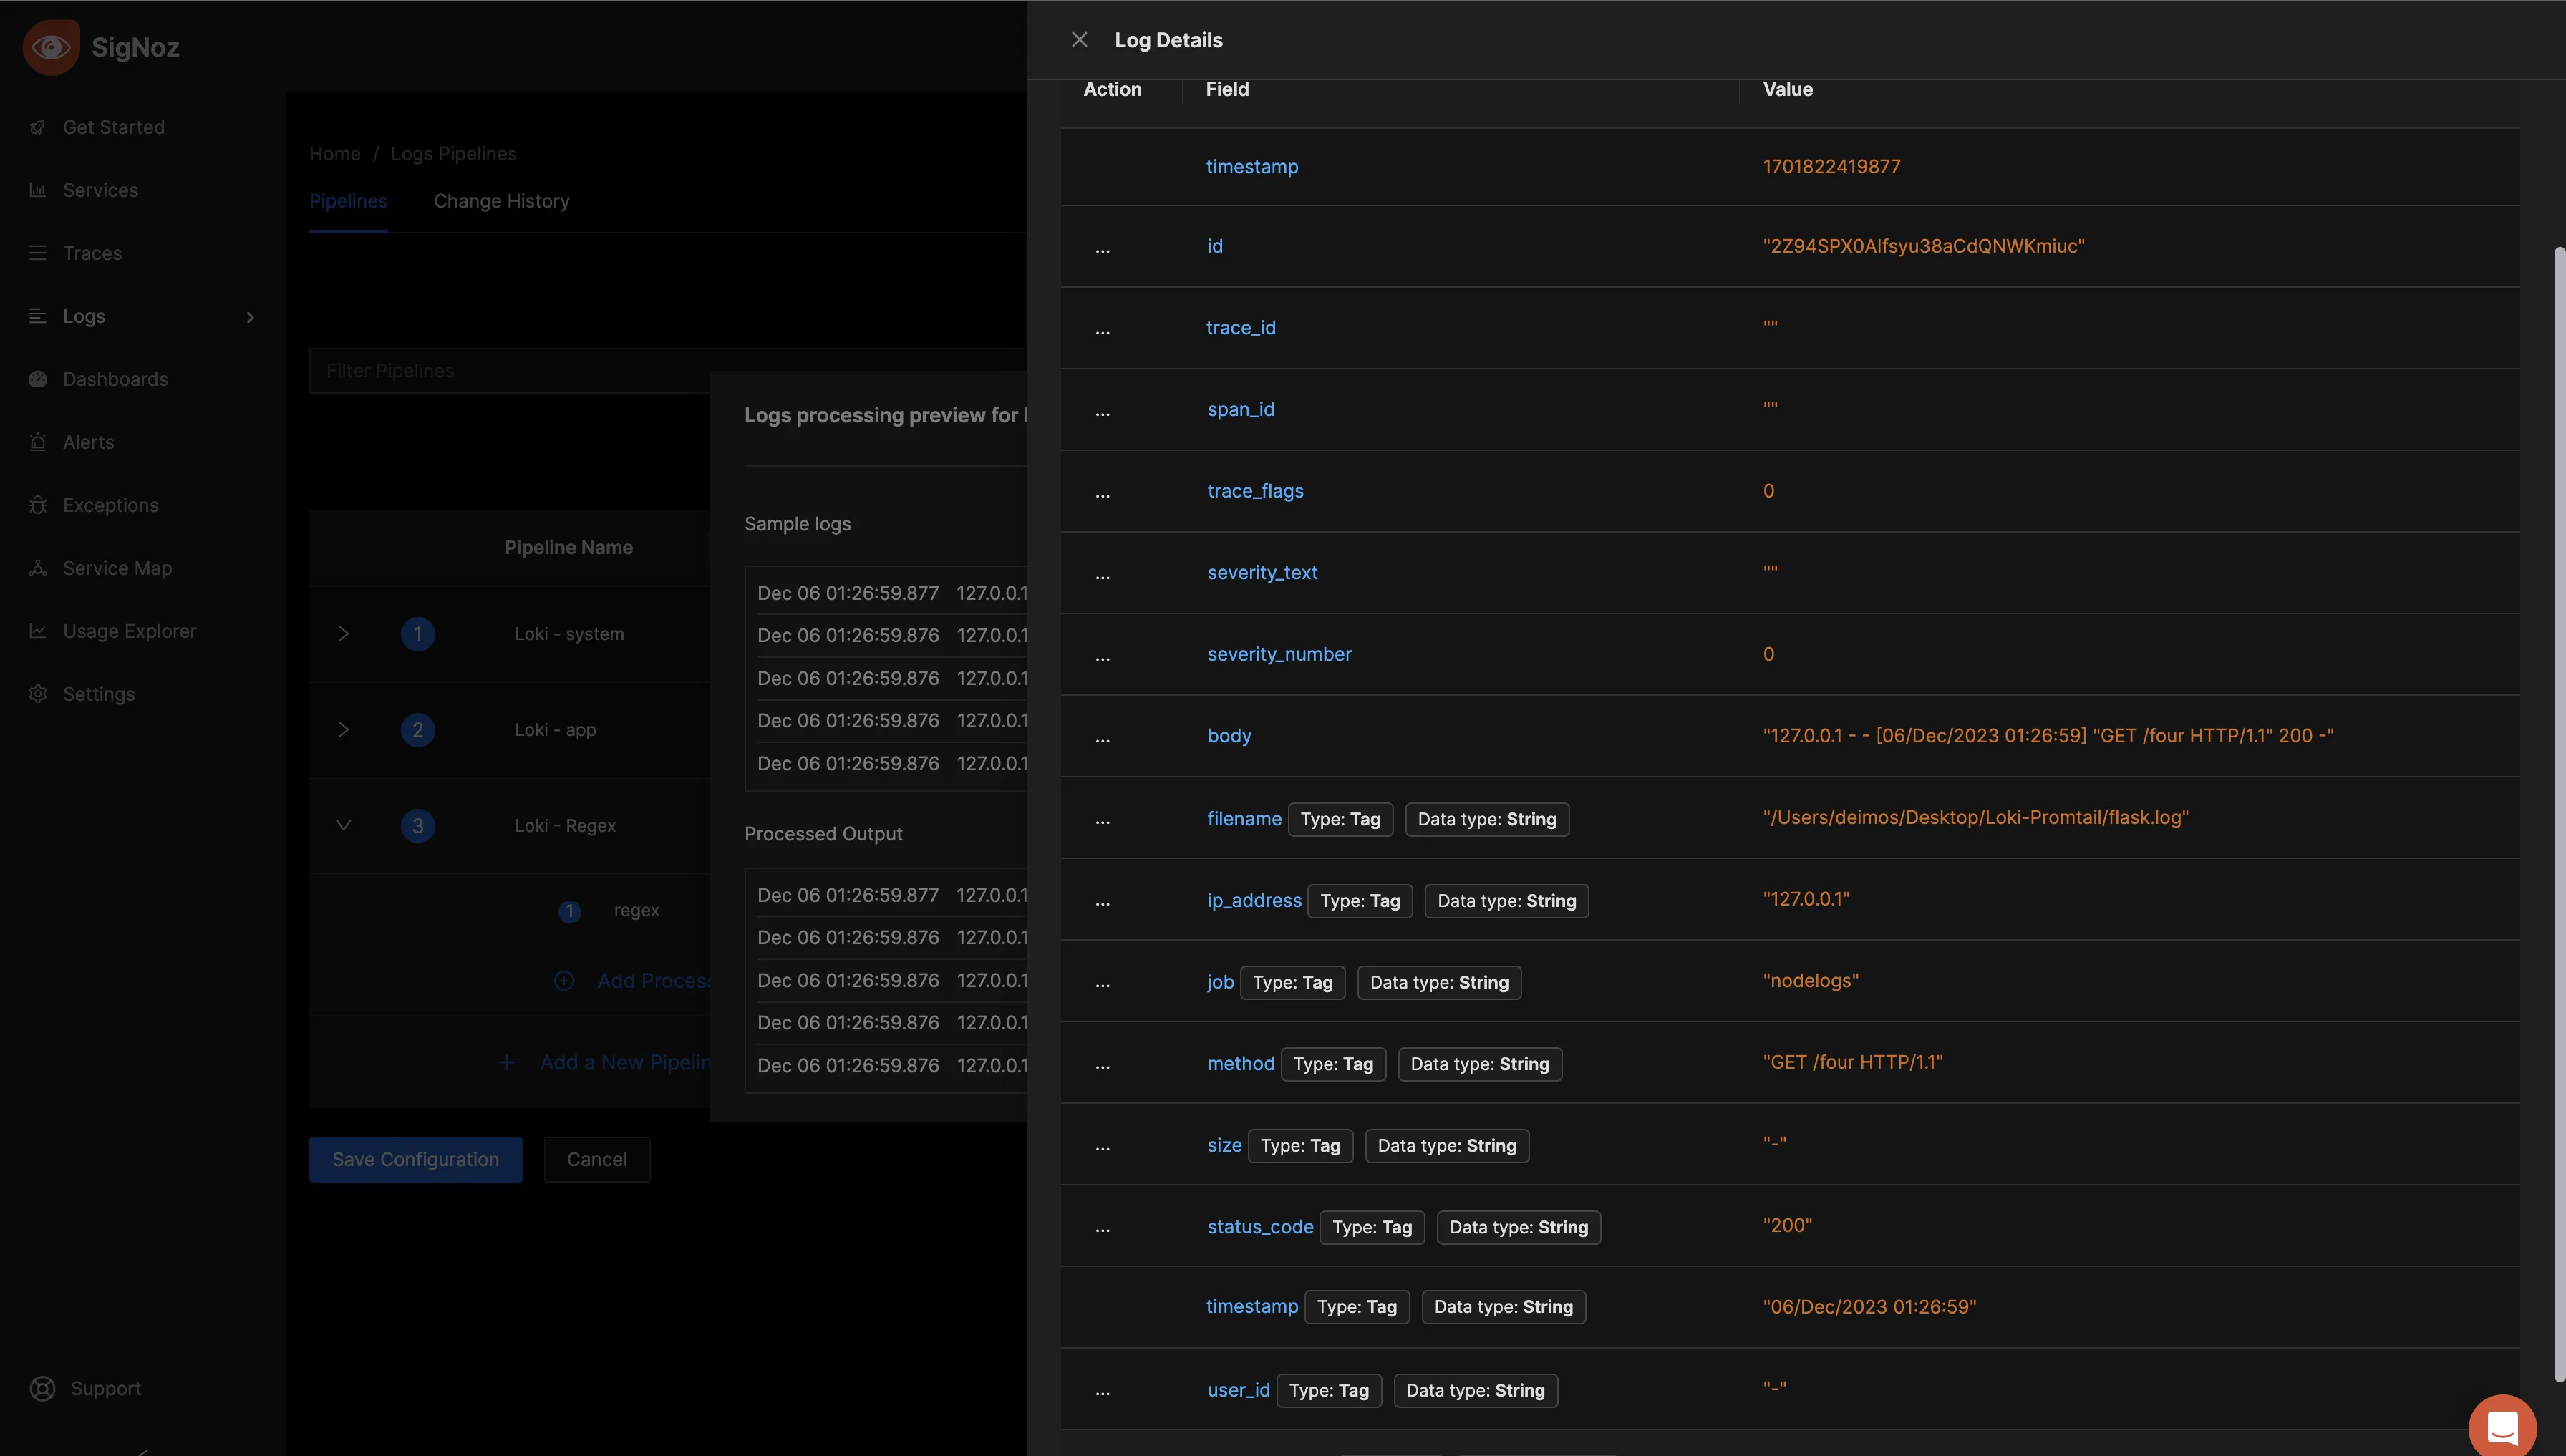
As seen above, more fields have been included through the Regex processor. In contrast to the former, without the regex processor, your queries are confined to the displayed fields. However, by incorporating a Regex processor with more succinct field options, log queries become more streamlined and flexible.
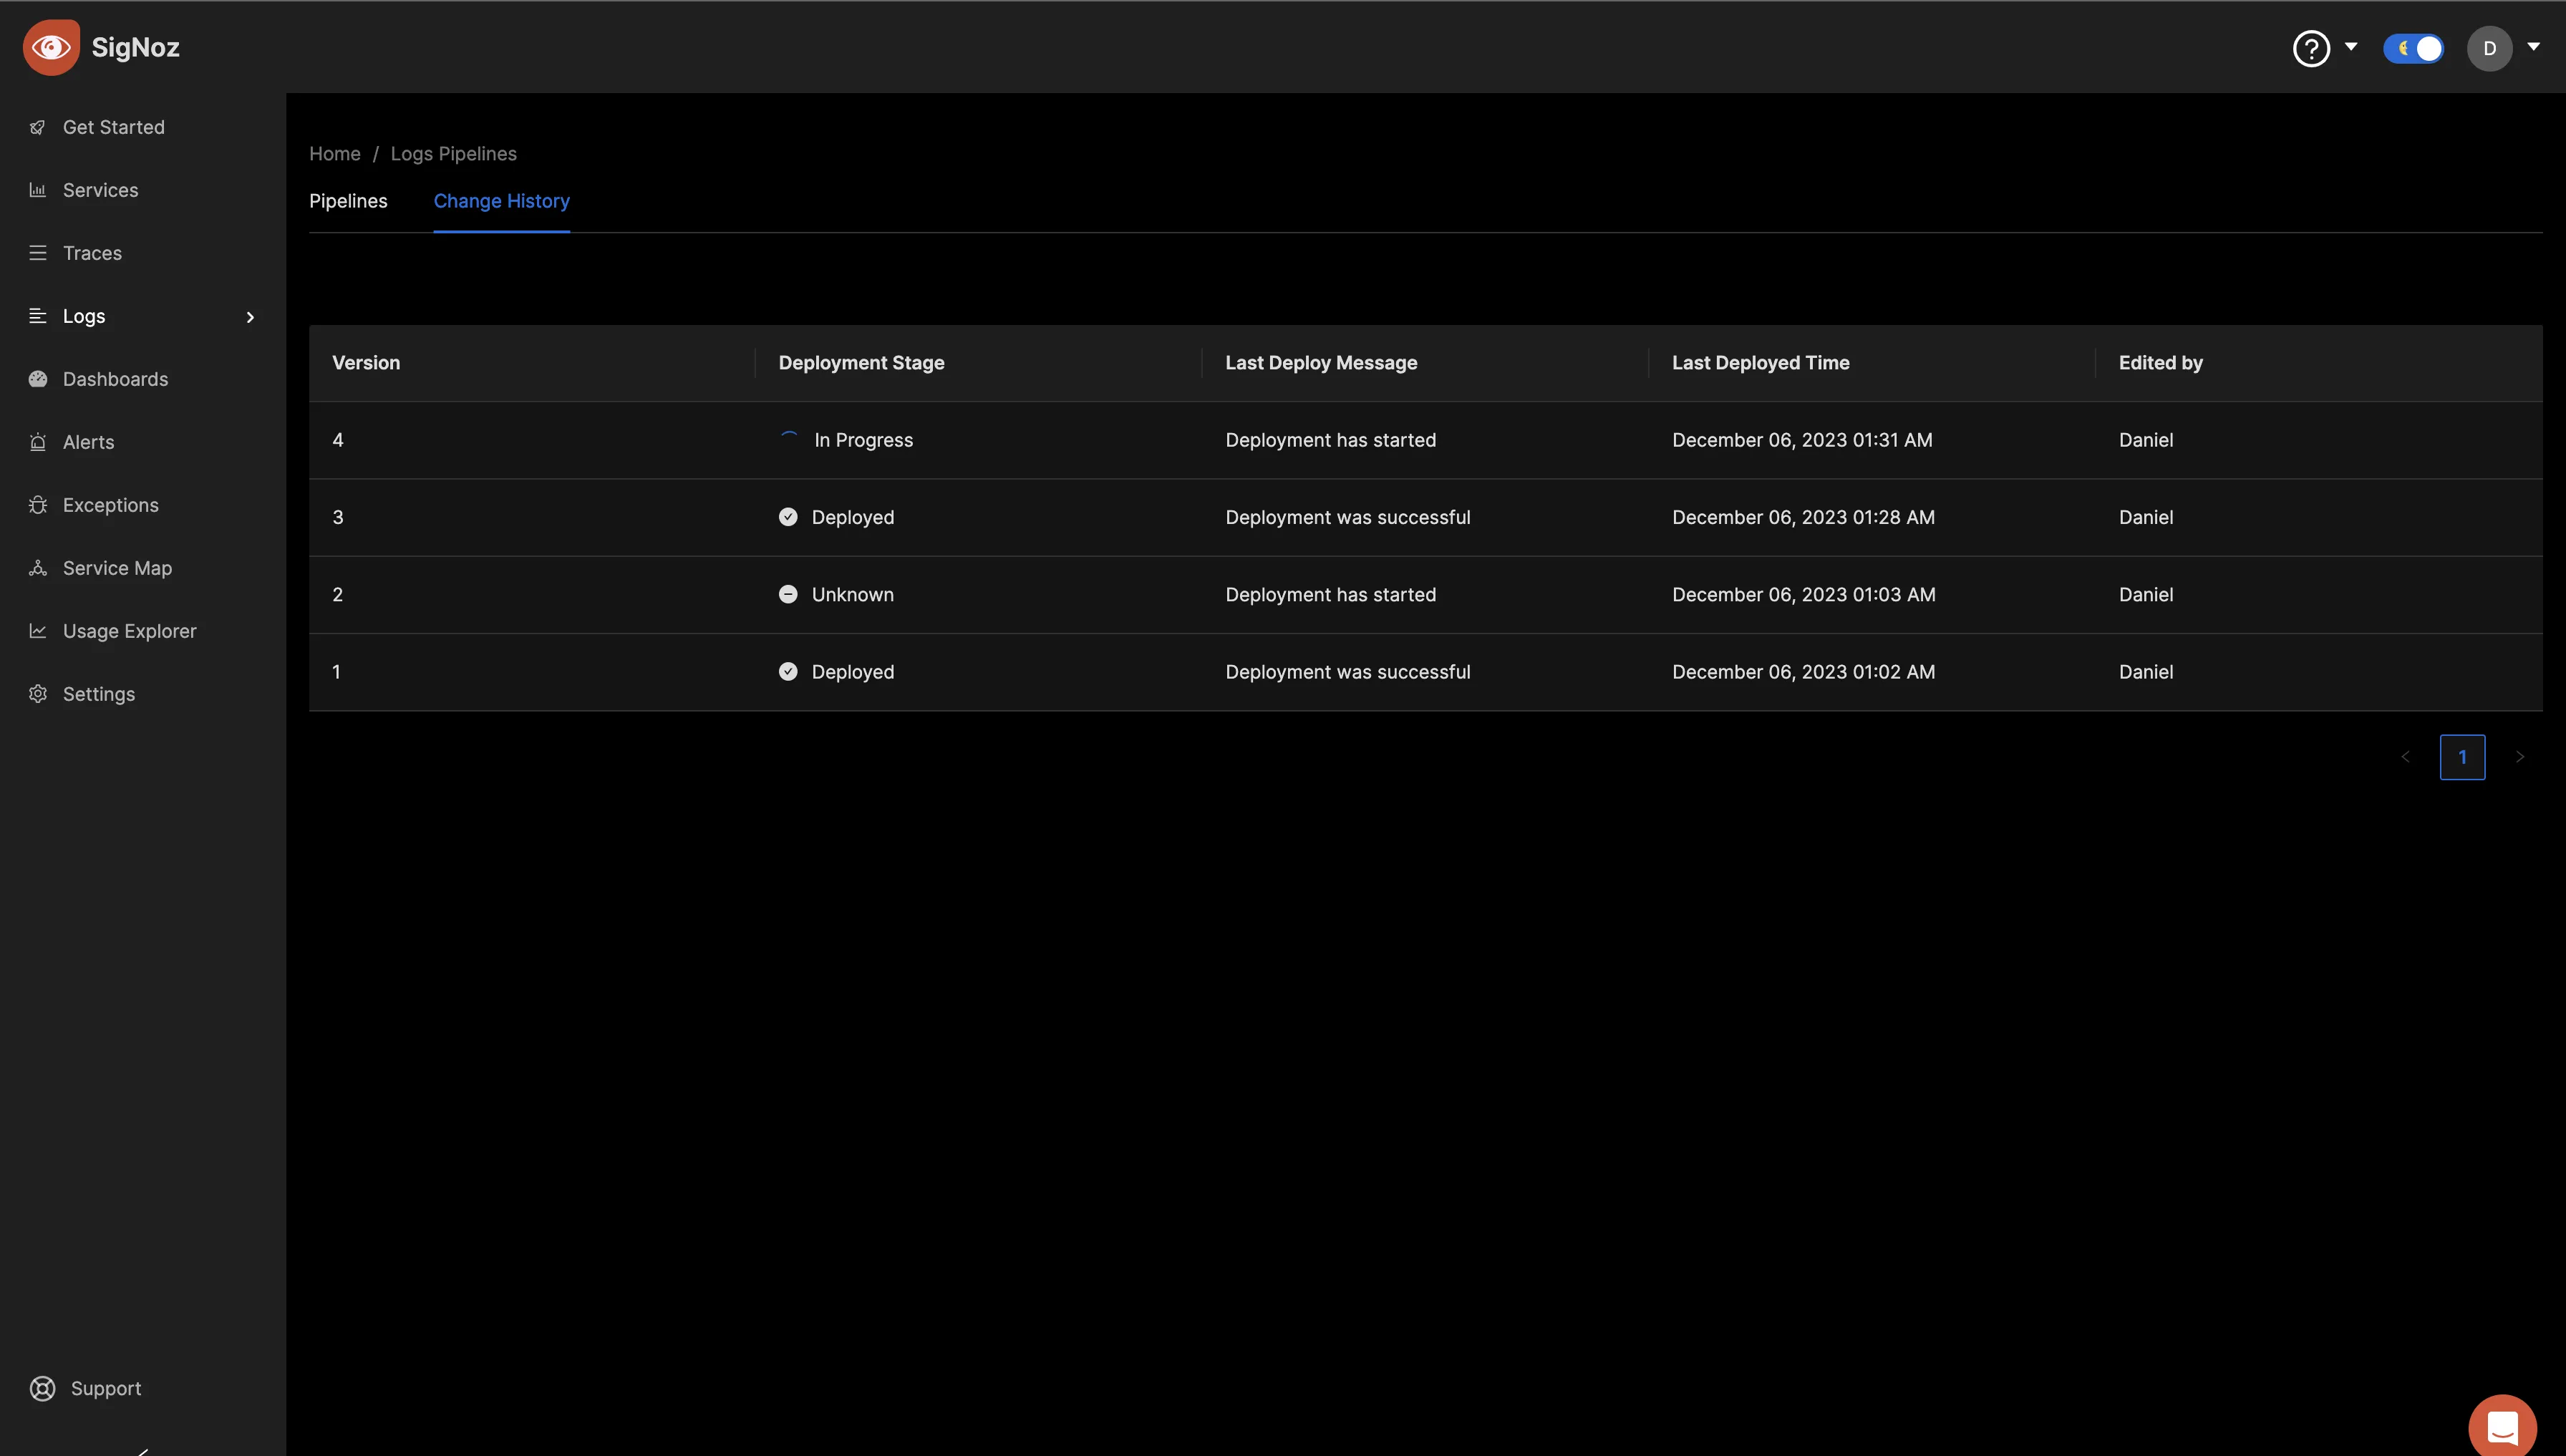
Save the pipeline settings and navigate to the "Change History" tab to confirm the success of the deployment. Ensure that the “Deployment Stage” reads as "Deployed" before proceeding, as this signifies the completion of the deployment process triggered by saving the pipeline settings.
Return to the “Logs Explorer” tab to perform log queries using the configured regex filter fields. In the "Group by" input box, you should be able to see the new fields set through the Regex processor.
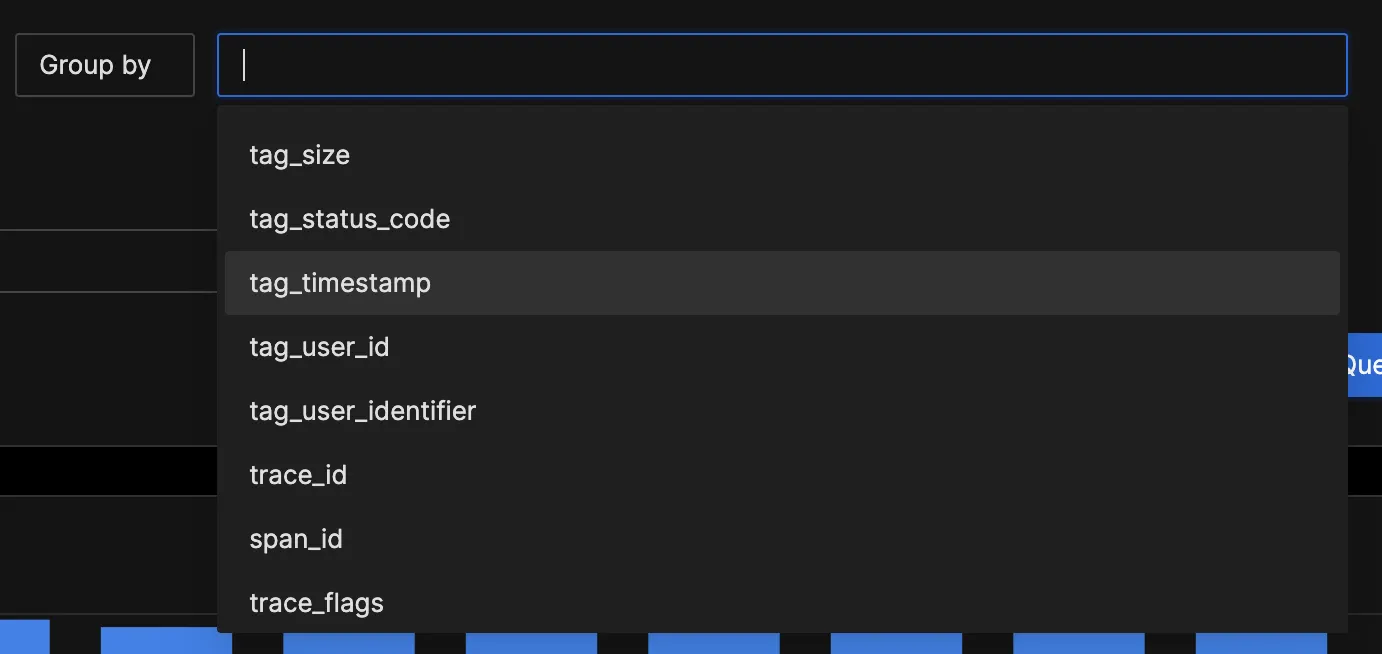
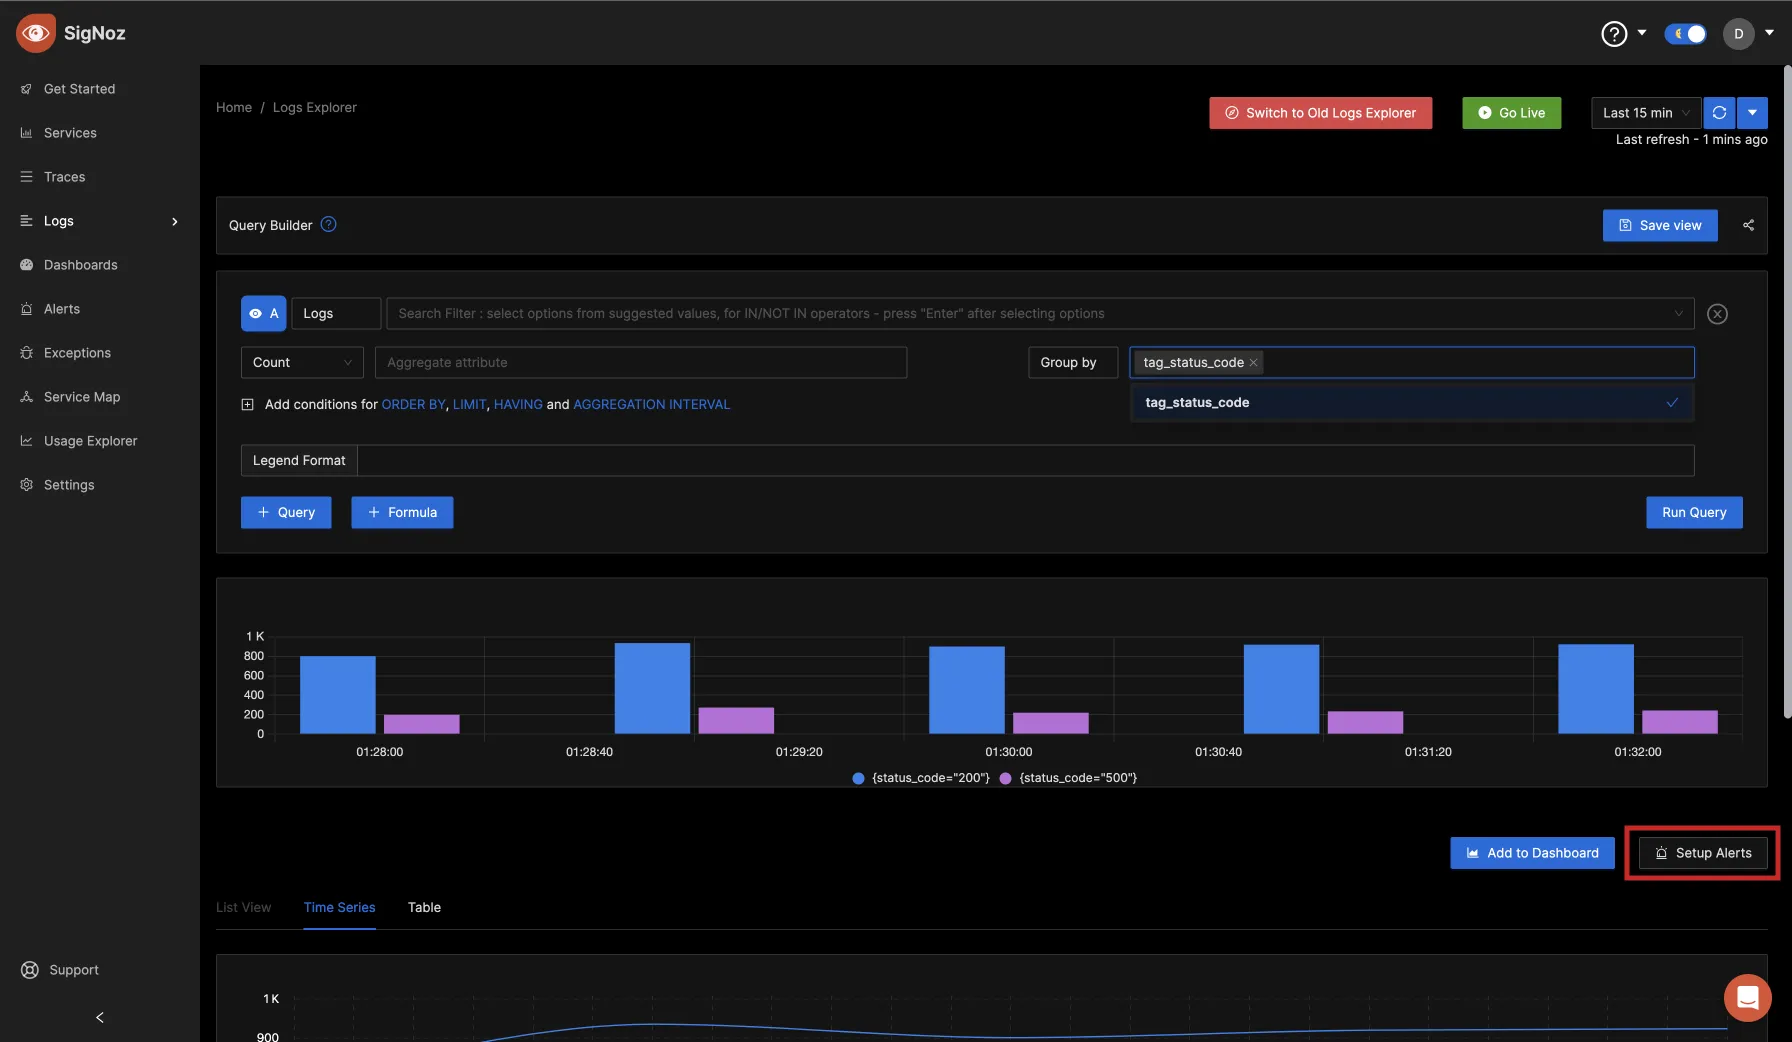
Click on "tag_status_code" and run the query.
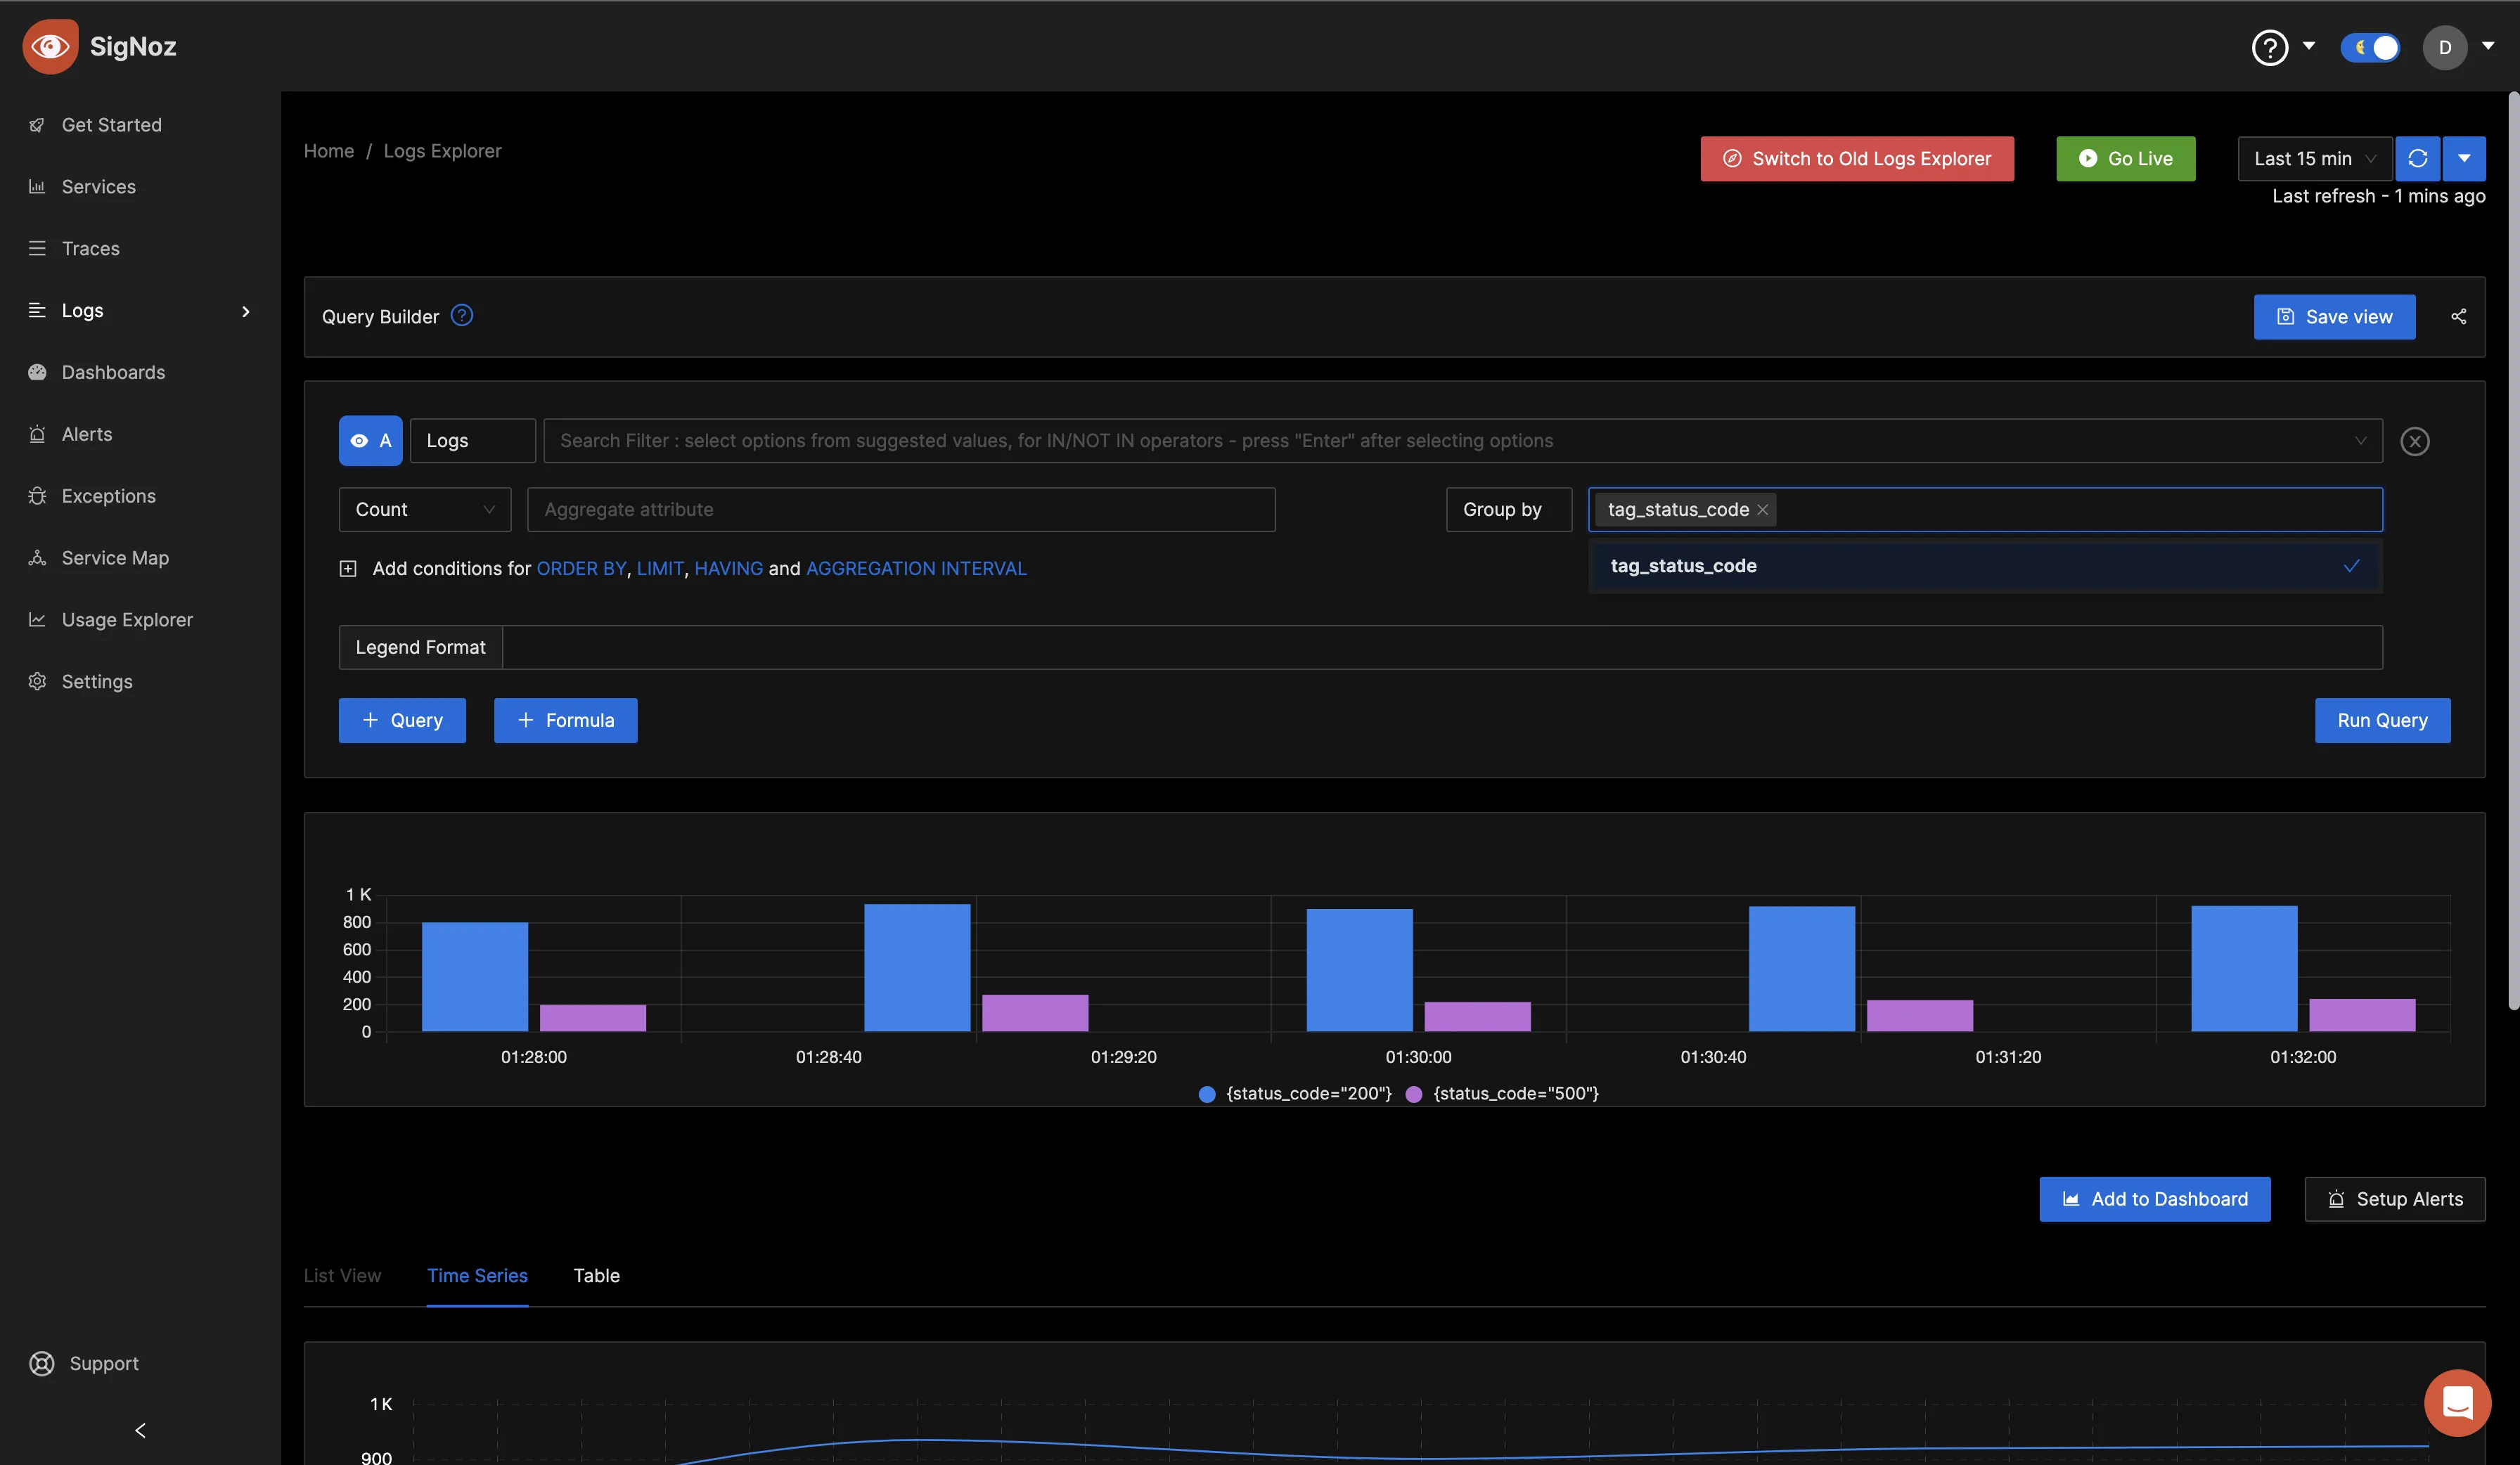
Setting up alerts
You can set up alerts from queries that you run directly. From the previous query, click on the Setup Alerts button.
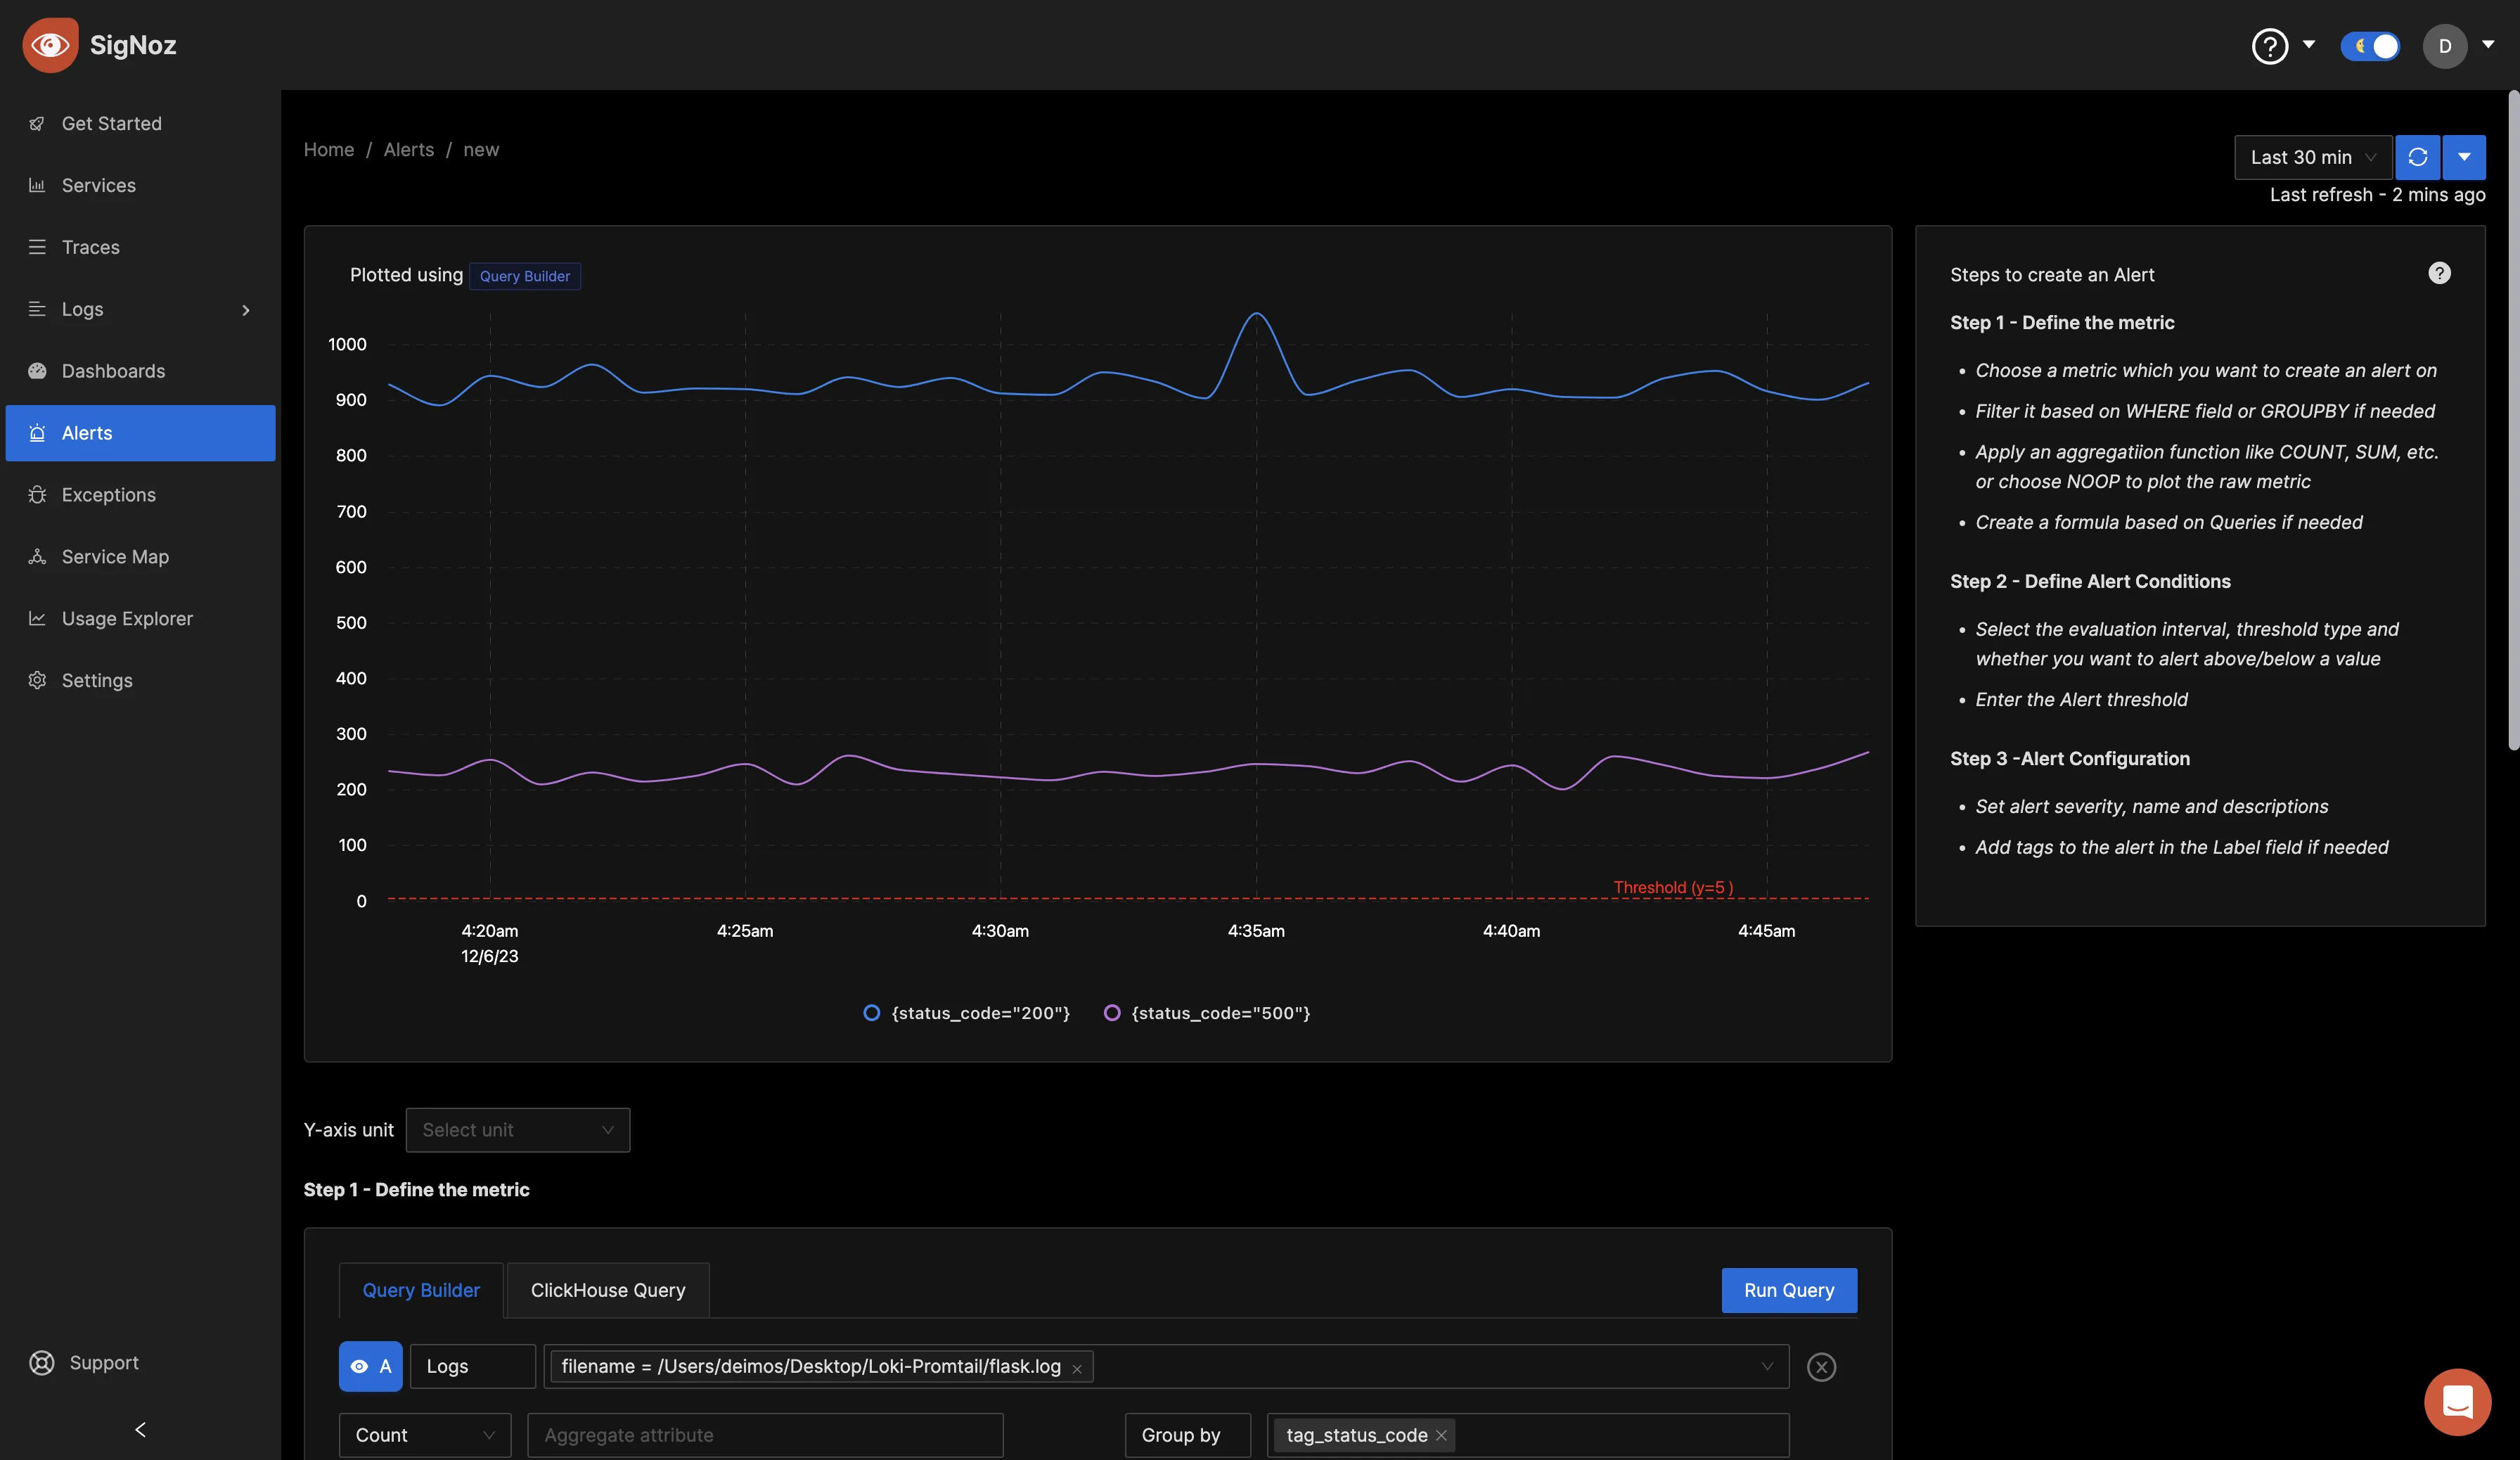
Define the metric
Set your filter to whatever information you want to filter from your logs, and choose the metrics of your choice.
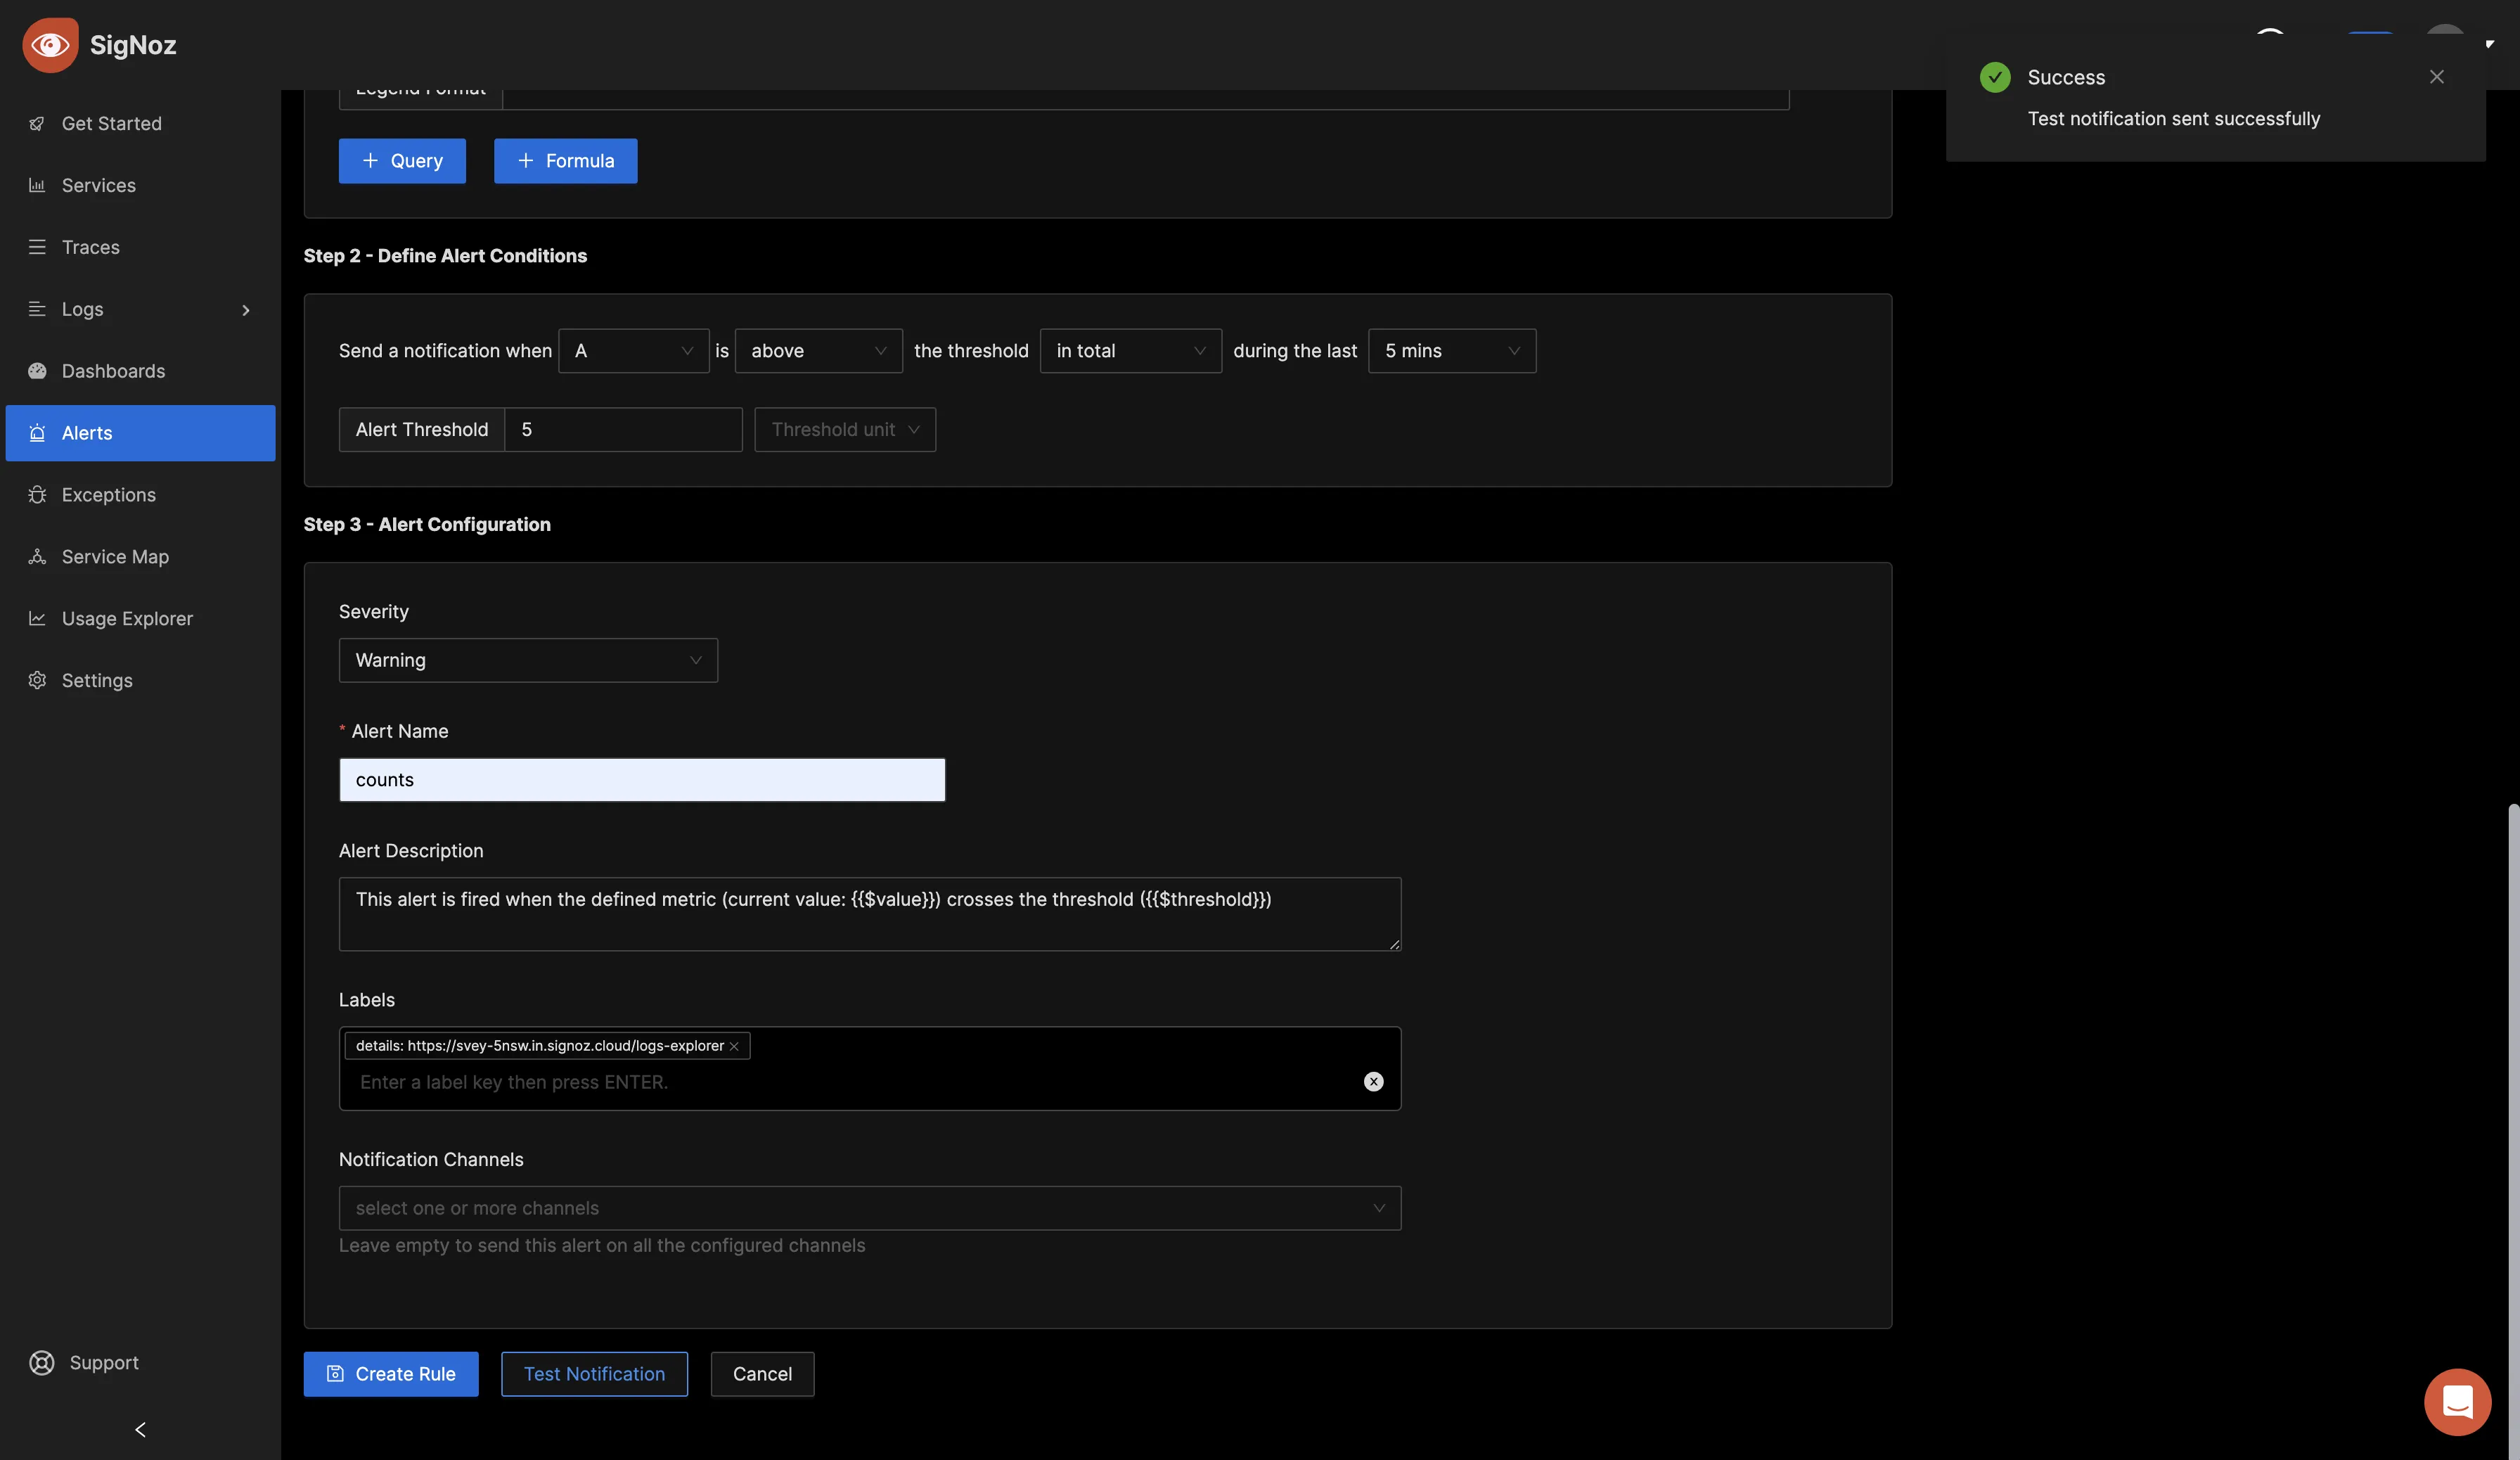
Define alert conditions and configuration
Set the alert condition for your use case. The below alert condition is just a sample of how it can be set. In the alert configuration section, set the severity of your alert, the name, description, labels, and the notification channel the alert should go to. To learn how to set up notification channels for alerting, check out the docs.
Test the notification, and if it shows success, proceed to create the alert rule.
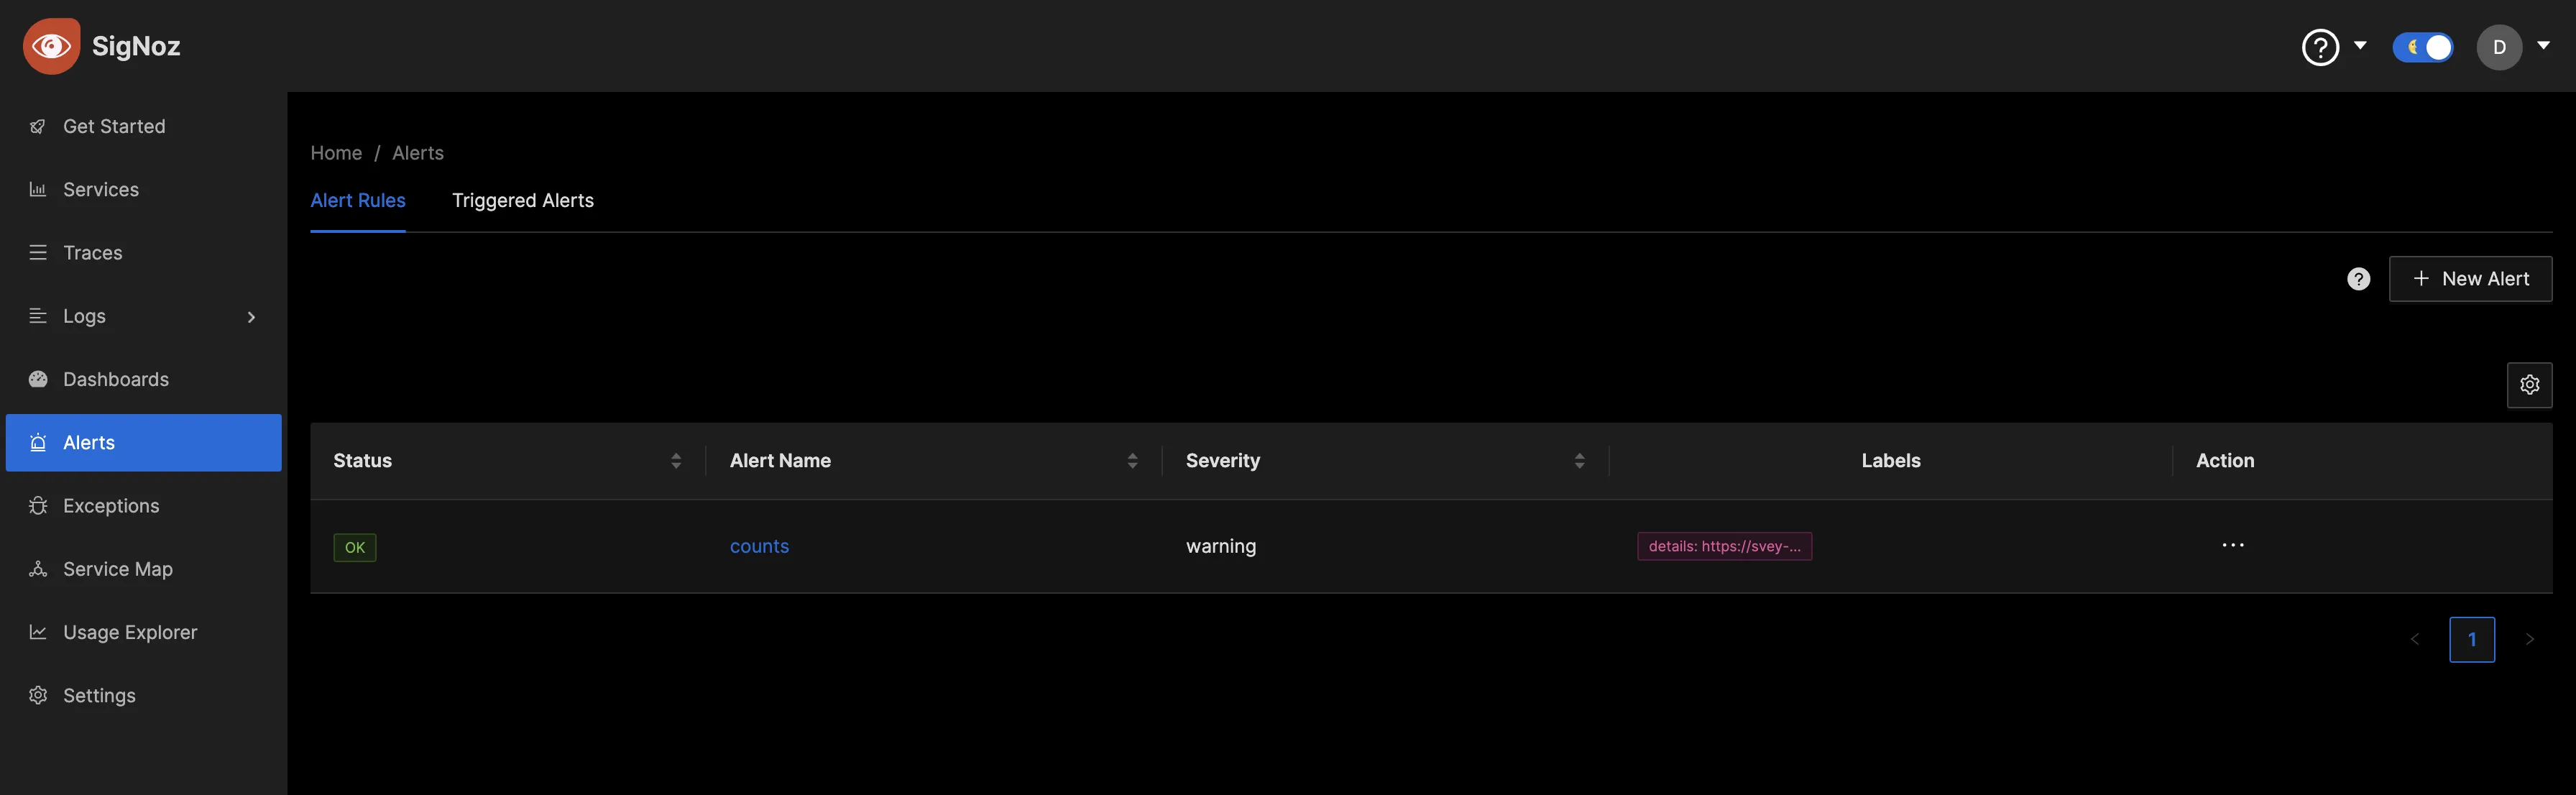
In the Alert tab, under the Alert rules section, you can see the alerts you have set up.
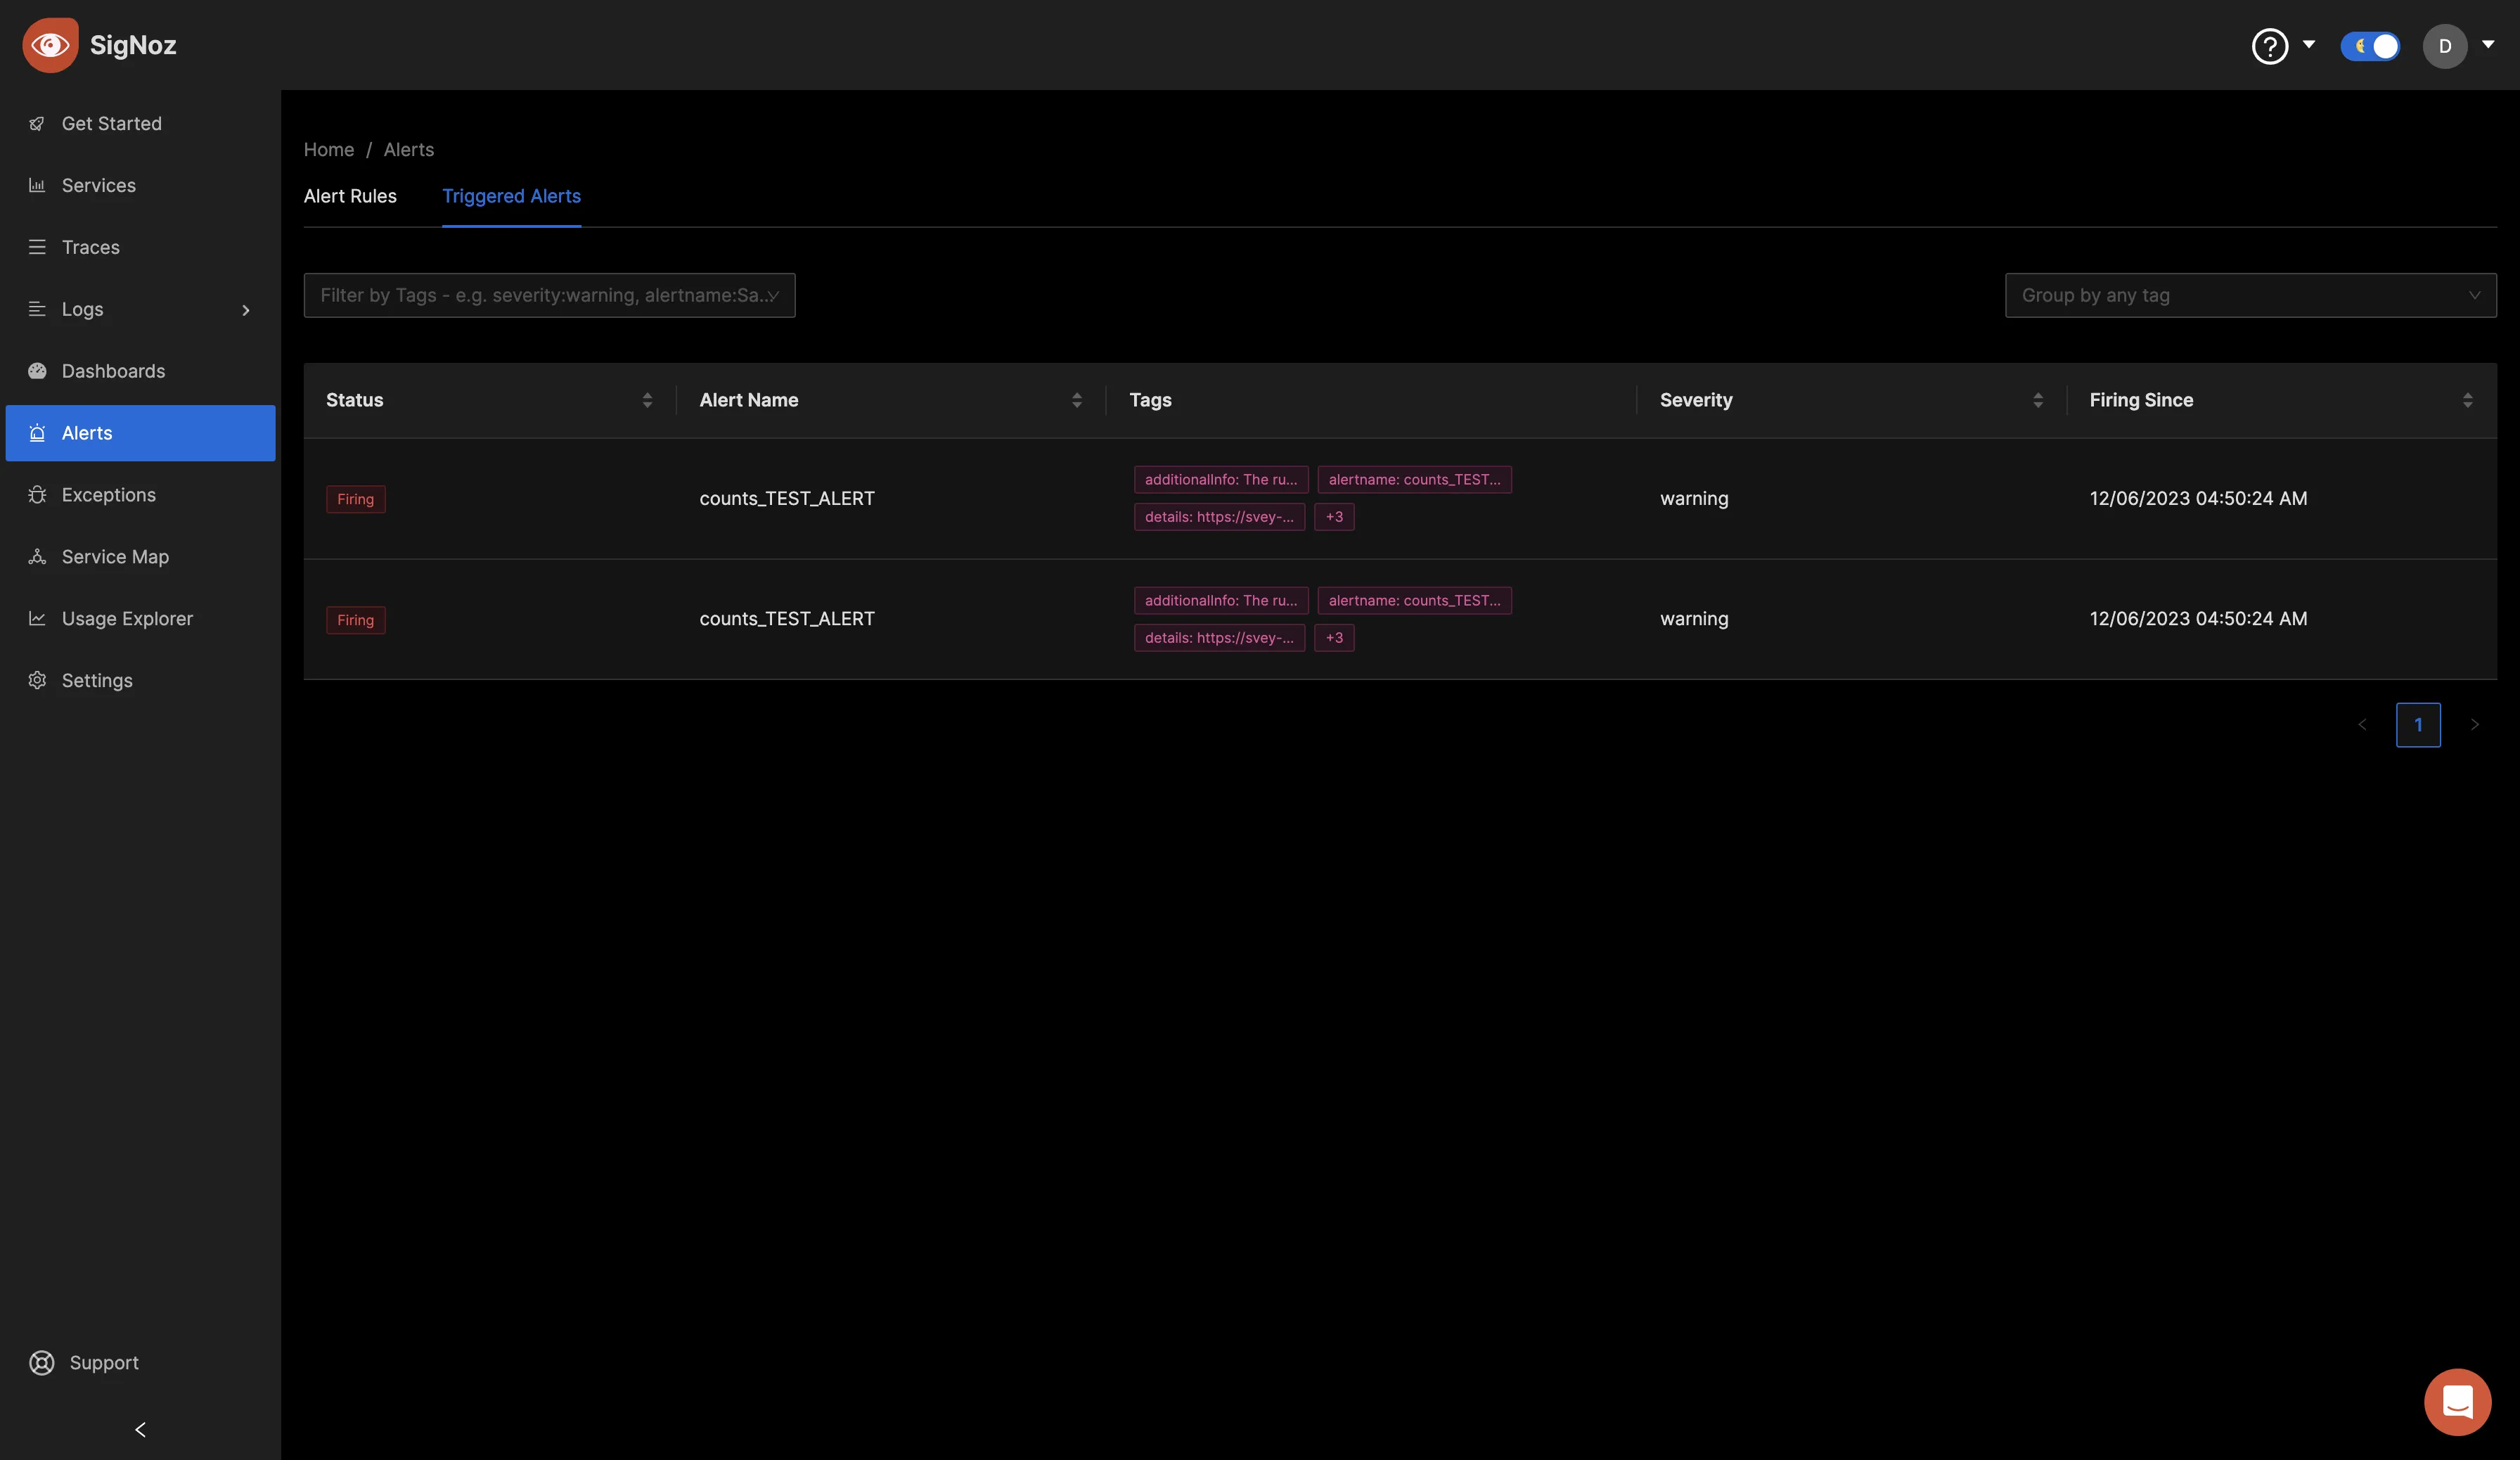
Within the Triggered Alerts section, you can view alerts that have already been triggered. This indicates that the alert rule has surpassed its defined threshold, prompting the system to send a notification to the specified alerting channel.
Conclusion
In this tutorial, you collected logs from a Loki receiver using the OpenTelemetry Collector and sent the logs to SigNoz for monitoring and visualization.
Visit our complete guide on OpenTelemetry Collector to learn more about it.
OpenTelemetry is becoming a global standard for open-source observability, offering advantages such as a unified standard for all telemetry signals and avoiding vendor lock-in. With OpenTelemetry, instrumenting your applications to collect logs, metrics, and traces becomes seamless, and you can monitor and visualize your telemetry data with SigNoz.
SigNoz is an open-source OpenTelemetry-native APM that can be used as a single backend for all your observability needs.
Further Reading
