Winston Logger - Full tutorial with a sample Nodejs application
Winston Logger is one of the most popular logging libraries for Node.js. It is designed to be a simple and universal logging library supporting multiple modes of transport. A transport is essentially a storage device for the logs.

Each logger can have multiple modes of transport configured at different levels. For example, one may want error logs stored in a database, but all logs output to the console or a local file.
Some of the features of Winston logger are:
- Logging Levels
- Transports
- Formats
- Profiling
What are logging levels in Winston logger?
Logging levels in winston follow the severity ordering specified by RFC5424: severity of all levels is assumed to be numerically ascending from most important to least important*.*
Each level is given a specific integer priority. The higher the priority, the more important the message is considered, and the lower the corresponding integer priority. For example, as specified in RFC5424 the syslog levels are prioritized from 0 to 7 (highest to lowest).
{
  emerg: 0,
  alert: 1,
  crit: 2,
  error: 3,
  warning: 4,
  notice: 5,
  info: 6,
  debug: 7
}
Similarly, npm logging levels are prioritized from 0 to 6 (highest to lowest):
{
  error: 0,
  warn: 1,
  info: 2,
  http: 3,
  verbose: 4,
  debug: 5,
  silly: 6
}
What are Transports in Winston logger?
A transport is a storage device or output mechanism for our logs. Each Winston logger can have multiple modes of transport configured at different levels.
Winston comes with three core modes of transport: console, file, and HTTP. The transports must be created and added to the loggers.
Here's how we initialize different transports:
Console Transport:
logger.add(new winston.transports.Console(options));File Transport:
logger.add(new winston.transports.File(options));HTTP Transport:
logger.add(new winston.transports.Http(options));
Formats in Winston logger
Formats in winston can be accessed from winston.format. They are implemented in logform, a separate module from winston. This allows flexibility when writing your transports in case you wish to include a default format with your transport.
In modern versions of node template strings are very performant and are the recommended way for doing most end-user formatting.
Profiling with Winston logger
In addition to logging messages and metadata, winston also has a simple profiling mechanism implemented for any logger.
All profile messages are set to the 'info' level by default, and both message and metadata are optional. For individual profile messages, you can override the default log level by supplying a metadata object with a level property:
logger.profile('test', { level: 'debug' });
Prerequisites
Getting Started with Winston Logger
Create a node project in the current directory:
mkdir winston-nodejs-example
cd winston-nodejs-example
Initialize an npm project:
npm init -y
Install express and winston packages:
npm i winston express
Create an entry file called index.js file:
touch index.js
Create a basic hello world express app:
const express = require("express");
const PORT = process.env.PORT || "5555";
const app = express();

app.use(express.json())

app.get("/", (req, res) => {
    res.json({ method: req.method, message: "Hello World", ...req.body });
});

app.get('/404', (req, res) => {
    res.sendStatus(404);
})

app.get("/user", (req, res, next) => {
    try {
      throw new Error("Invalid user");
    } catch (error) {
      res.status(500).send("Error!");
    }
  });

app.listen(parseInt(PORT, 10), () => {
    console.log(`Listening on http://localhost:${PORT}`);
});
Run the server with the below command and hit http://localhost:5555:
node index.js
If done correctly, the console should show Listening on http://localhost:5555
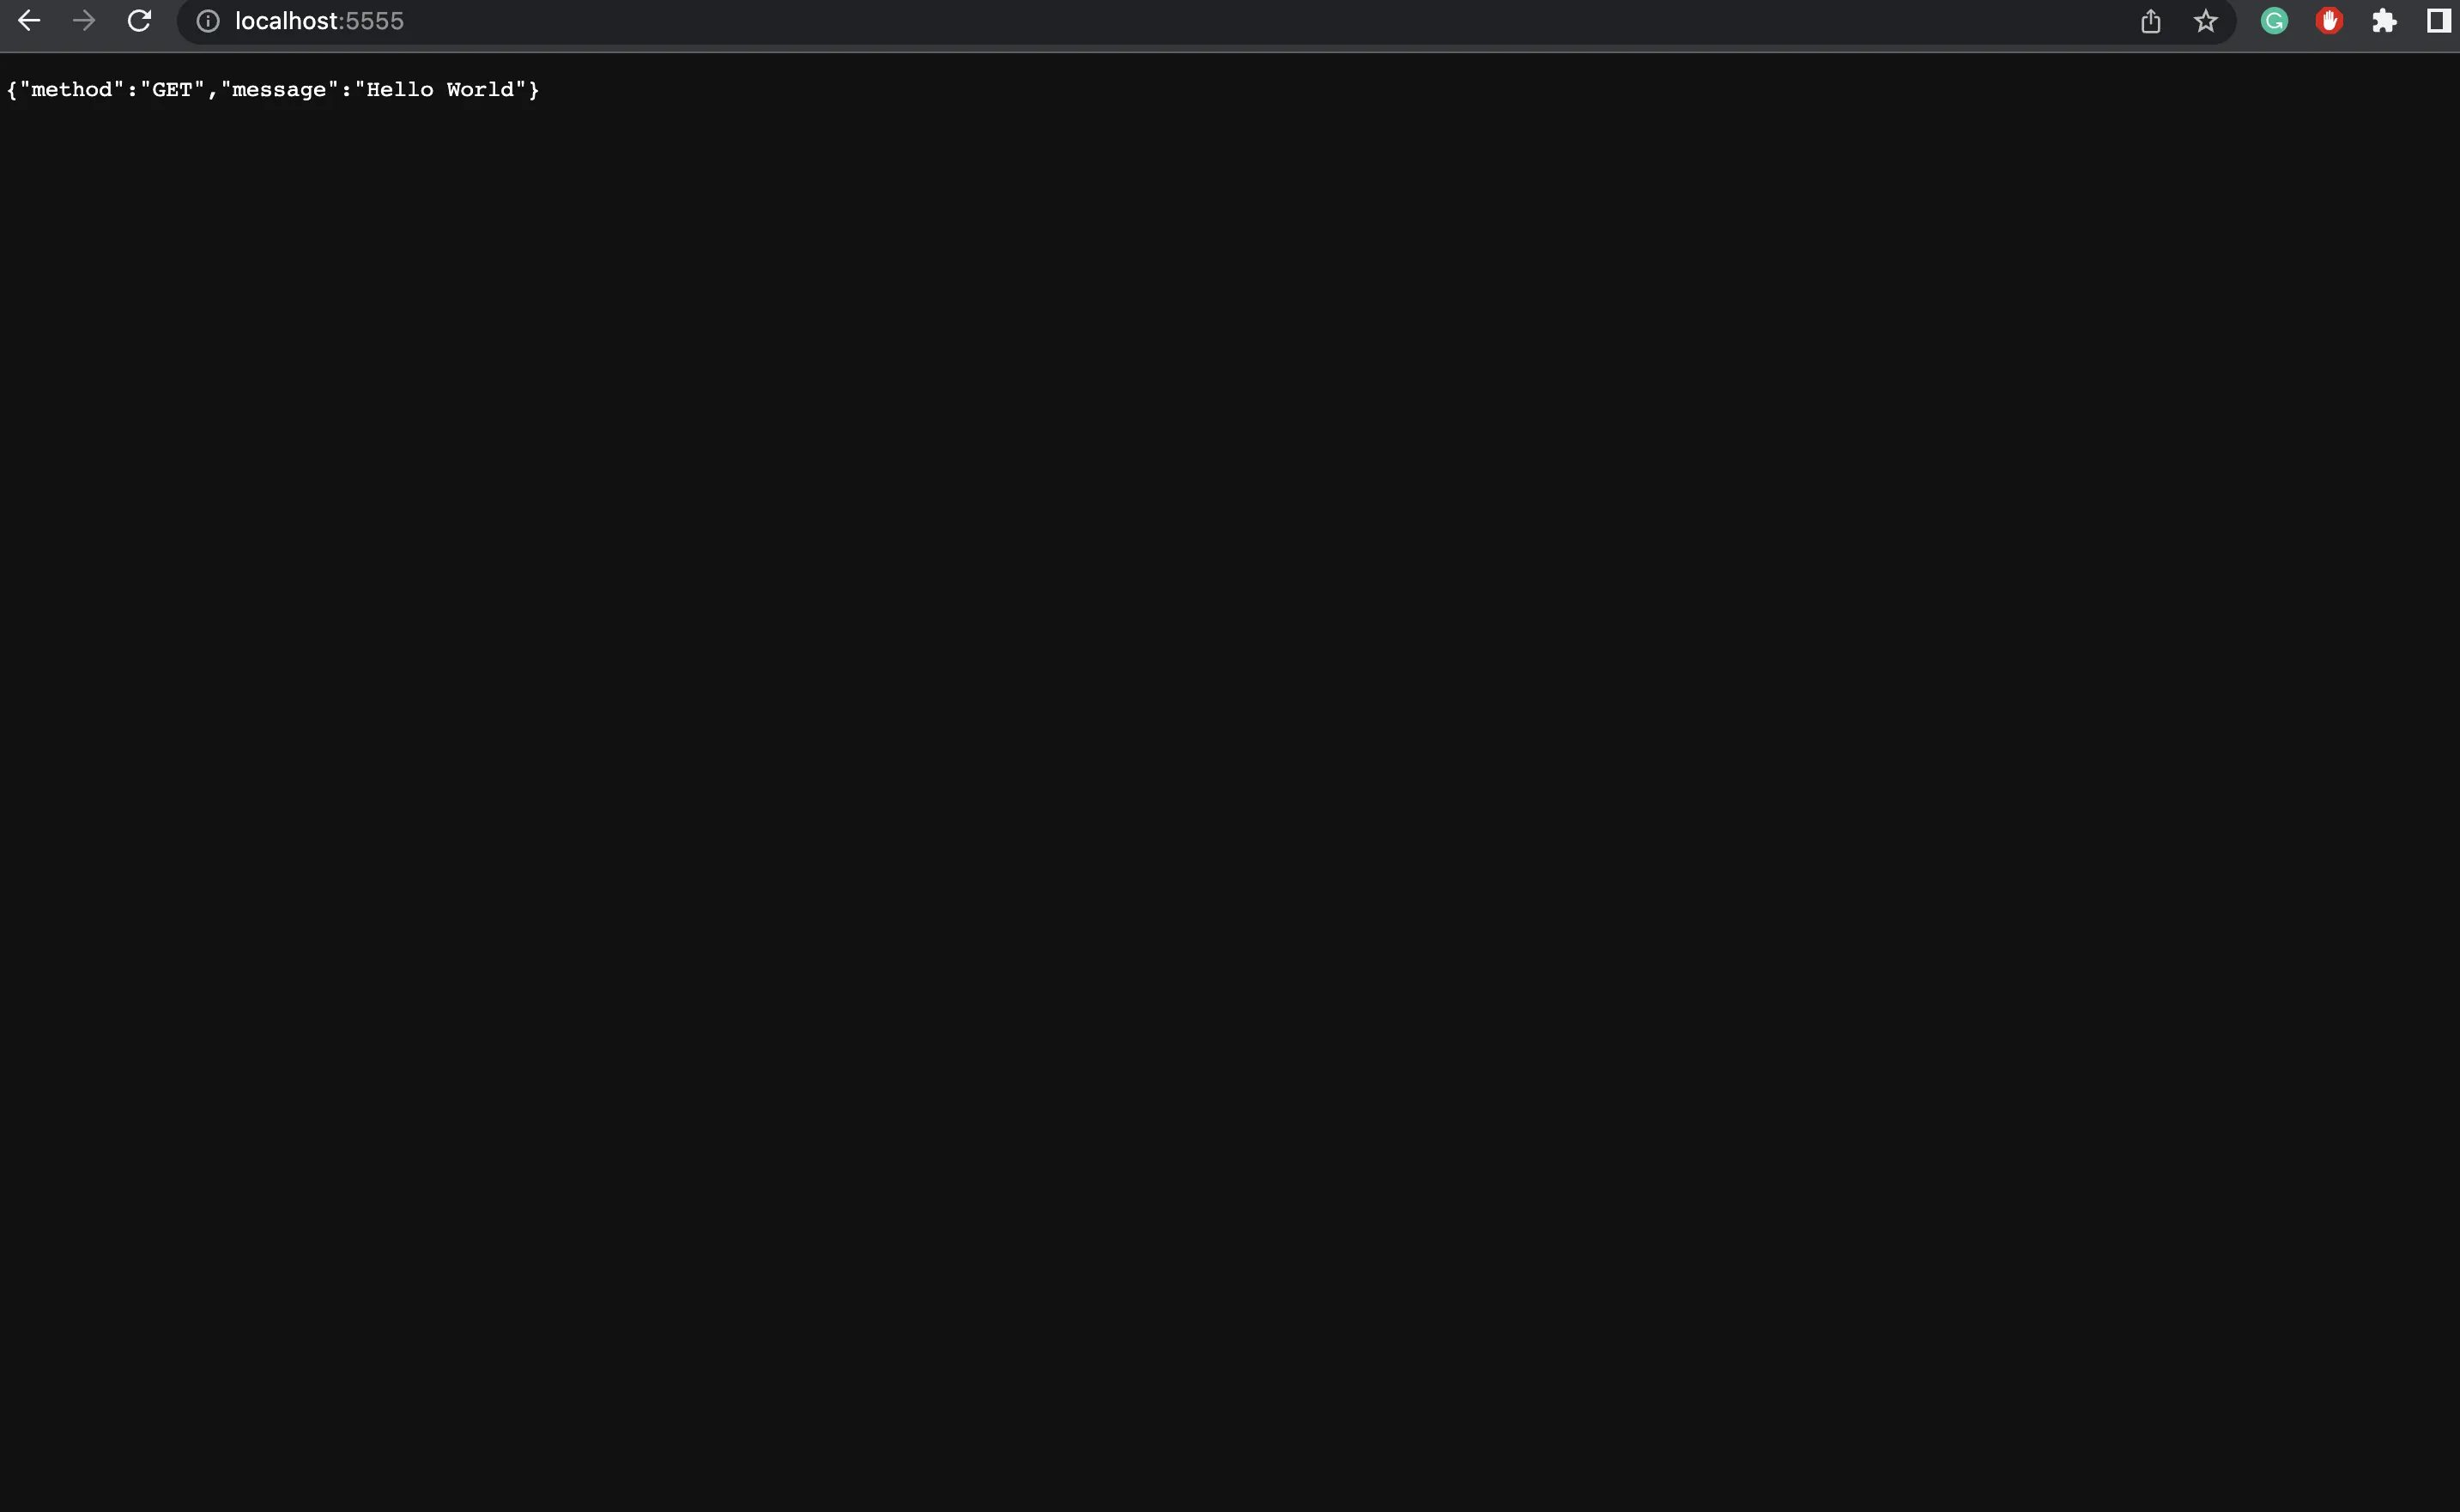
Now, in the current directory, create a logger.js file in which we will be configuring the winston logger:
const {createLogger, format, transports} = require("winston");

const logger = createLogger({
  level: "debug",
  format: format.json(),
  transports: [new transports.Console()],
});

module.exports = logger;
At this point, the project structure should look like this:
/node_modules
/index.js
/logger.js
/package-lock.json
/package.json
Import the logger and use it wherever required. The final index.js after using the logger looks something like this:
const express = require("express");
const logger = require("./logger");
const PORT = process.env.PORT || "5555";
const app = express();

app.use(express.json())

app.get("/", (req, res) => {
    logger.log("debug", "Hello, World!"); //debug level as first param
    logger.debug("The is the home '/' route.");
    // using debug method directly
    res.json({ method: req.method, message: "Hello World", ...req.body });
});

app.get('/404', (req, res) => {
    logger.error("404 error"); //error method
    logger.debug("The is the 404 route.");
    res.sendStatus(404);
})

app.get("/user", (req, res) => {
    try {
      throw new Error("Invalid user");
    } catch (error) {
      logger.error("Auth Error: invalid user");
      logger.debug("The is the user route.");
      res.status(500).send("Error!");
    }
  });

app.listen(parseInt(PORT, 10), () => {
    console.log(`Listening on http://localhost:${PORT}`);
});
Logs will be captured depending on the route we hit.
Home route

Home route logs

User error route

User error logs

404 route
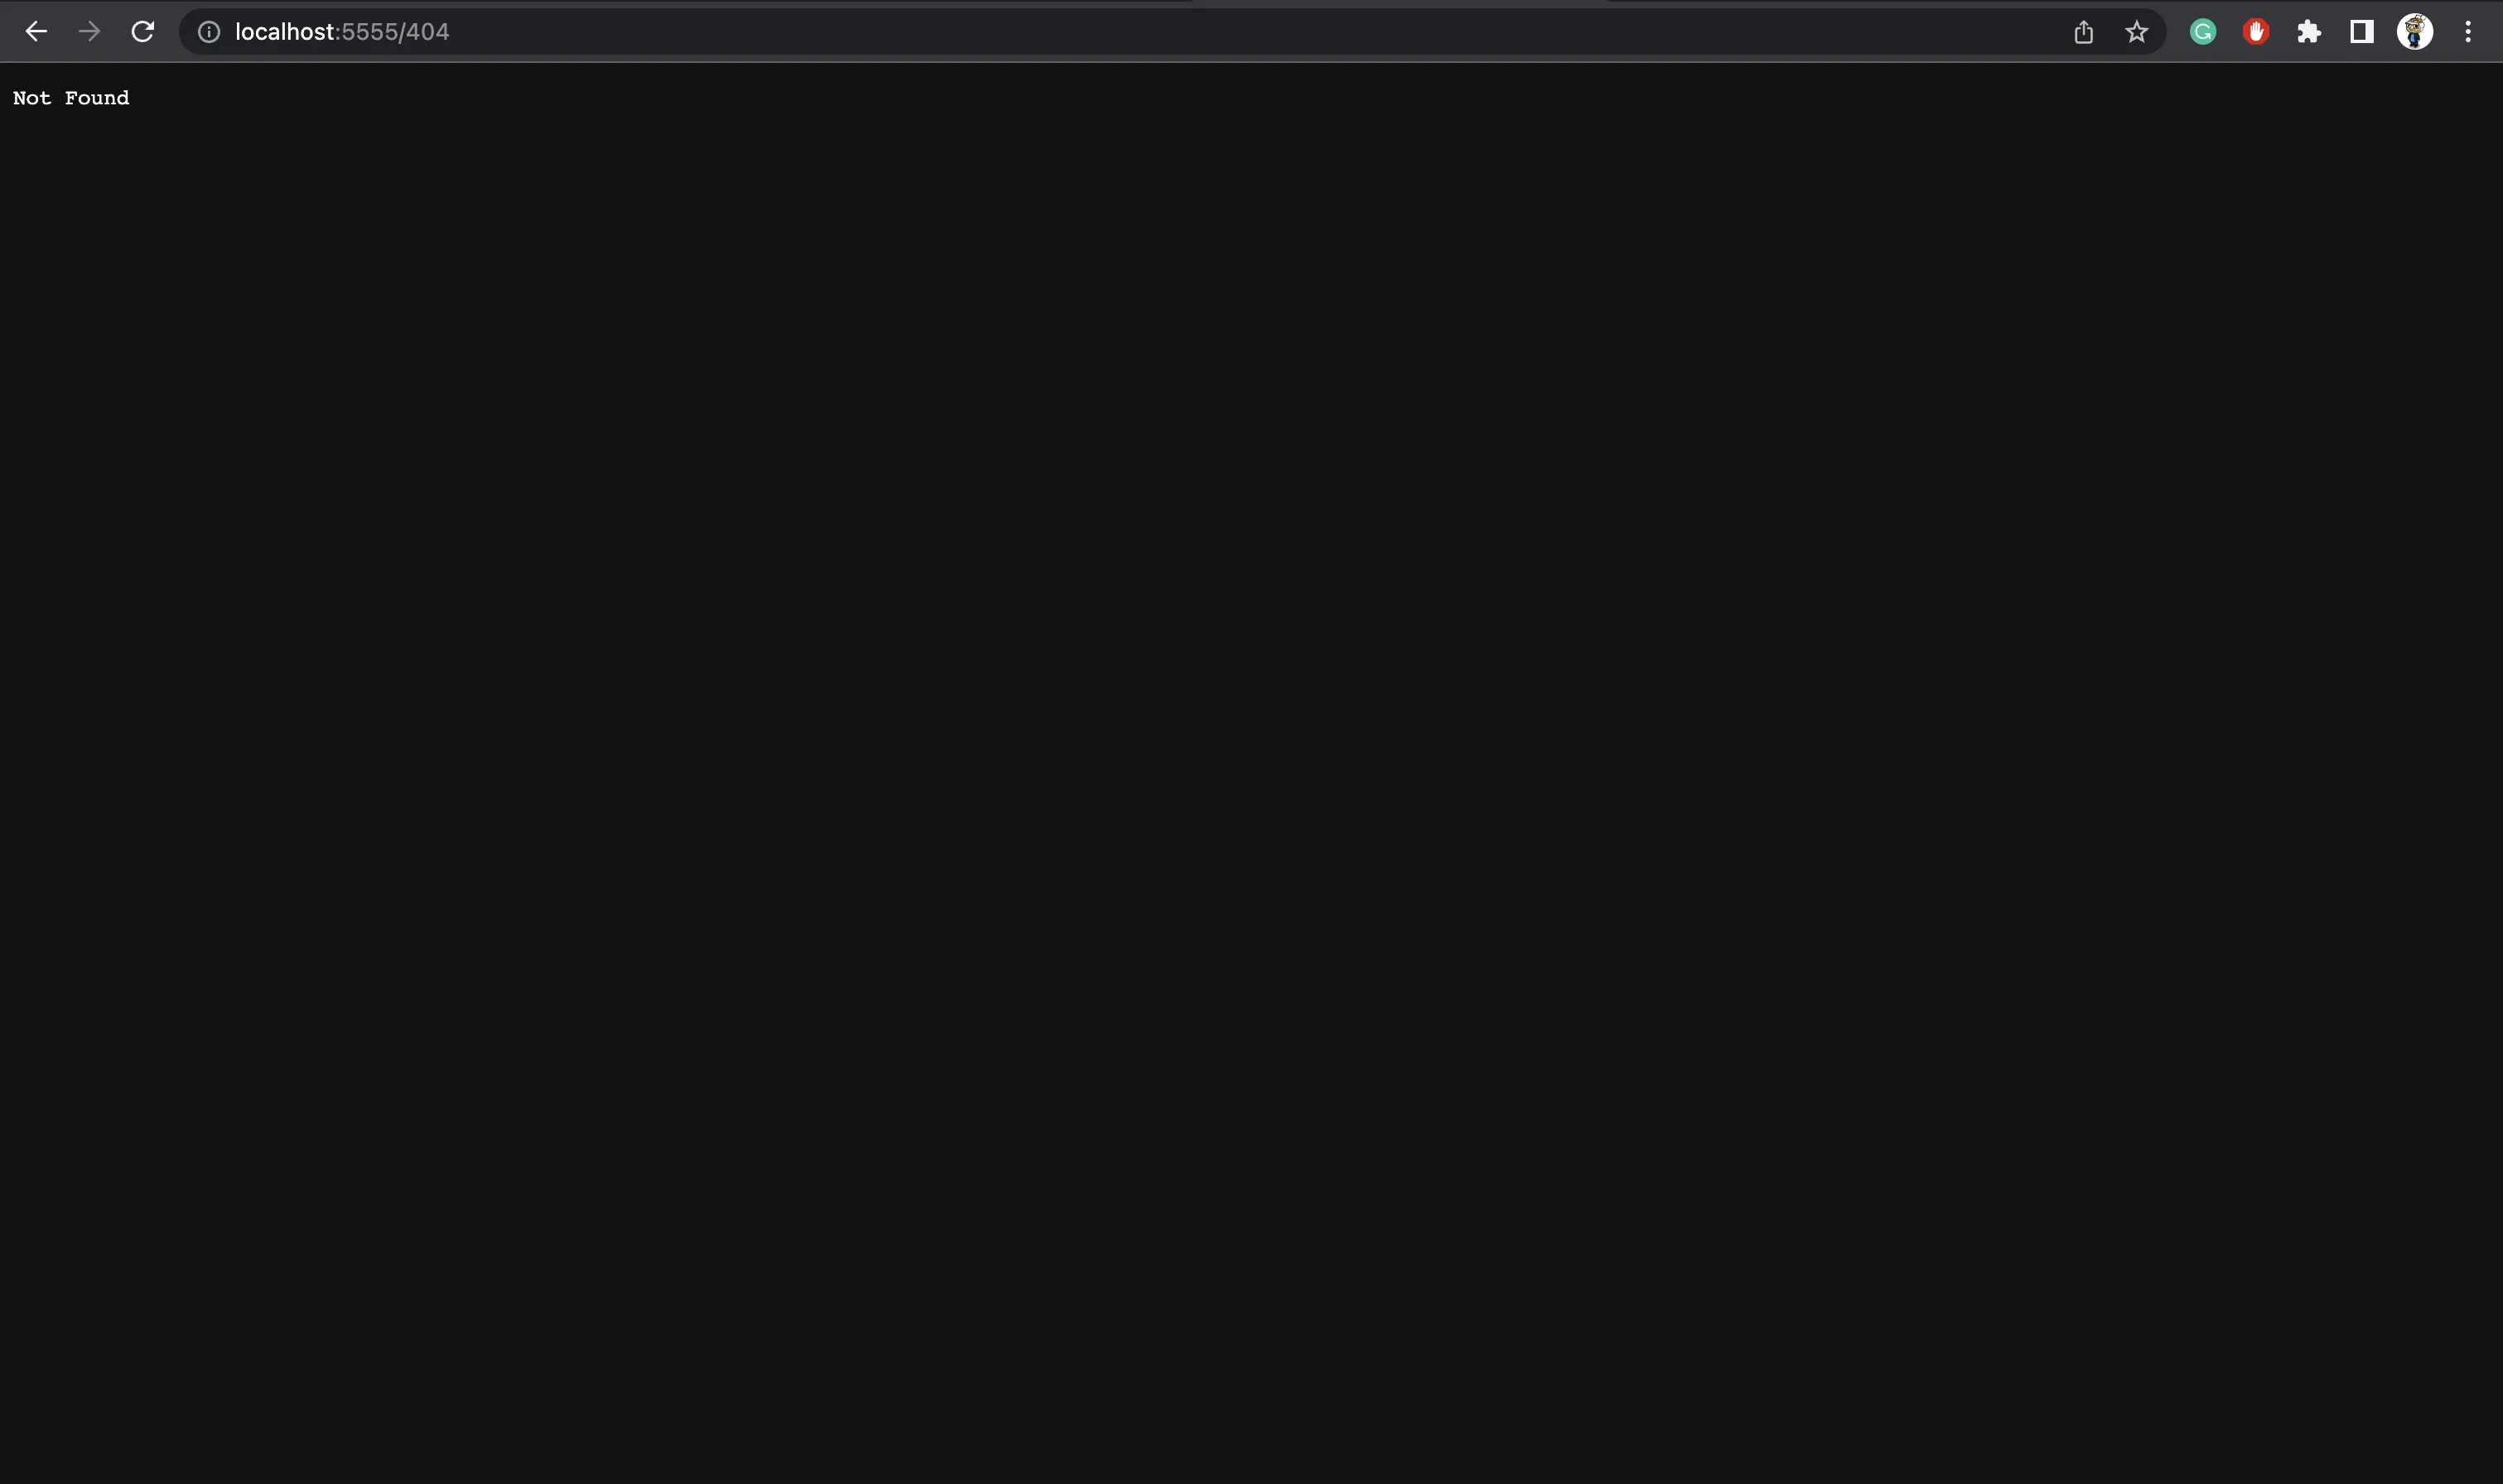
404 route logs

In a production environment, you will need a log management tool to store and manage your logs efficiently. In this tutorial, we will use SigNoz - an open source APM and observability tool for logs collected by Winston logging library.
Log management in SigNoz
SigNoz is full-stack open source Application Performance Monitoring tool that you can use for monitoring logs, metrics, and traces. Having all the important telemetry signals under a single dashboard leads to less operational overhead. Users can also access telemetry data with richer context by correlating these signals.
SigNoz uses a columnar database - ClickHouse, for storing logs efficiently. Big companies like Uber and Cloudflare have shifted from Elasticsearch to ClickHouse for storing their log data.
Sending logs to SigNoz deployed on Docker
We will dockerize our nodejs application and run the application in Docker. We will be using the console transport for winston. If SigNoz is running on the same host, it will automatically start collecting logs of all the docker containers.
Installing and running the SigNoz app
SigNoz can be installed on macOS or Linux computers in just three steps by using a simple install script.
The install script automatically installs Docker Engine on Linux. However, on macOS, you must manually install Docker Engine before running the install script.
git clone -b main https://github.com/SigNoz/signoz.git
cd signoz/deploy/
./install.sh
You can visit the documentation for instructions on how to install SigNoz using Docker Swarm and Helm Charts.
Dockerising the Node app
Create a docker-compose.yaml file and paste the following code:
version: "3.9"

services:
  app:
    container_name: app
    image: app
    restart: always
    build:
      context: .
      dockerfile: Dockerfile
      target: base
    ports:
      - "${PORT}:${PORT}"
Create a Dockerfile (no file extension needed) and paste the following code:
FROM node:alpine as base

WORKDIR /winston-nodejs-example # current project name

COPY package.json ./

RUN rm -rf node_modules && npm i

COPY . .

CMD ["node",  "index.js"]
Before we can deploy our app on a Docker container, we need to set up the environment variable we will need to run the app. Create a file named .env in the root directory of your folder.
Since we defined the port as a variable in the docker-compose.yml file, we need to set the port in the .env file:
PORT=5555
Running the app
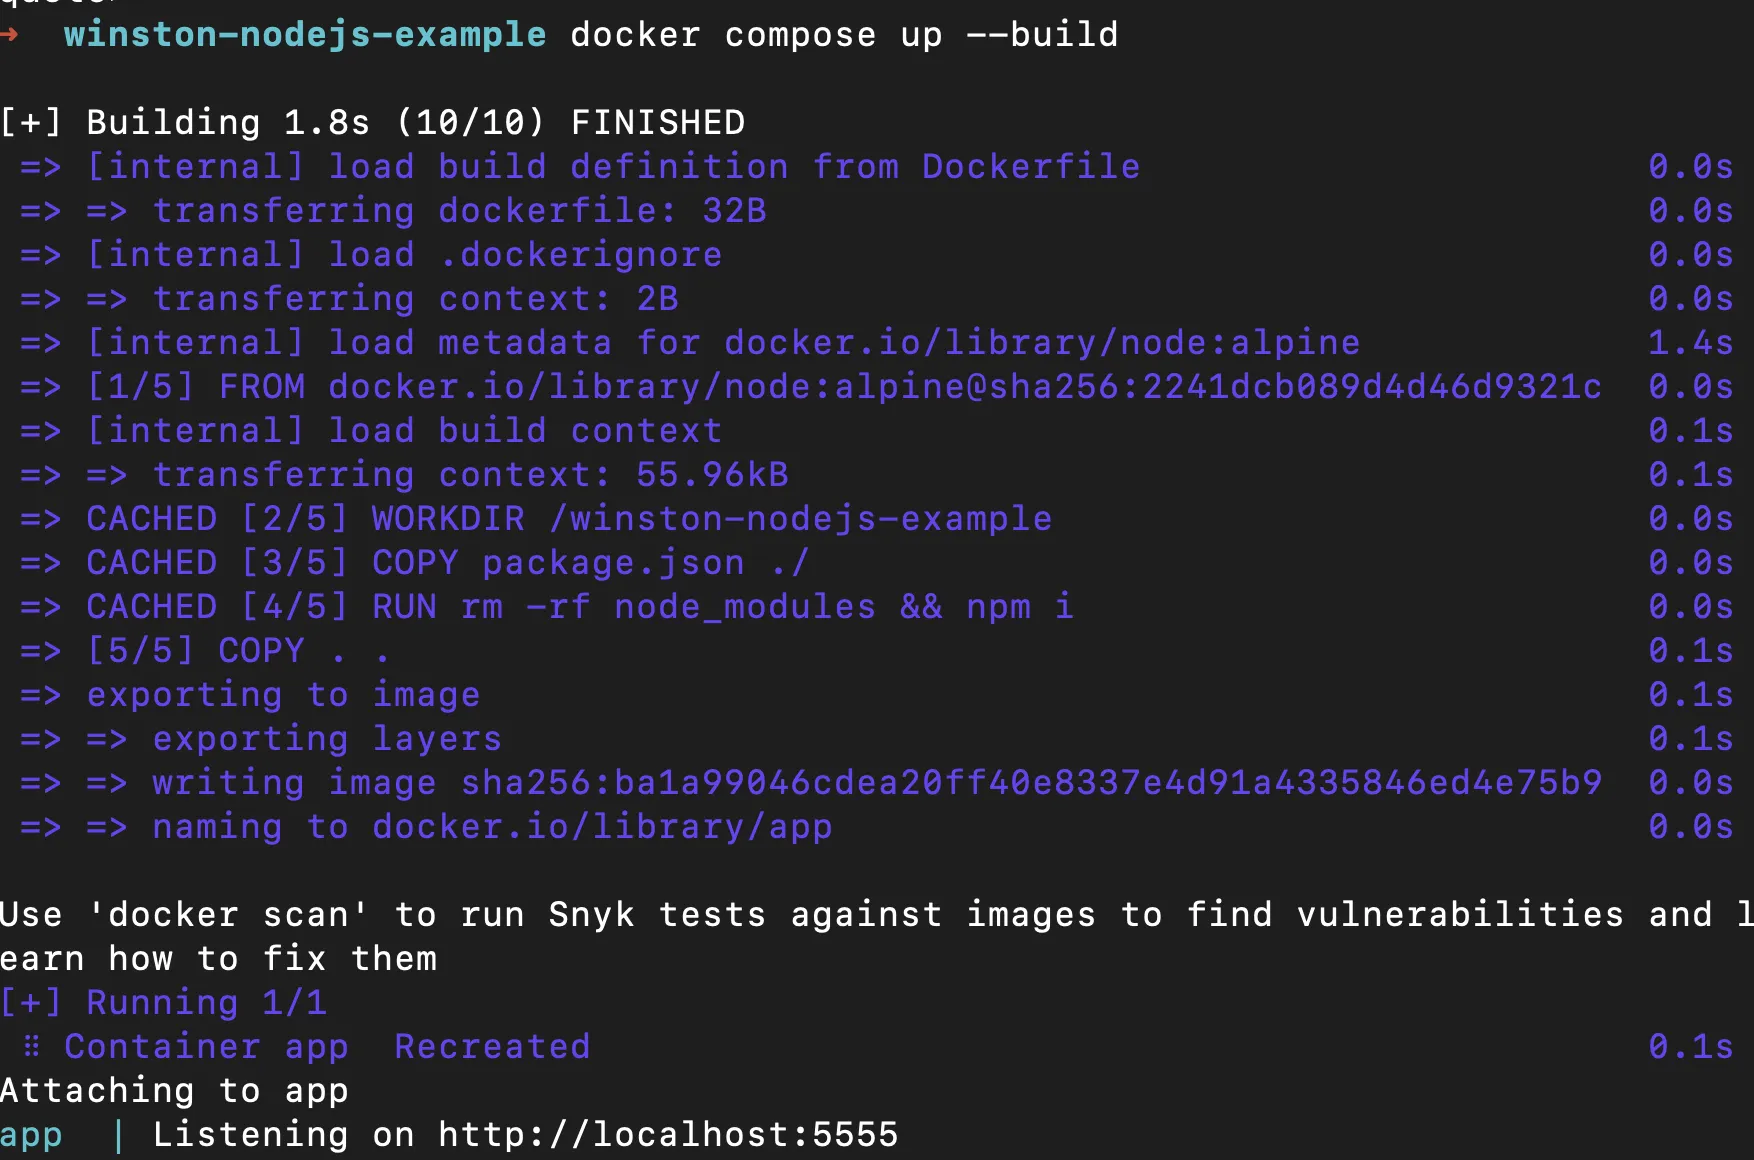
Finally, we can deploy the Node app on a Docker container. To do so, use Docker Compose:
docker compose up --build
Once the build is successfully run, you should be able to see the following logs on the console.
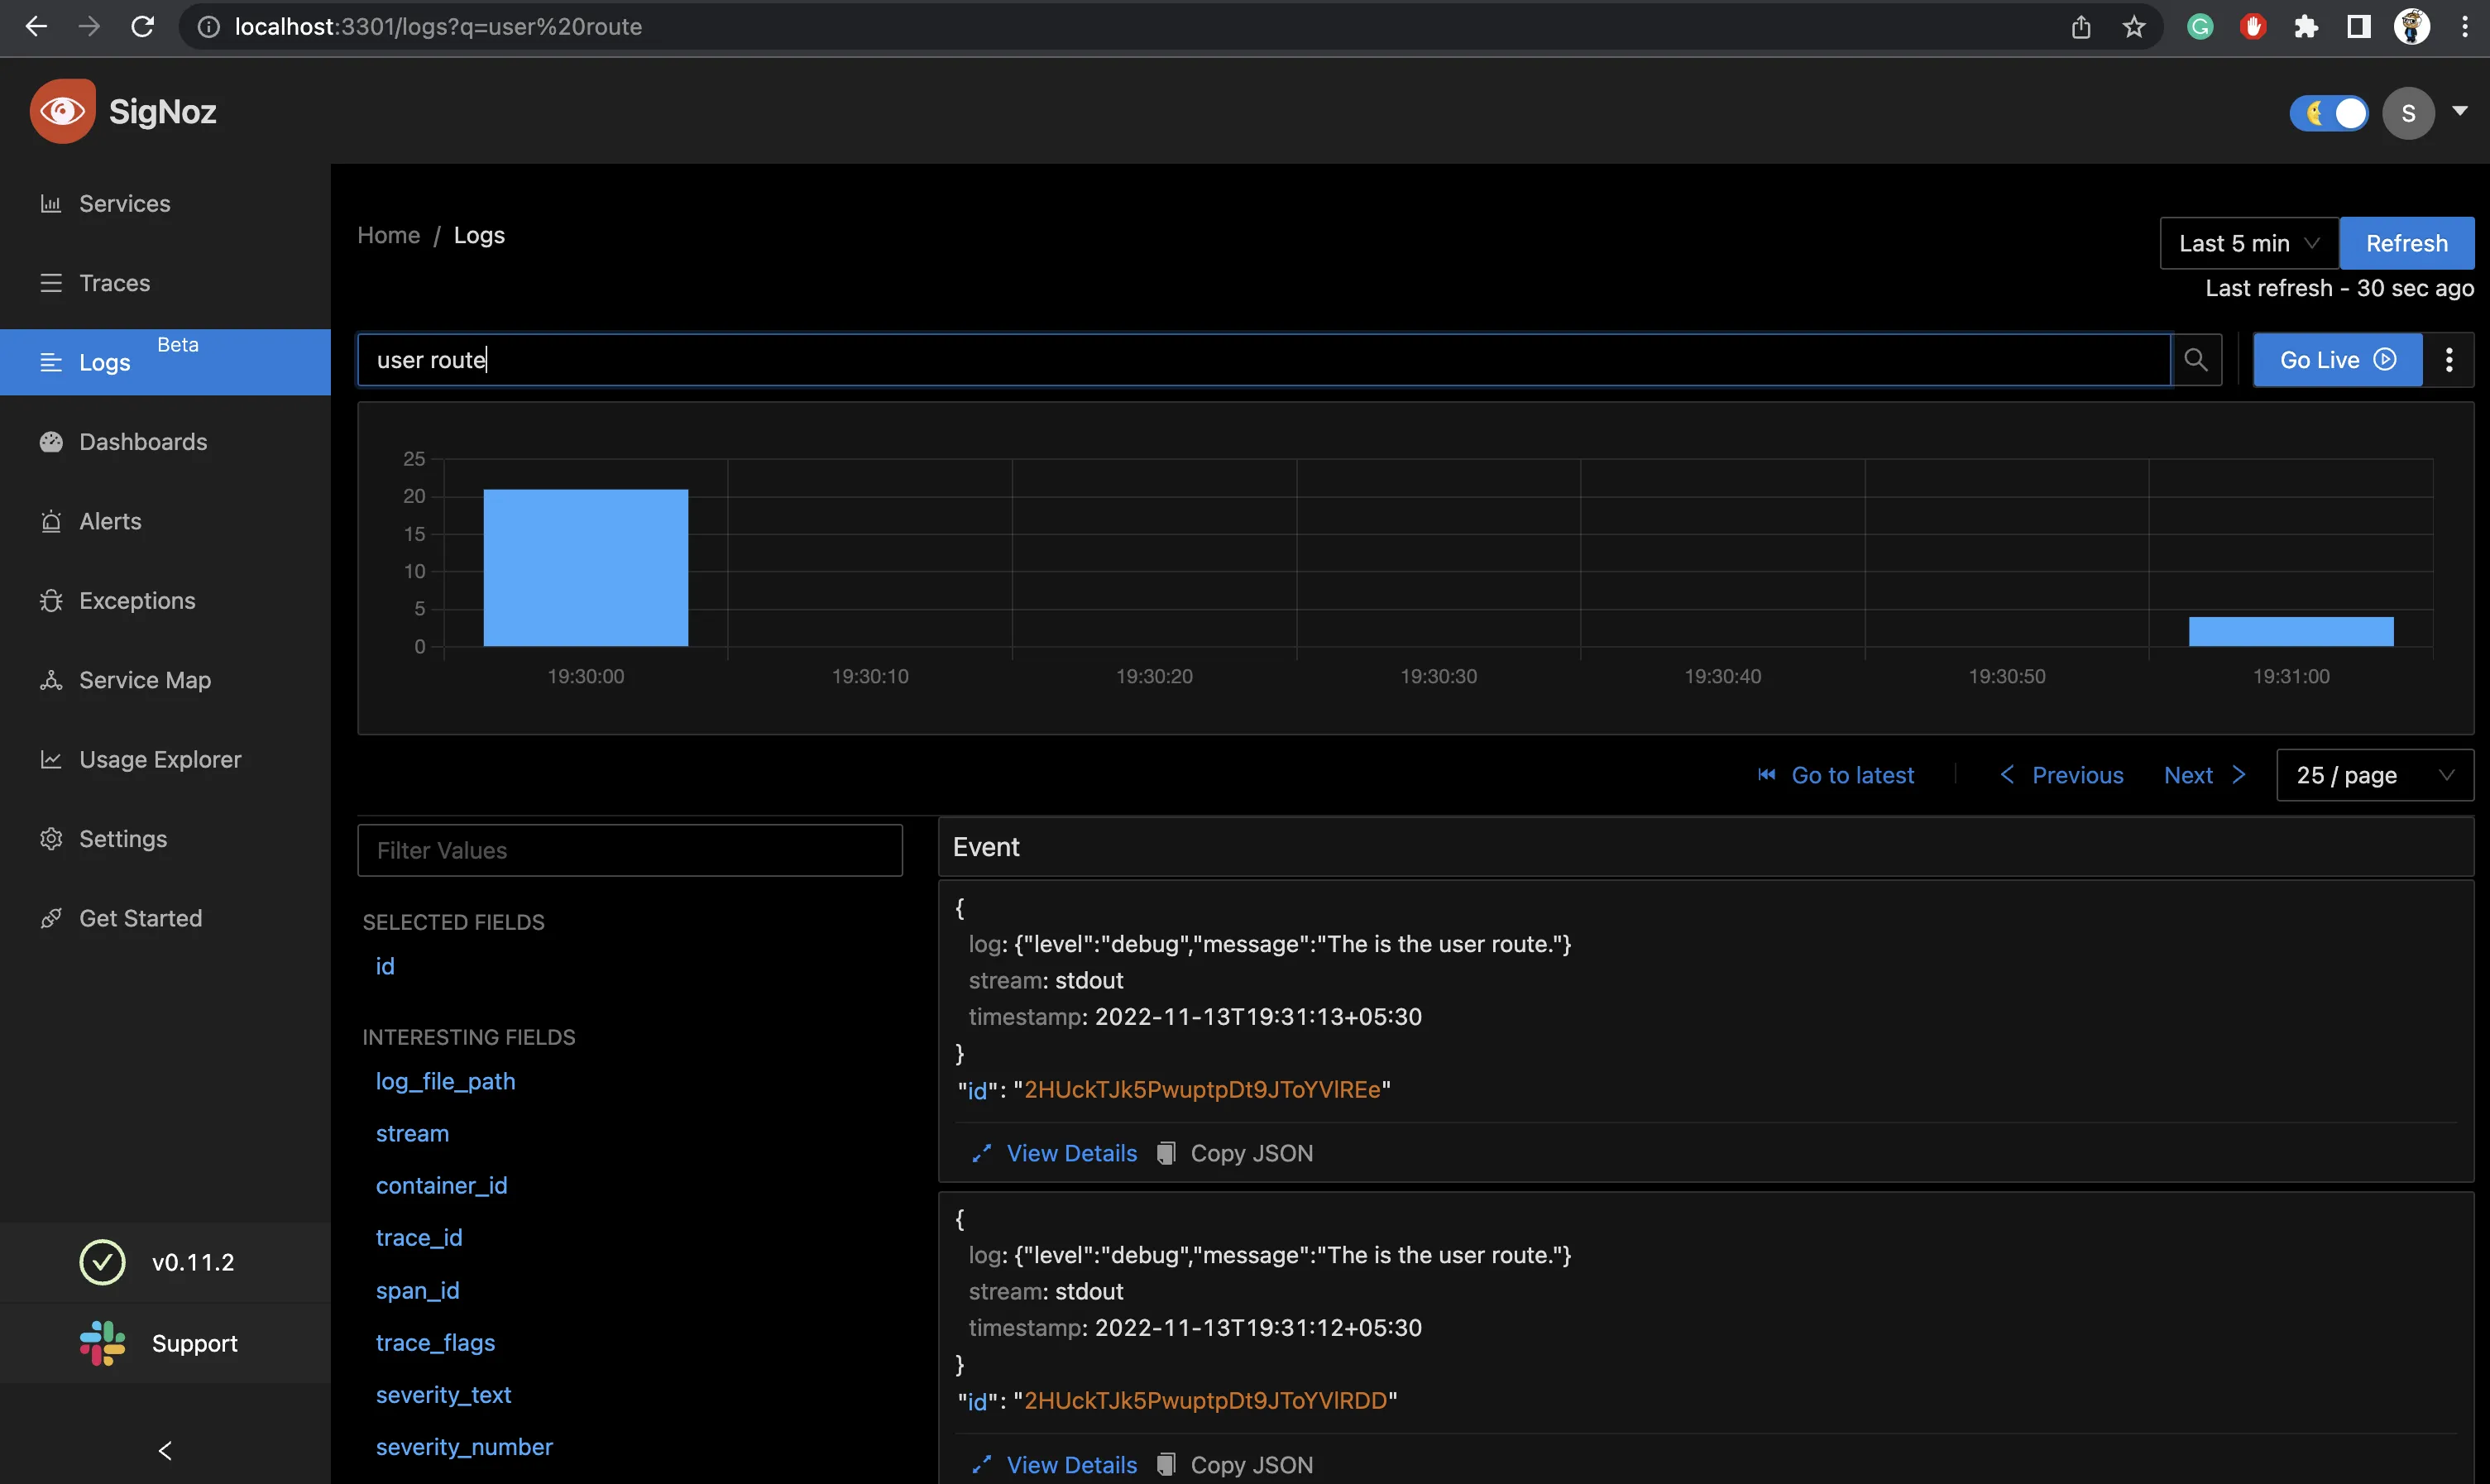
Observing the logs on SigNoz
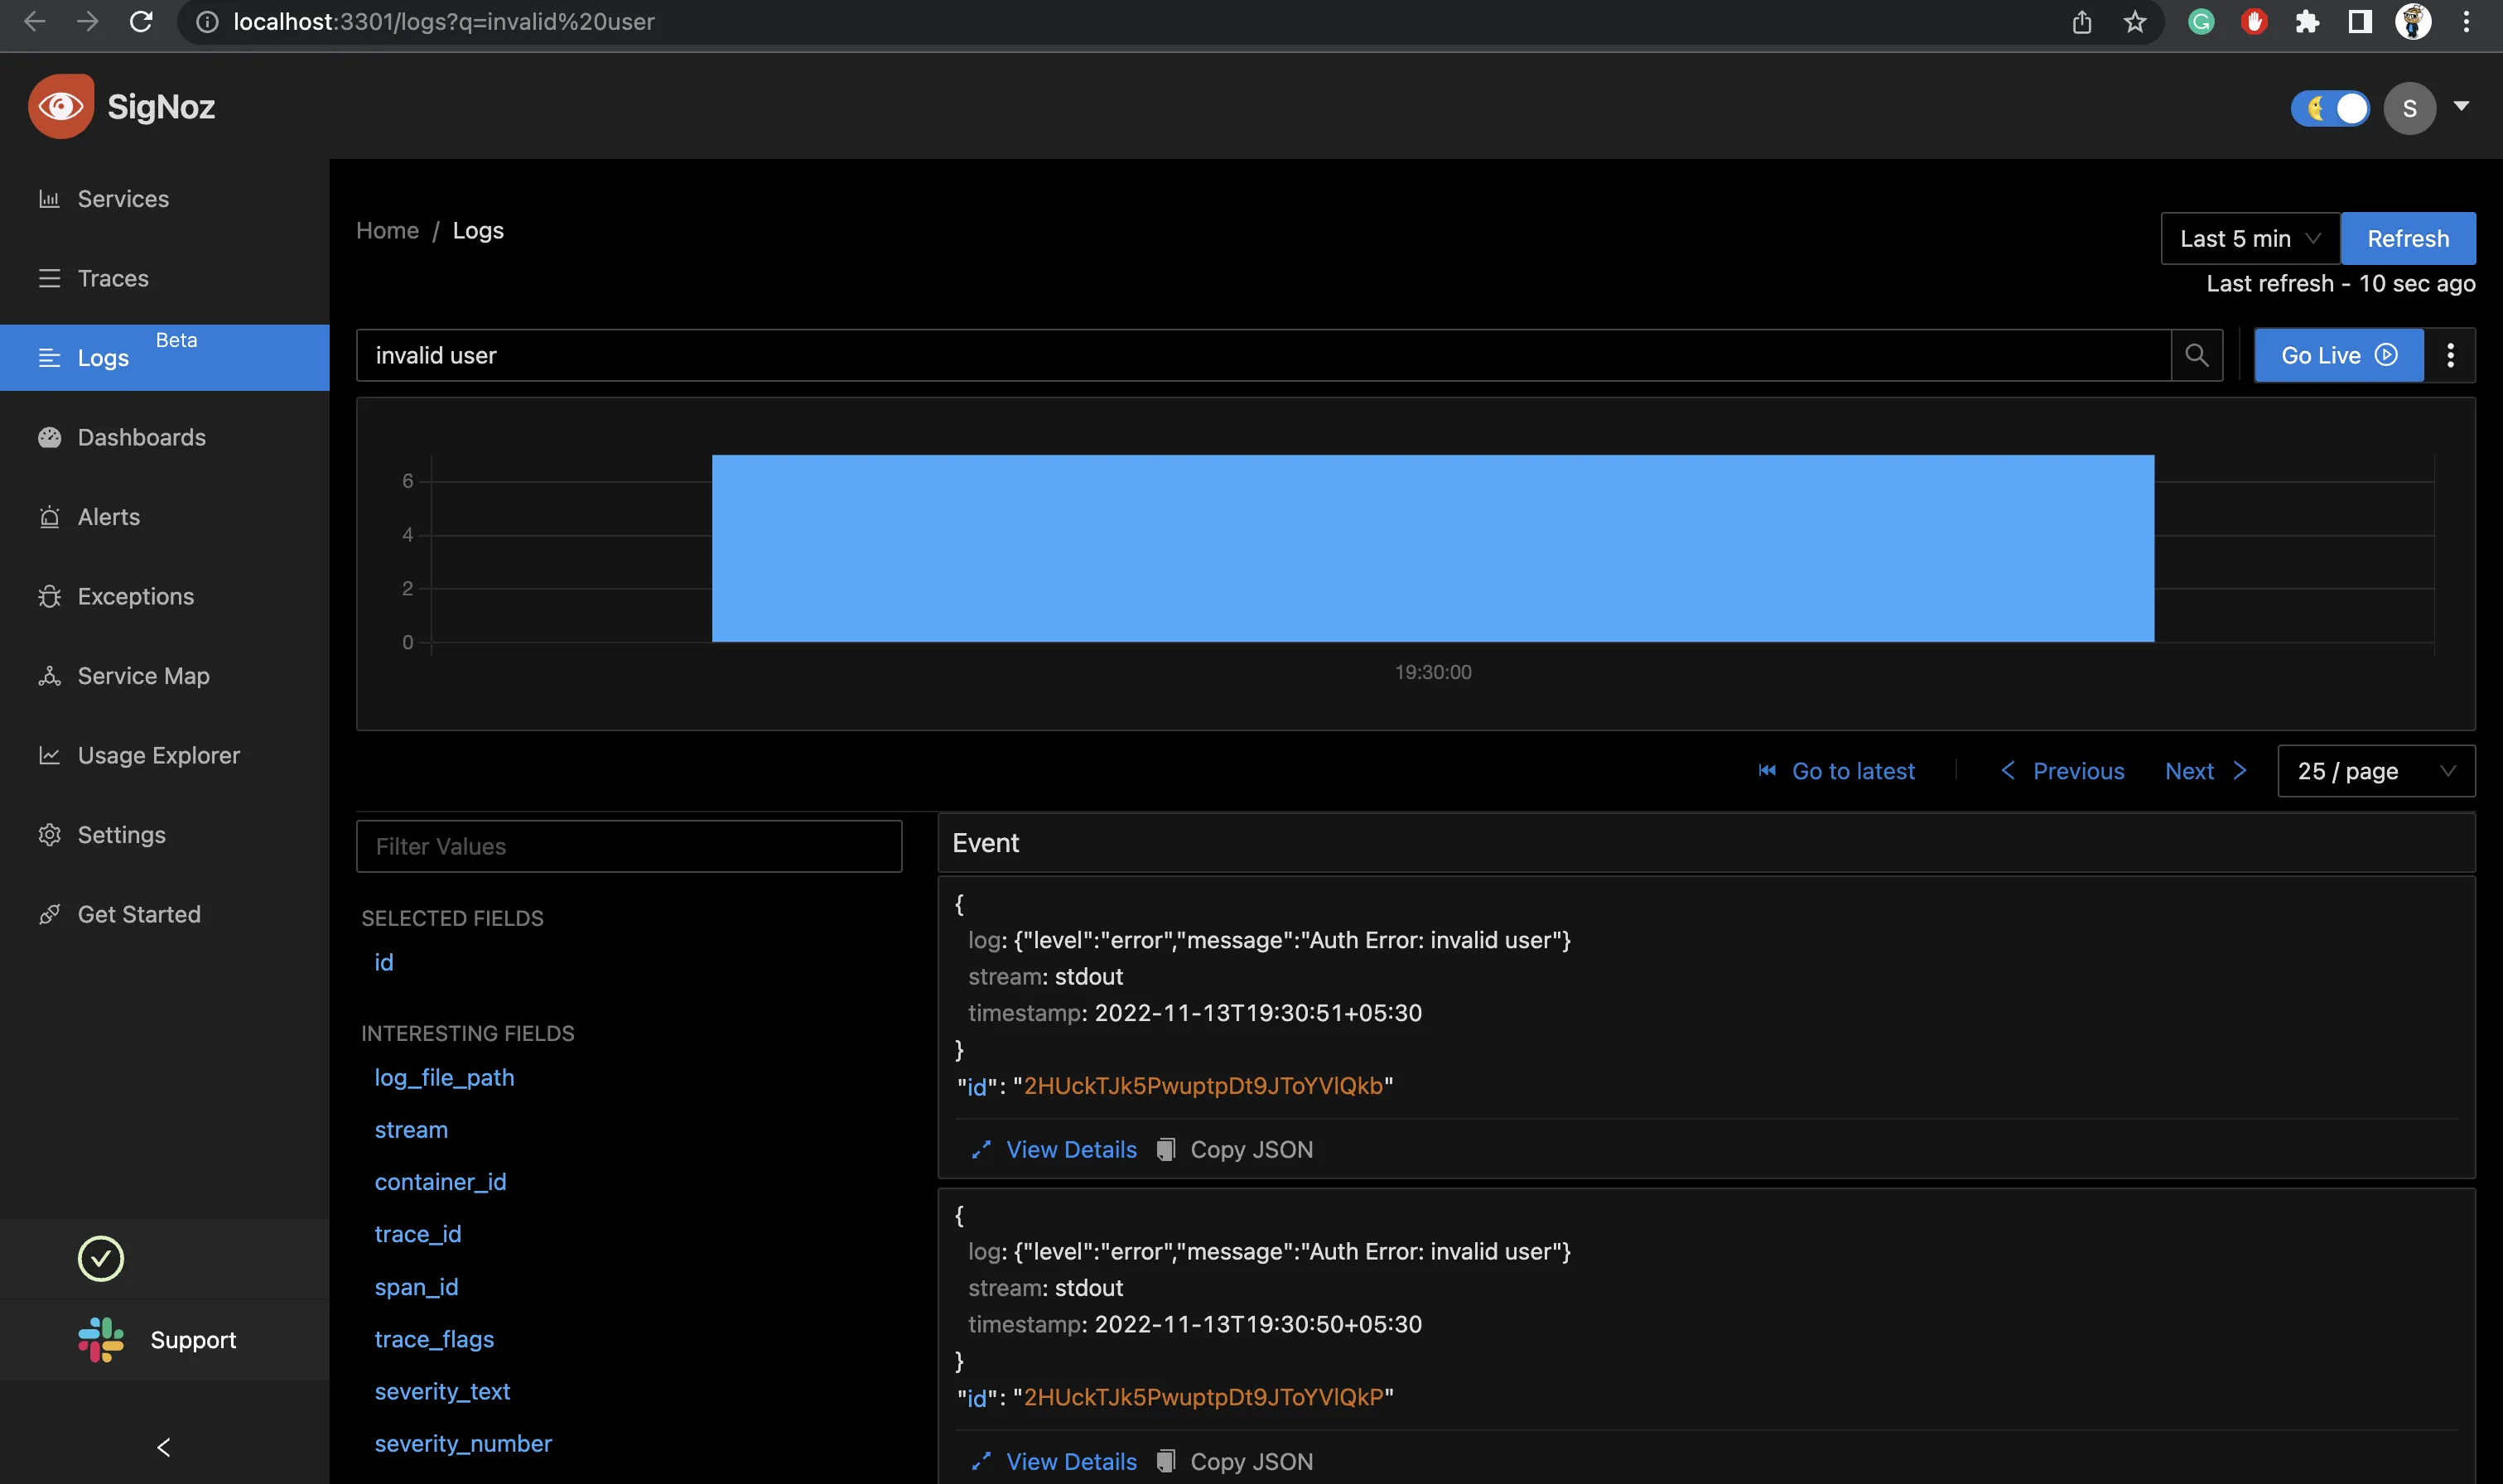
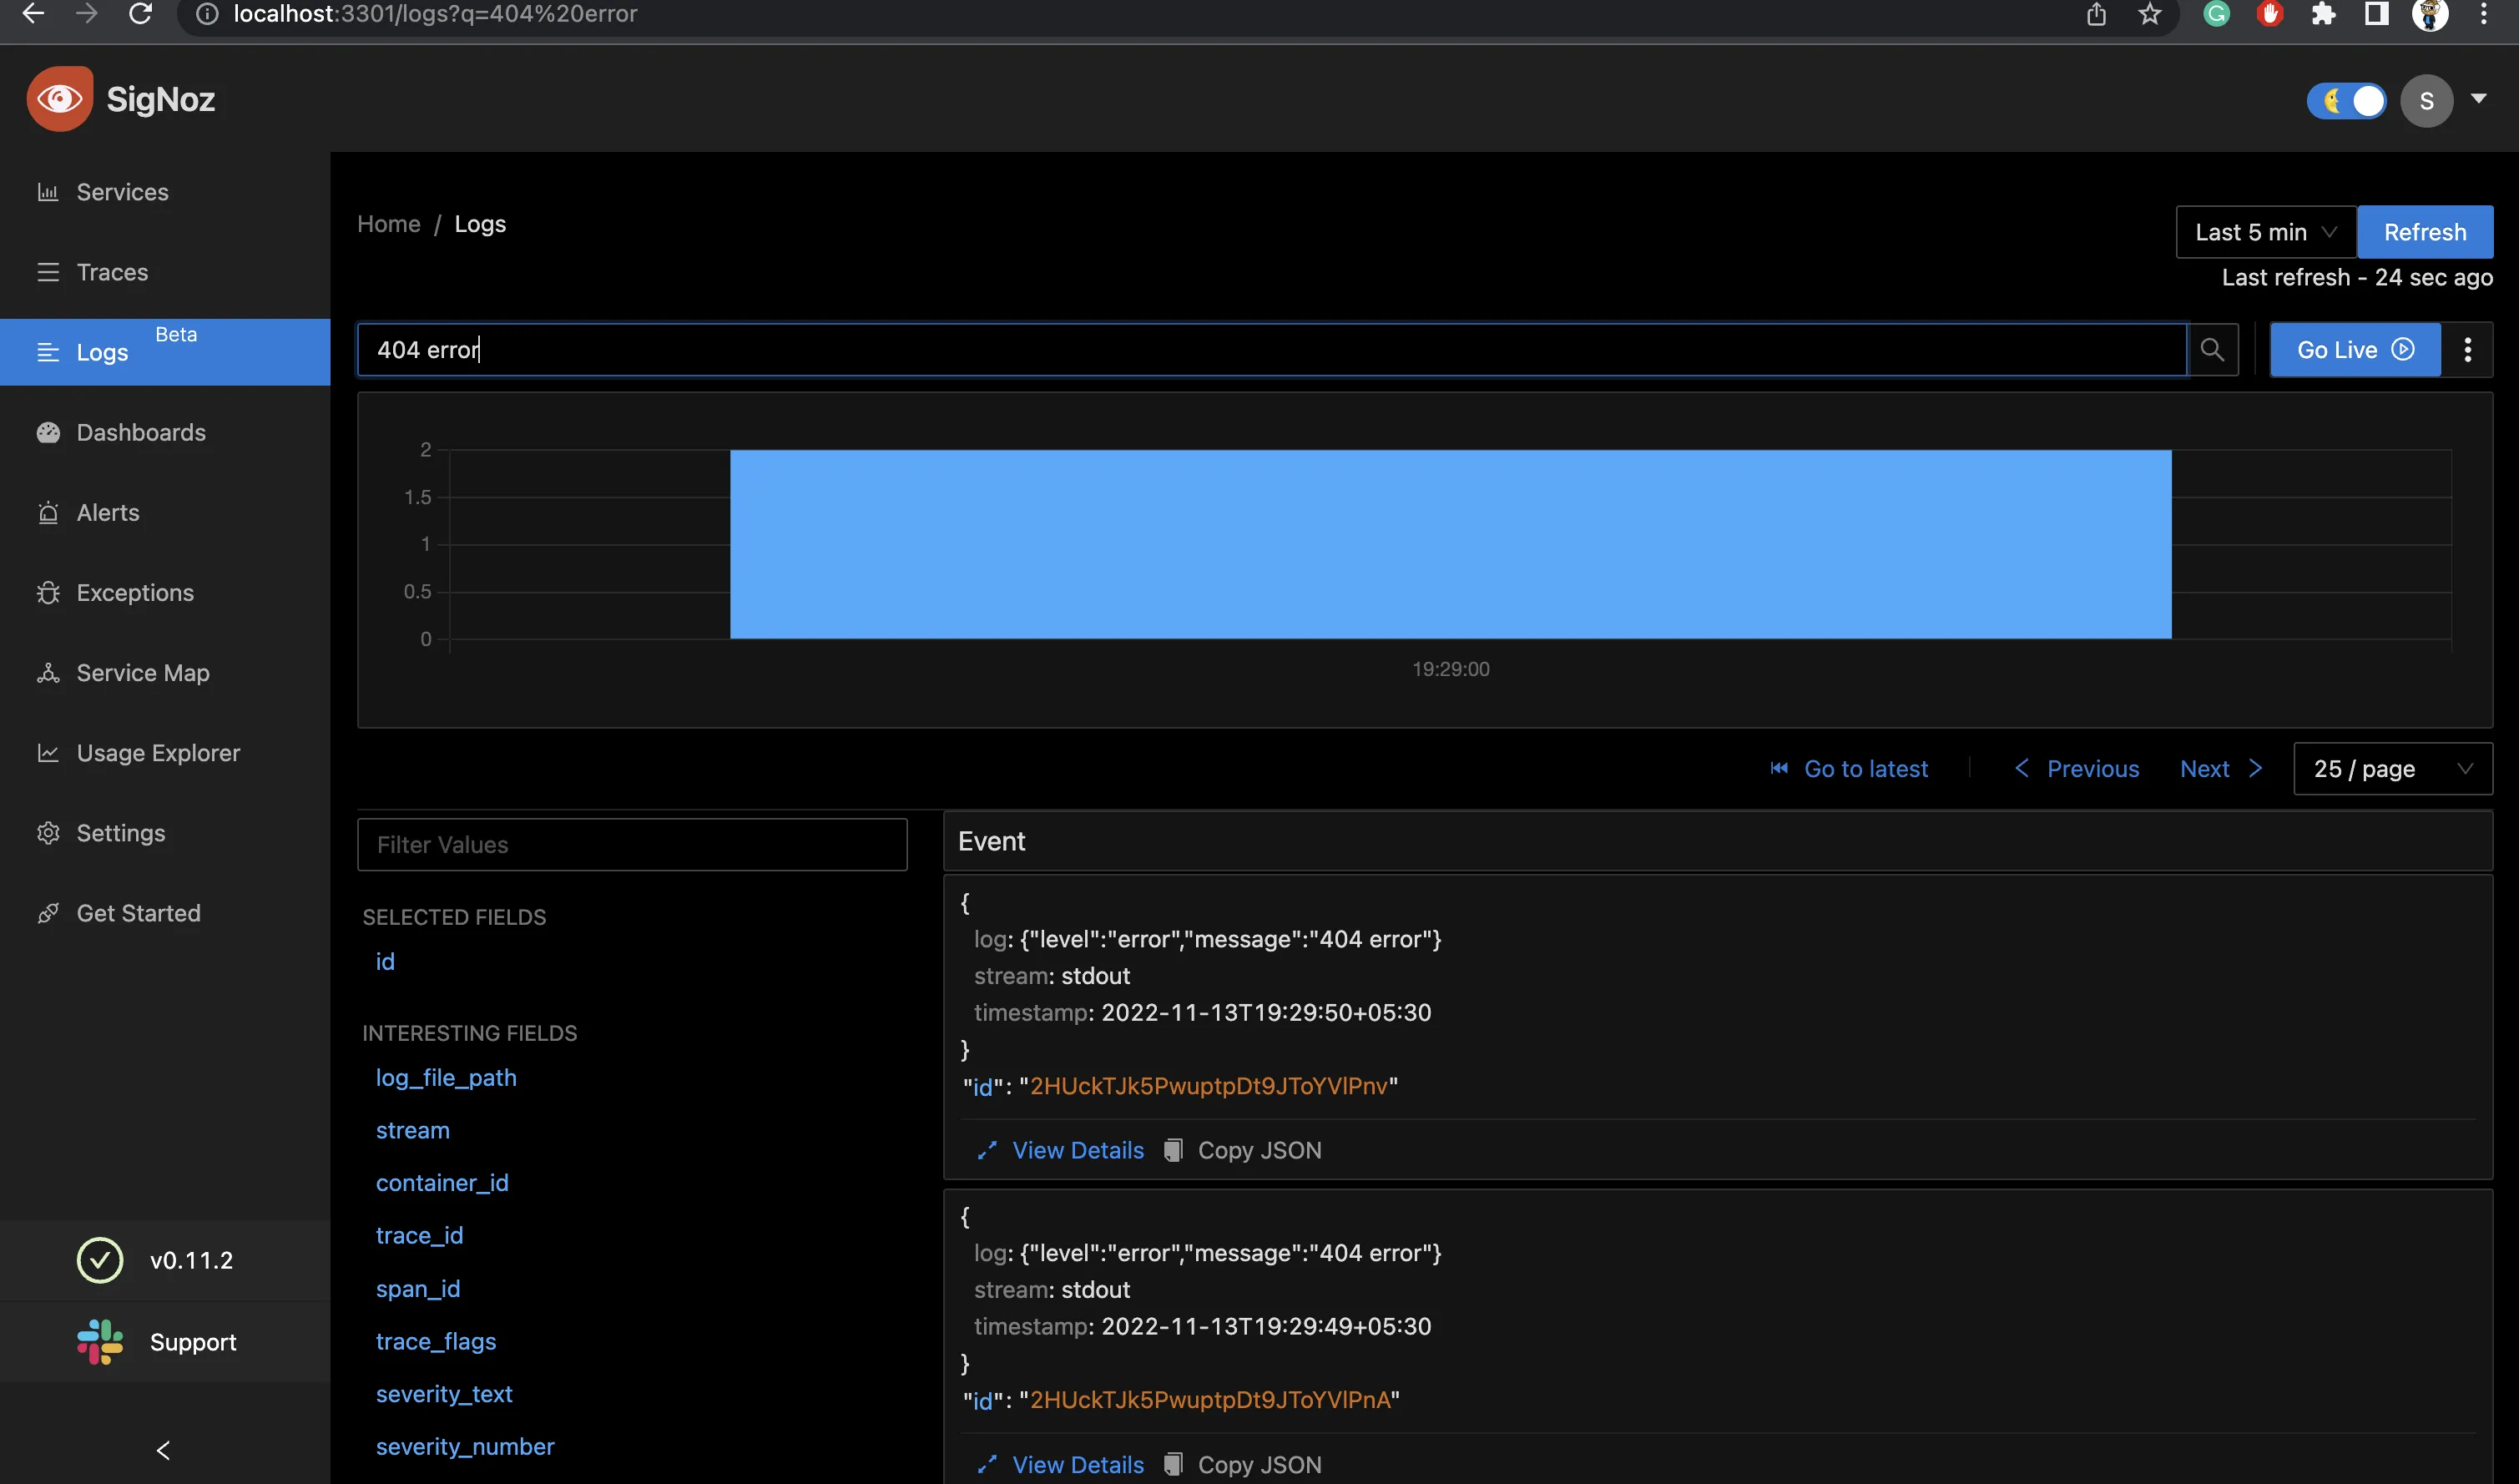
Now, hit the different routes we’ve hit earlier to check the logs i.e /, /404, /user and we should be able to watch the logs in SigNoz as follows.
If SigNoz is installed on a different host, you can collect logs by following these instructions.
Conclusion
Logs play an essential part in a developer’s workflow and are critical to debugging applications. Winston is a simple logging library and makes the logging process more flexible and extensible. Once the logs are generated, you can collect them with SigNoz.
SigNoz uses OpenTelemetry to collect logs. With OpenTelemetry, you can also correlate your logs with other telemetry signals like metrics and traces. Having contextual information in your logs can help you debug applications faster. You can get an overview of logs management in SigNoz from the logs documentation.
Related Posts
SigNoz - a lightweight open source ELK alternative
Morgan Logger - Tutorial on how to use in an Express application

