Datadog vs Splunk - Which Observability Tool Fits Your Needs?
DataDog and Splunk are popular monitoring and observability tools that provide a wide range of products with similar features. In this post, I have compared Datadog and Splunk on important features like APM, log management, search capability, etc.
💡 I instrumented a sample Python application and sent data to Datadog and Splunk to evaluate my experience. Some takeaways are subjective and based on personal preference.
Datadog vs Splunk: Overview
For application monitoring and observability, both Datadog and Splunk offer similar features. The difference lies in the user experience, log management, pricing, and search capability.
Here’s a quick overview of the overall platform features and functionality of Datadog and Splunk.
| Features | Datadog | Splunk |
|---|---|---|
| APM | ✅ Available | ✅ Available |
| Log management | 🟡 Limited | ✅ Available |
| Search capabilities | 🟡 Limited | ✅ Available |
| Real user monitoring | ✅ Available | ✅ Available |
| Network monitoring | ✅ Available | ✅ Available |
| Cloud SIEM | 🟡 Limited | ✅ Available |
| Infrastructure monitoring | ✅ Available | ✅ Available |
| Alert and incident management | ✅ Available | ✅ Available |
| Scalability | ✅ Available | ✅ Available |
| Free Tier | 🟡 Limited | 🟡 Limited |
✅ - Available 🟡 - Limited
APM: Datadog for its advanced APM features
I instrumented a sample Python application and configured it to send data to both Datadog and Splunk for Application Performance Monitoring (APM). The setup process with Datadog was straightforward.
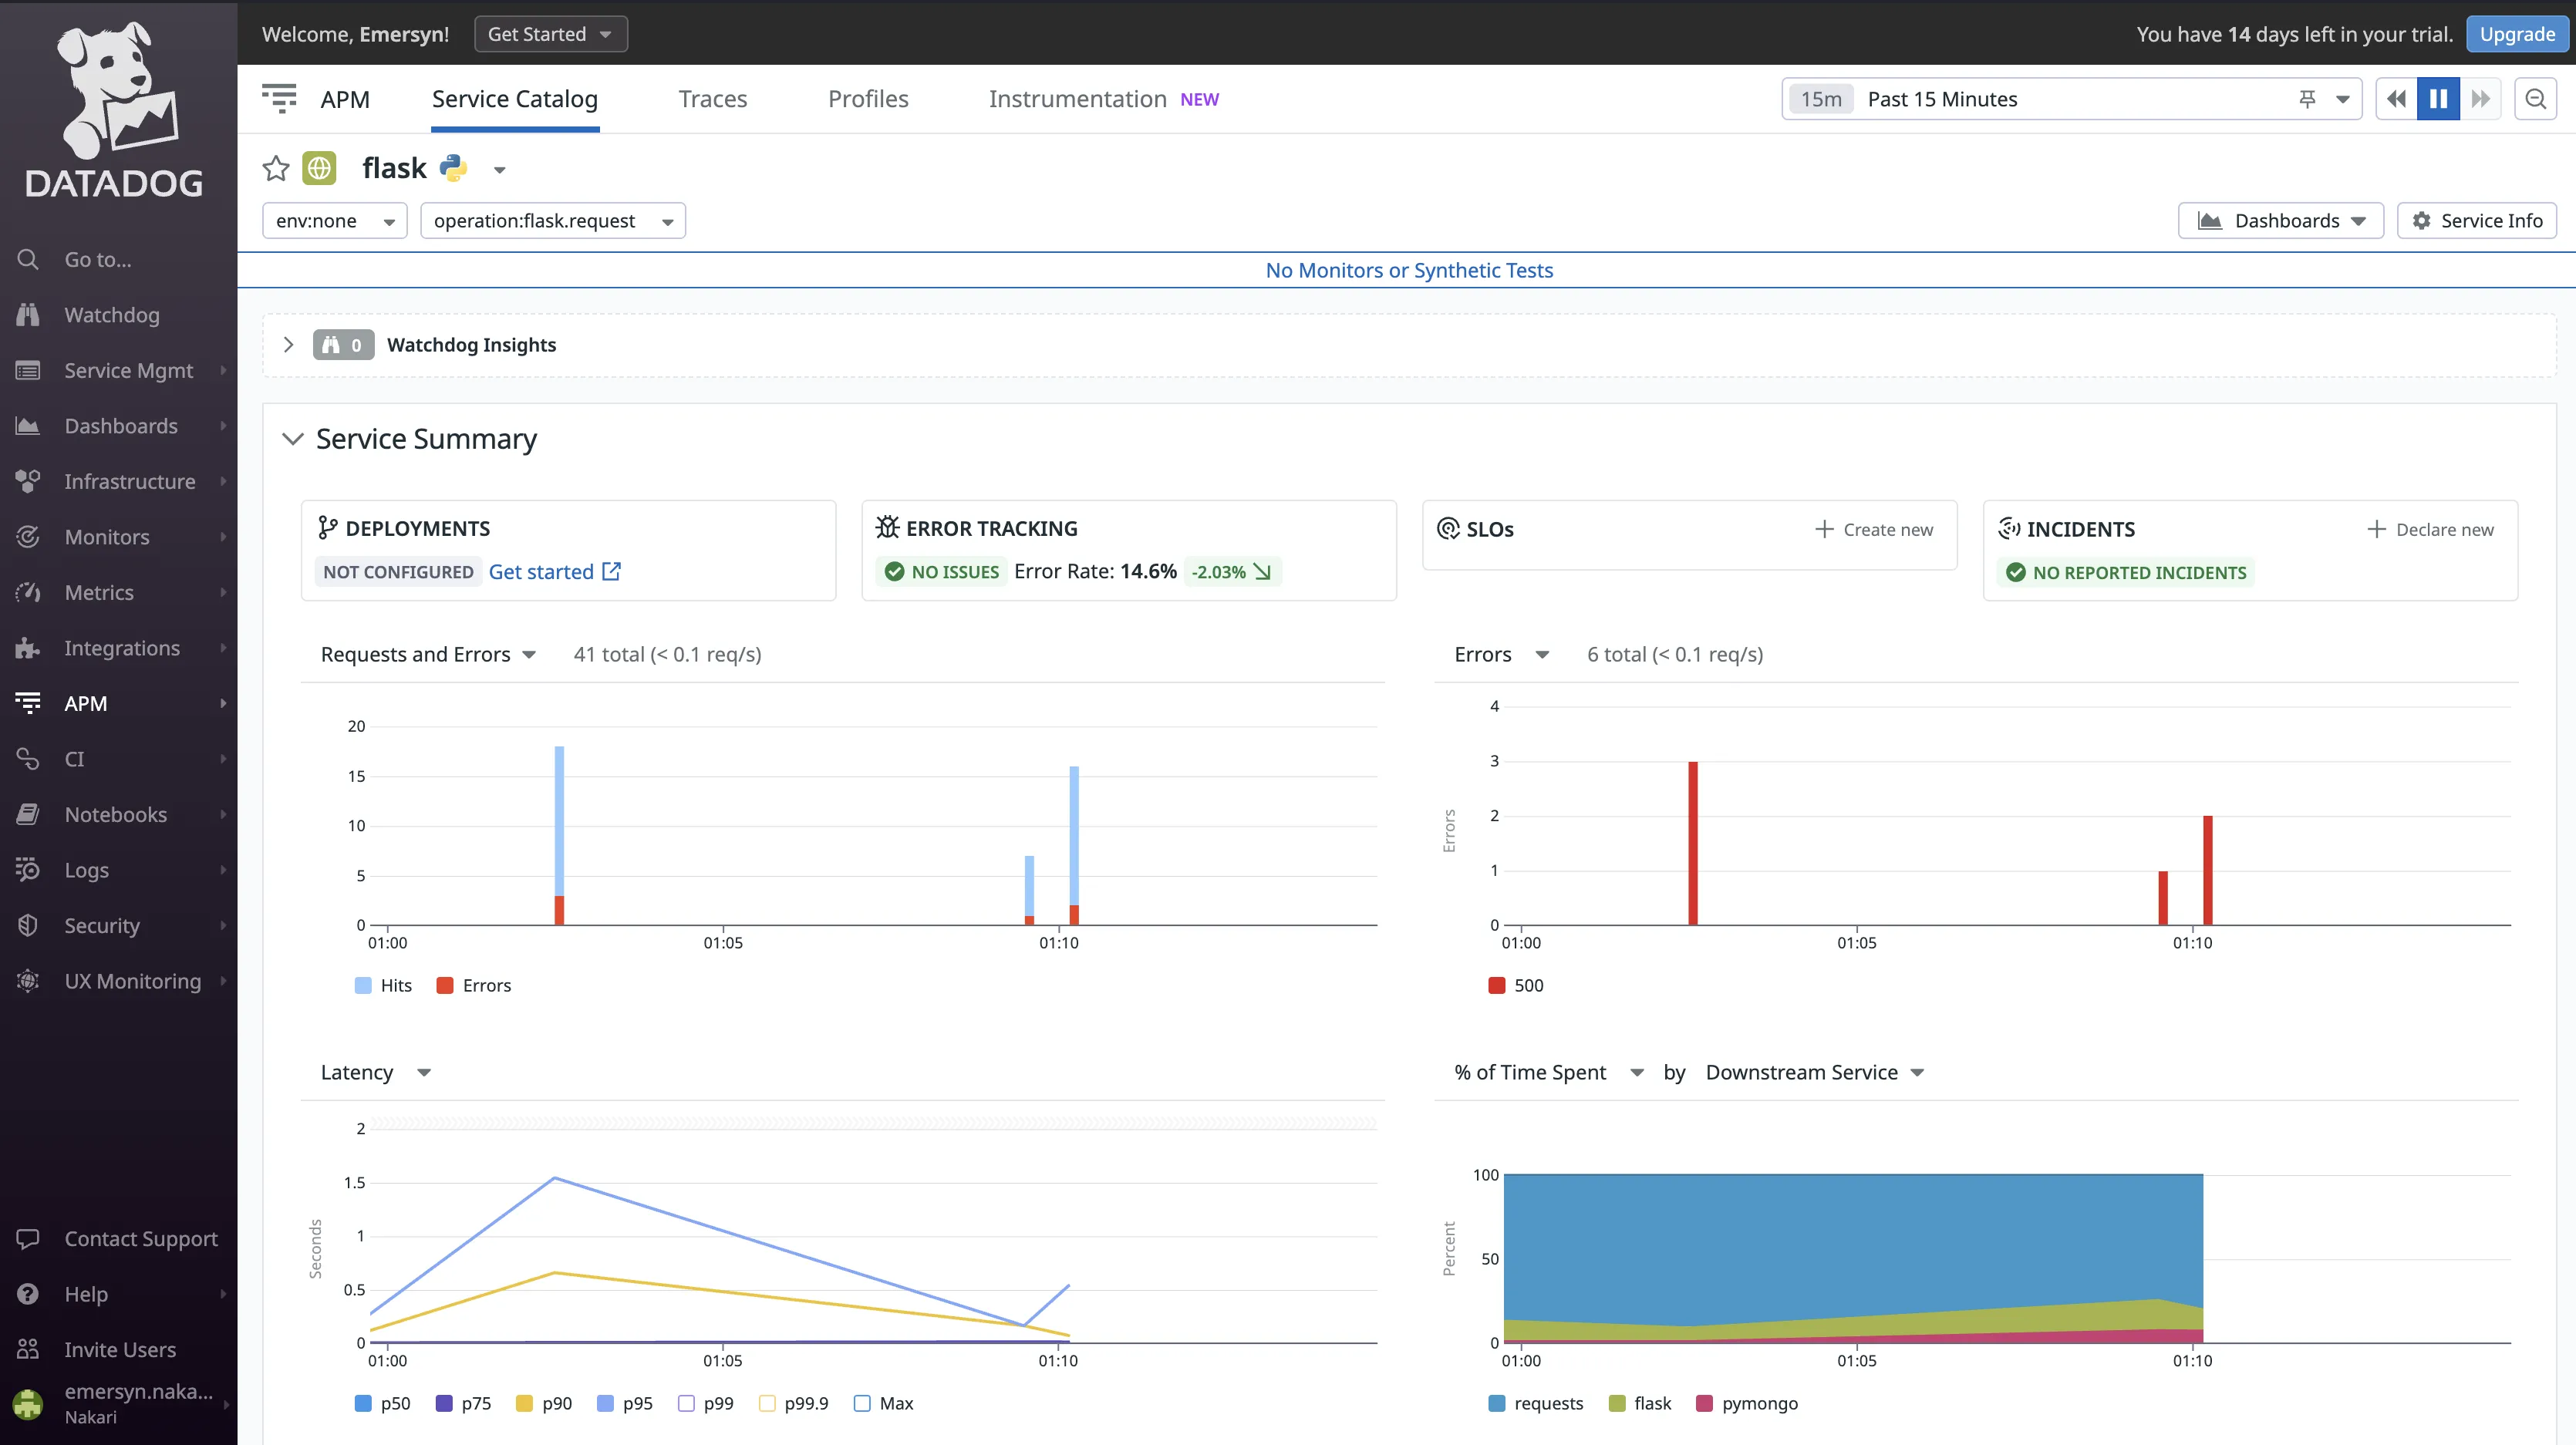
Datadog provided me with an intuitive user interface for visualizing my application data and activity. It allows for the correlation of traces with other telemetry data, allows application performance analysis through tags without the need for a query language, and offers cloud cost visibility. This helped me better understand my application’s performance.
Some other APM features Datadog provides include:
- Code-level tracing for root cause analysis
- Live trace search
- Continuous profiler for performance optimization and cost reduction
- Error tracking for real-time management and resolution of high-volume application errors across APM.
 using flamegraphs in Datadog](https://d3nu8xzr1i9u95.cloudfront.net/web/img/blog/2024/03/datadog-vs-splunk-flamegraphs.webp)
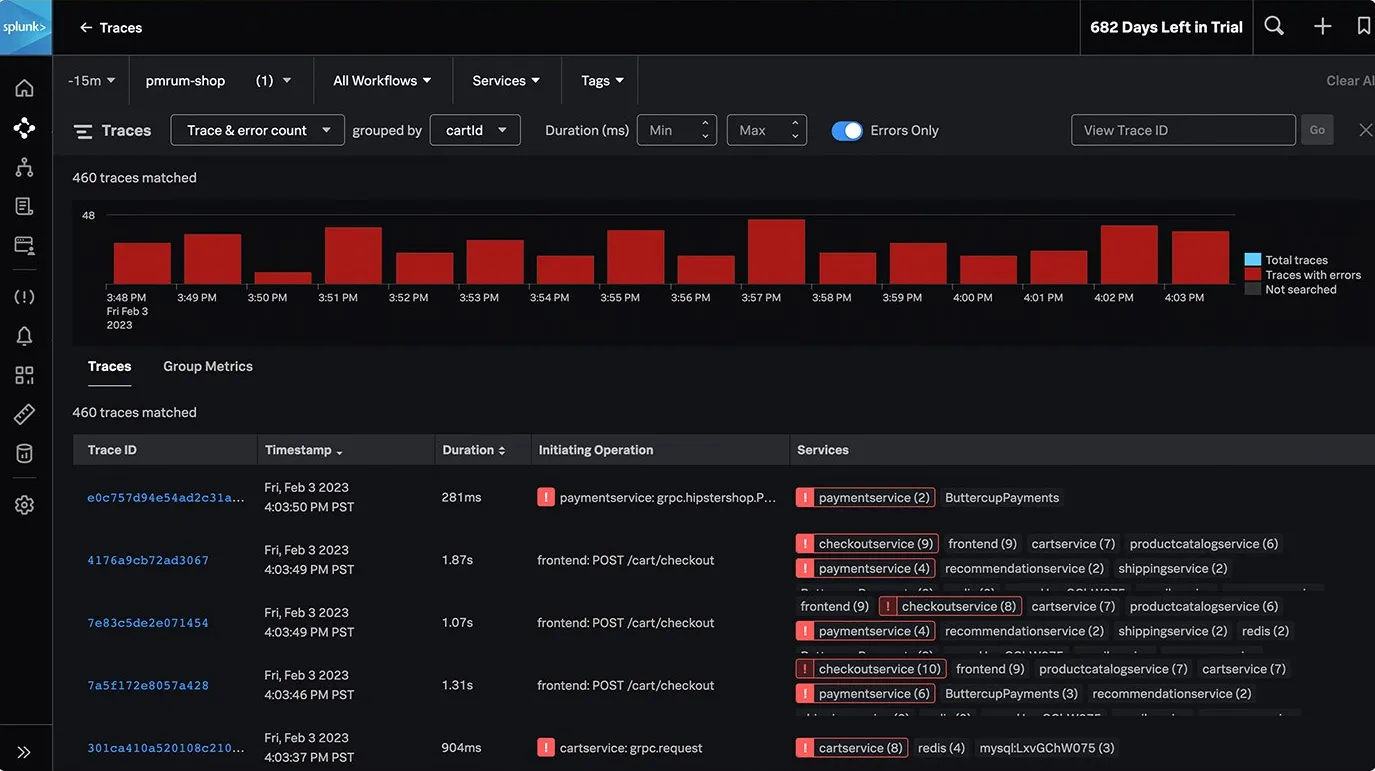
APM setup in Splunk was challenging and I spent most of my time reading documentation to understand the setup, instead of focusing on monitoring my application's performance.
Splunk's APM feature is well-suited for cloud-native enterprises. With Splunk, you can collect all traces rather than just a sample set for complete visibility into application performance. It also supports tag-based grouping of traces for more granular analysis and easier identification of patterns and anomalies. The service maps provided me with information about the relationships and dependencies within my application.
I found the features useful for troubleshooting application failures.
Both tools have good APM capabilities, but Datadog stands out with its robust APM features, ease of use, and comprehensive functionality. You can also keep cost in mind when selecting between both tools.
Log Management: Splunk for enterprise-level log management
Datadog
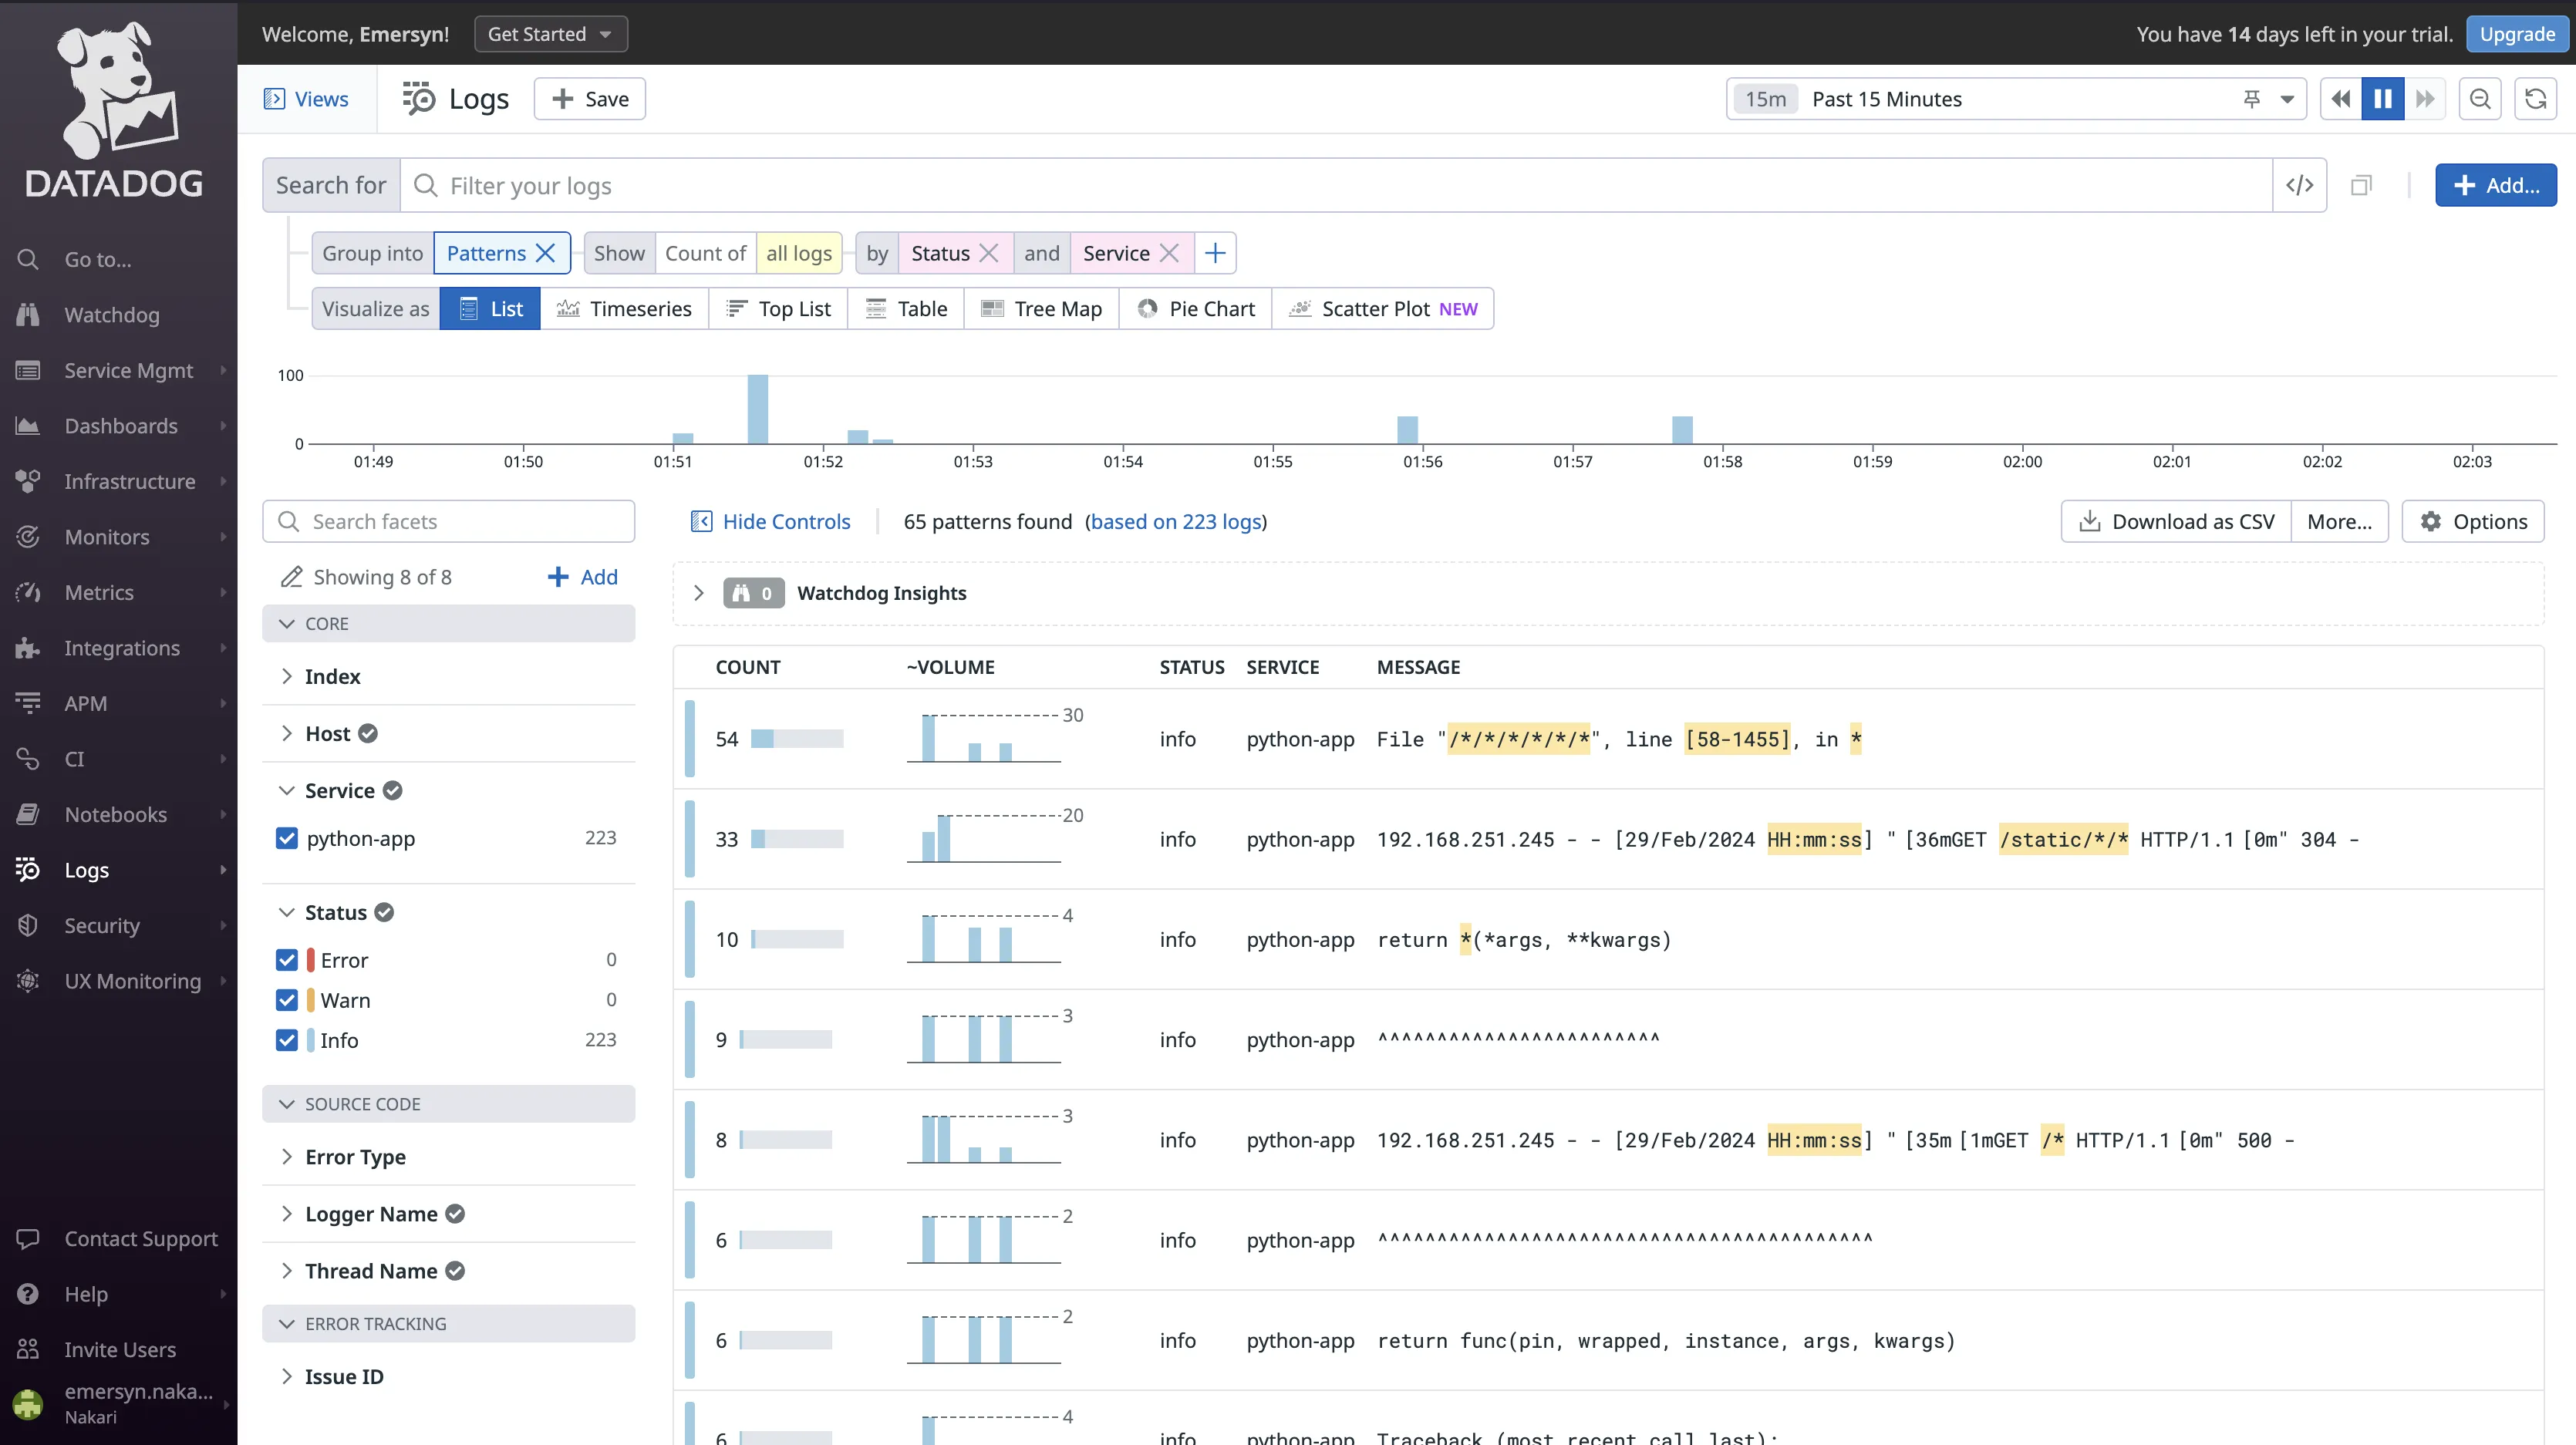
Datadog did not automatically collect logs from my application, this required a manual setup. Datadog’s log management capabilities are good overall. I found the automatic attachment of tags to logs features very useful for simplifying the search and filtering process. It made it easier to locate and analyze specific log entries based on their context. Datadog also allows for live tailing of logs for real-time monitoring and troubleshooting.
Some other features include error tracking across logs and traces, pattern analysis for real-time log grouping, and customizable log collection setups.
Splunk
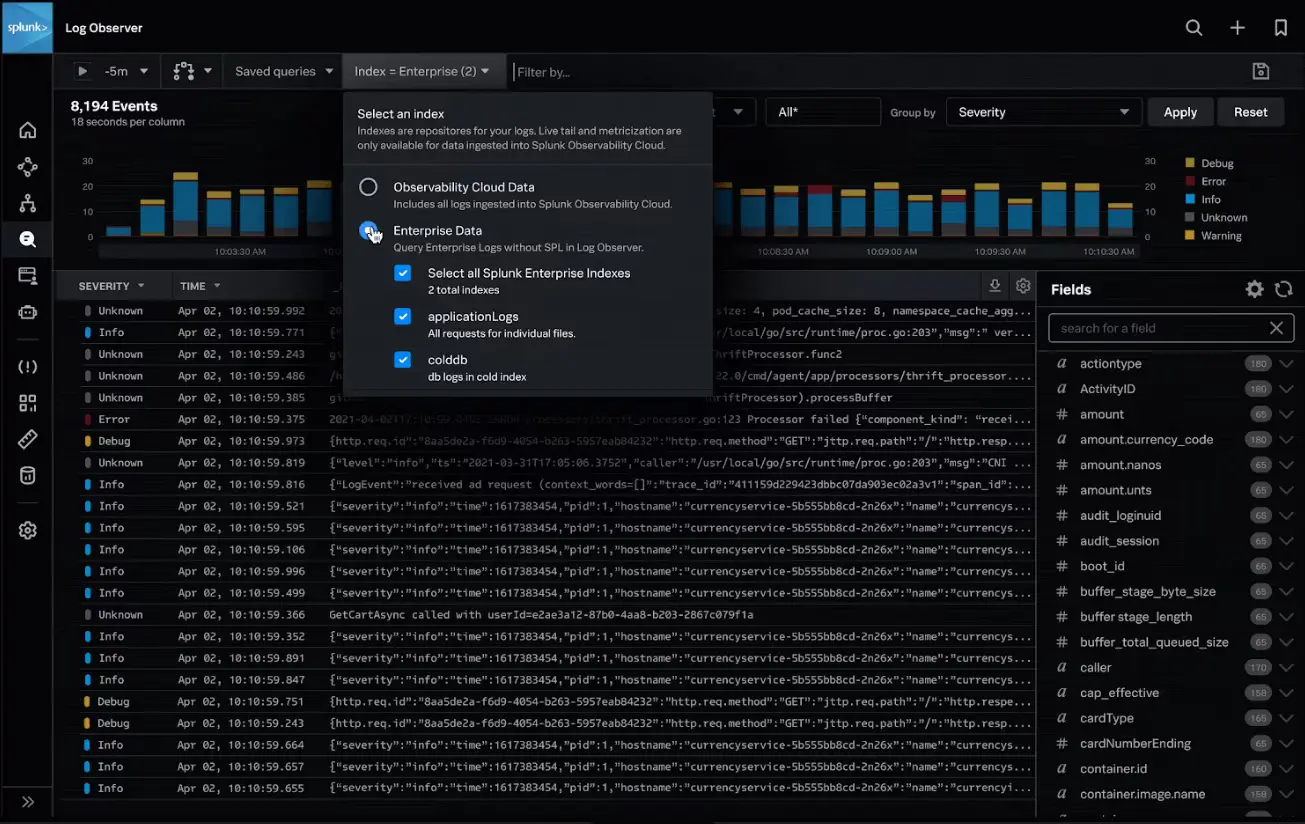
Splunk also did not automatically collect logs from my application. It required the installation and configuration of the Universal Forwarder (UF) to capture logs. Besides that, Splunk generally has impressive log management capabilities. It can integrate ingested data from the different Splunk platforms and data sources into the Splunk Observability Cloud for centralized log management. This is done by the Log Observer Connect feature. It allows for the correlation of logs with real-time metrics and traces, and log-based analysis through advanced search, filtering, and visualization of datasets.
For businesses dealing with large datasets and extensive log volumes, Splunk is a better option. You can consider Datadog if you have less log management and analytical needs.
Search Capability: Splunk for Large-Scale Data Search.
Datadog
Datadog allows users to efficiently explore and analyze their logs. It supports a wide range of search types, including attribute searches, numerical value searches, wildcard searches, and more. It also provides a rich set of features to help users build and refine their queries, including autocomplete, syntax highlighting, and the ability to save and reuse searches.
Splunk
Splunk is widely known for its powerful search capability, with a search engine designed to handle and analyze large volumes of data efficiently. It allows users to explore, analyze, and get insights from massive datasets collected from various sources in real time.
Searching in Splunk is done using the Splunk Processing Language (SPL), which is a rich, expressive language for searching, filtering, and aggregating data. SPL allows users to perform a wide range of operations, including filtering events based on specific criteria, aggregating data for analysis, and combining data from multiple sources.
If your use case is searching through a large data volume, Splunk is an excellent choice.
Infrastructure Monitoring: Decide based on cost
Datadog
Infrastructure monitoring in both tools is good. Datadog provided me with insights into my infrastructure performance and network efficiency. It allows users to view tags, configuration details, asset relationships, misconfigurations, and threats. One feature I find interesting is its ability to provide information on teams responsible for each resource and any reported security misconfigurations. This helps for better organization and management.
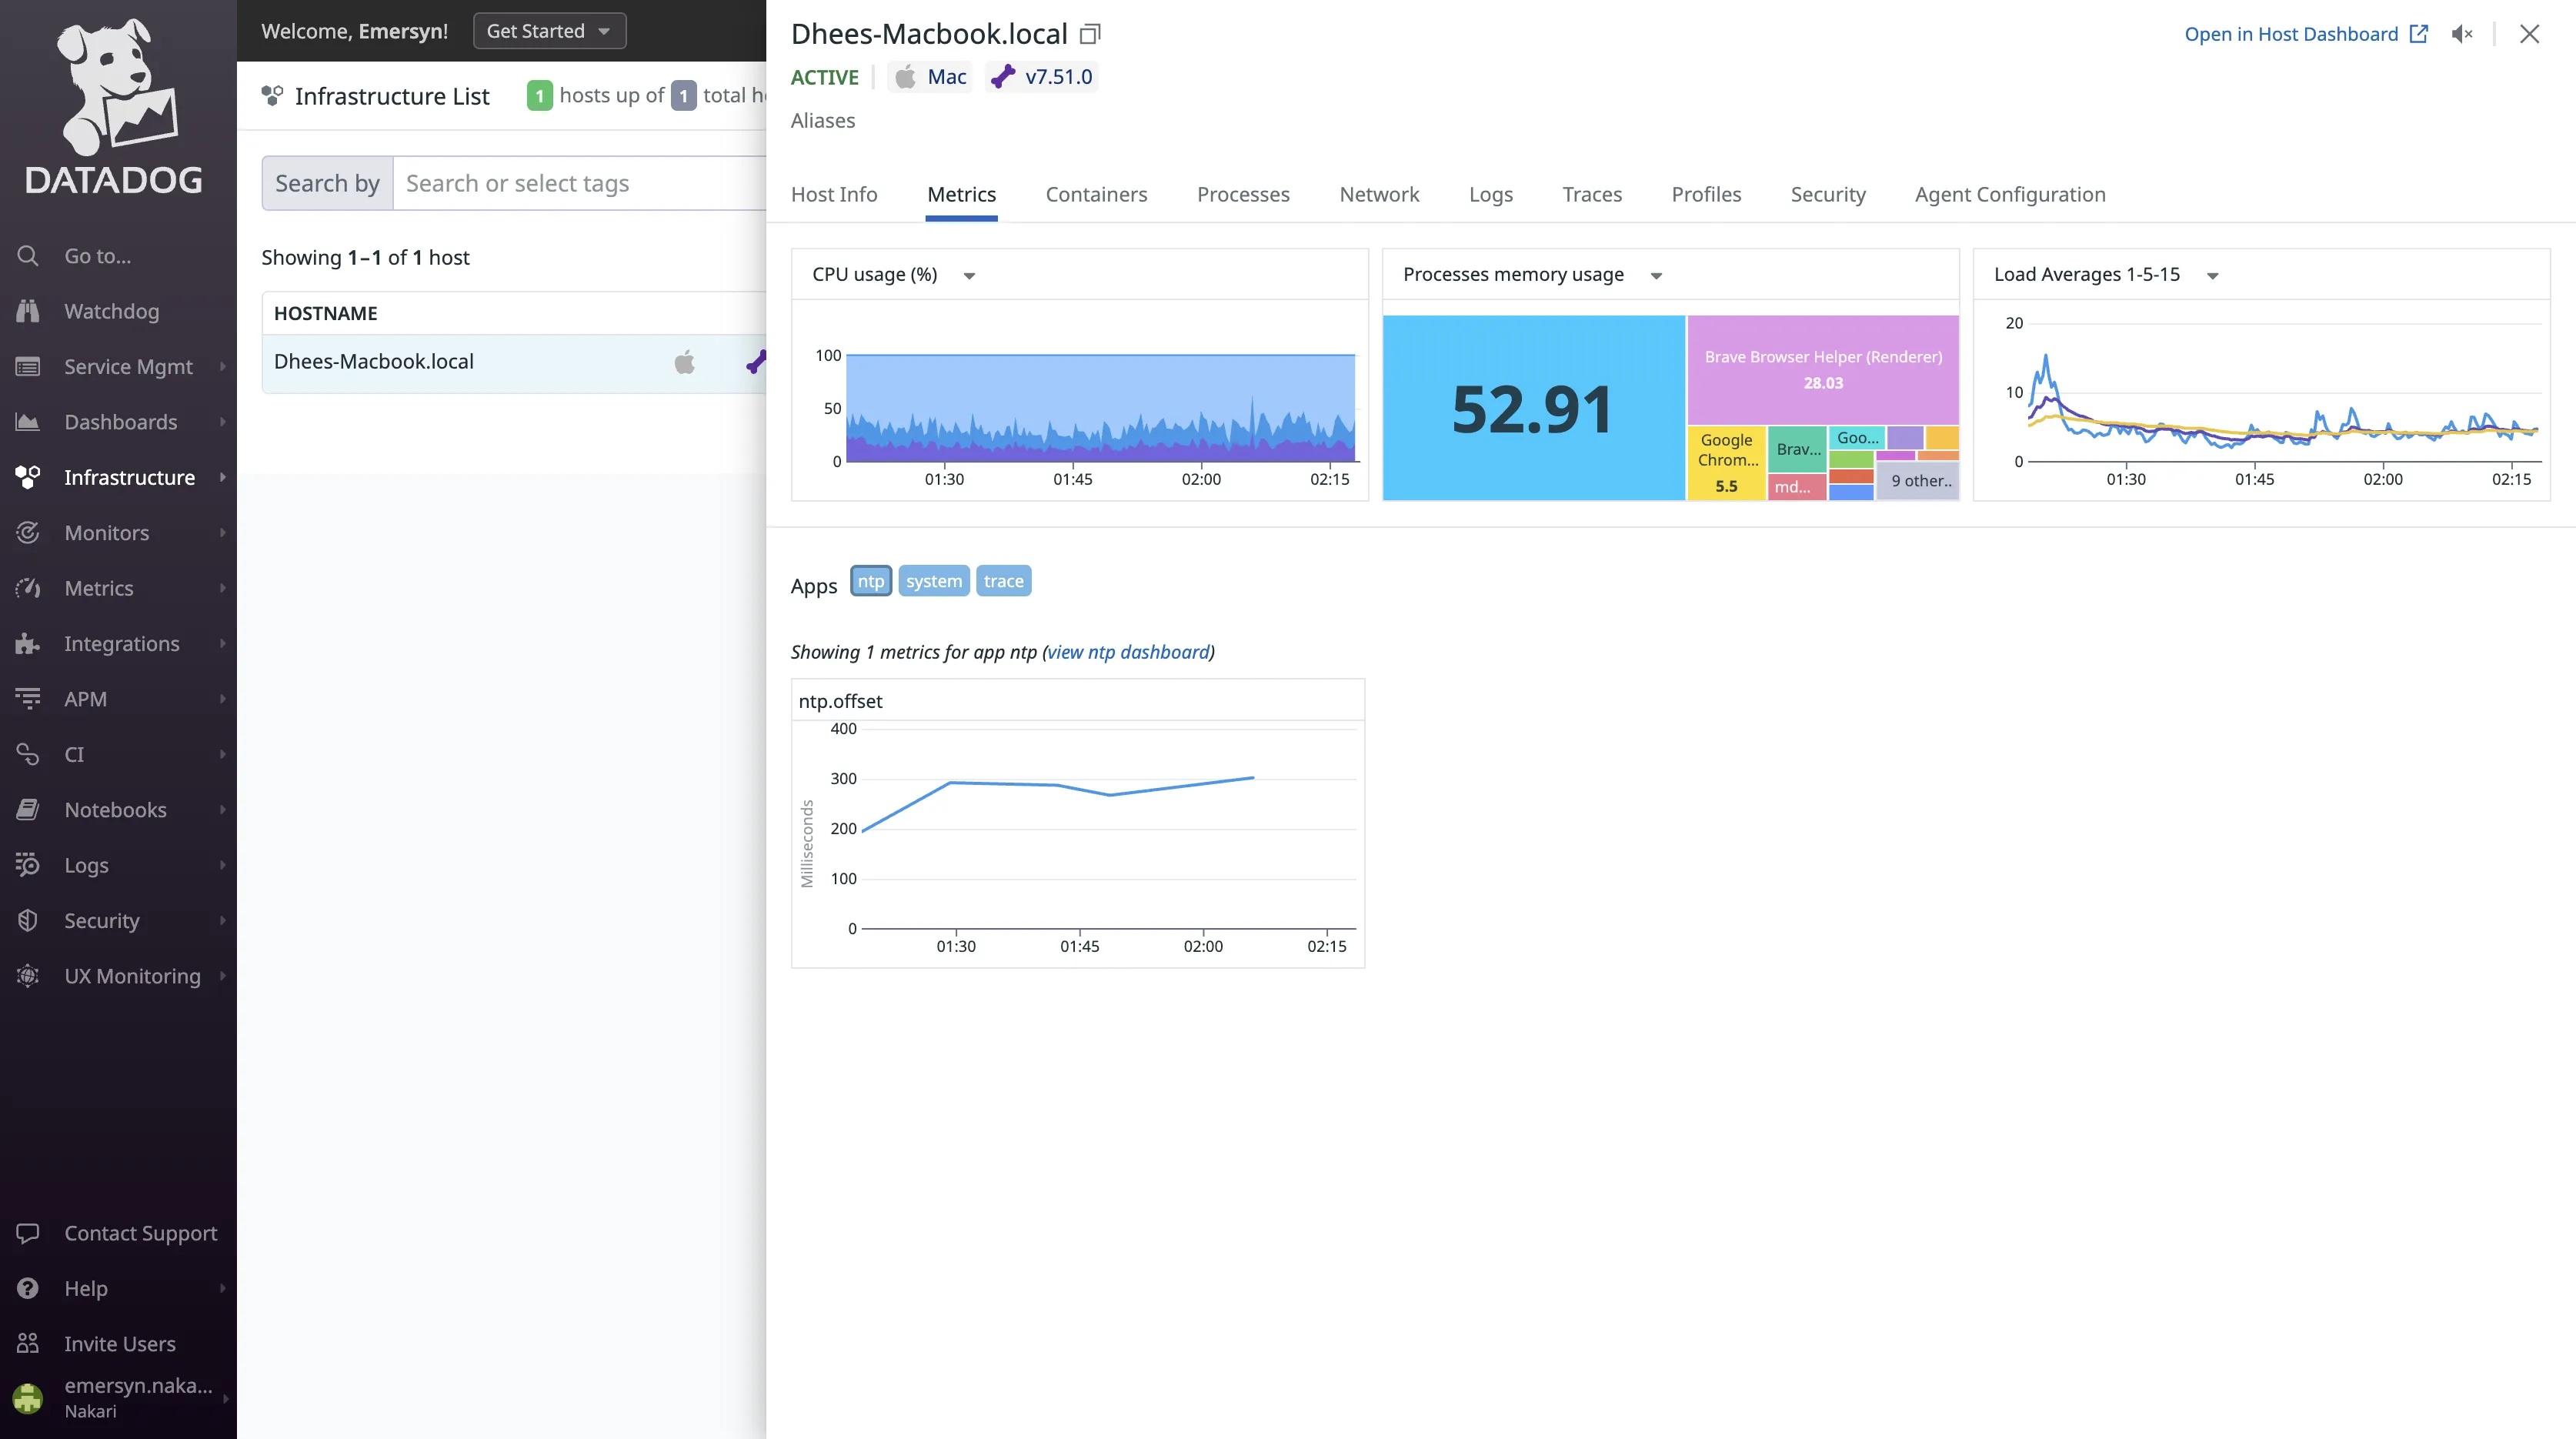
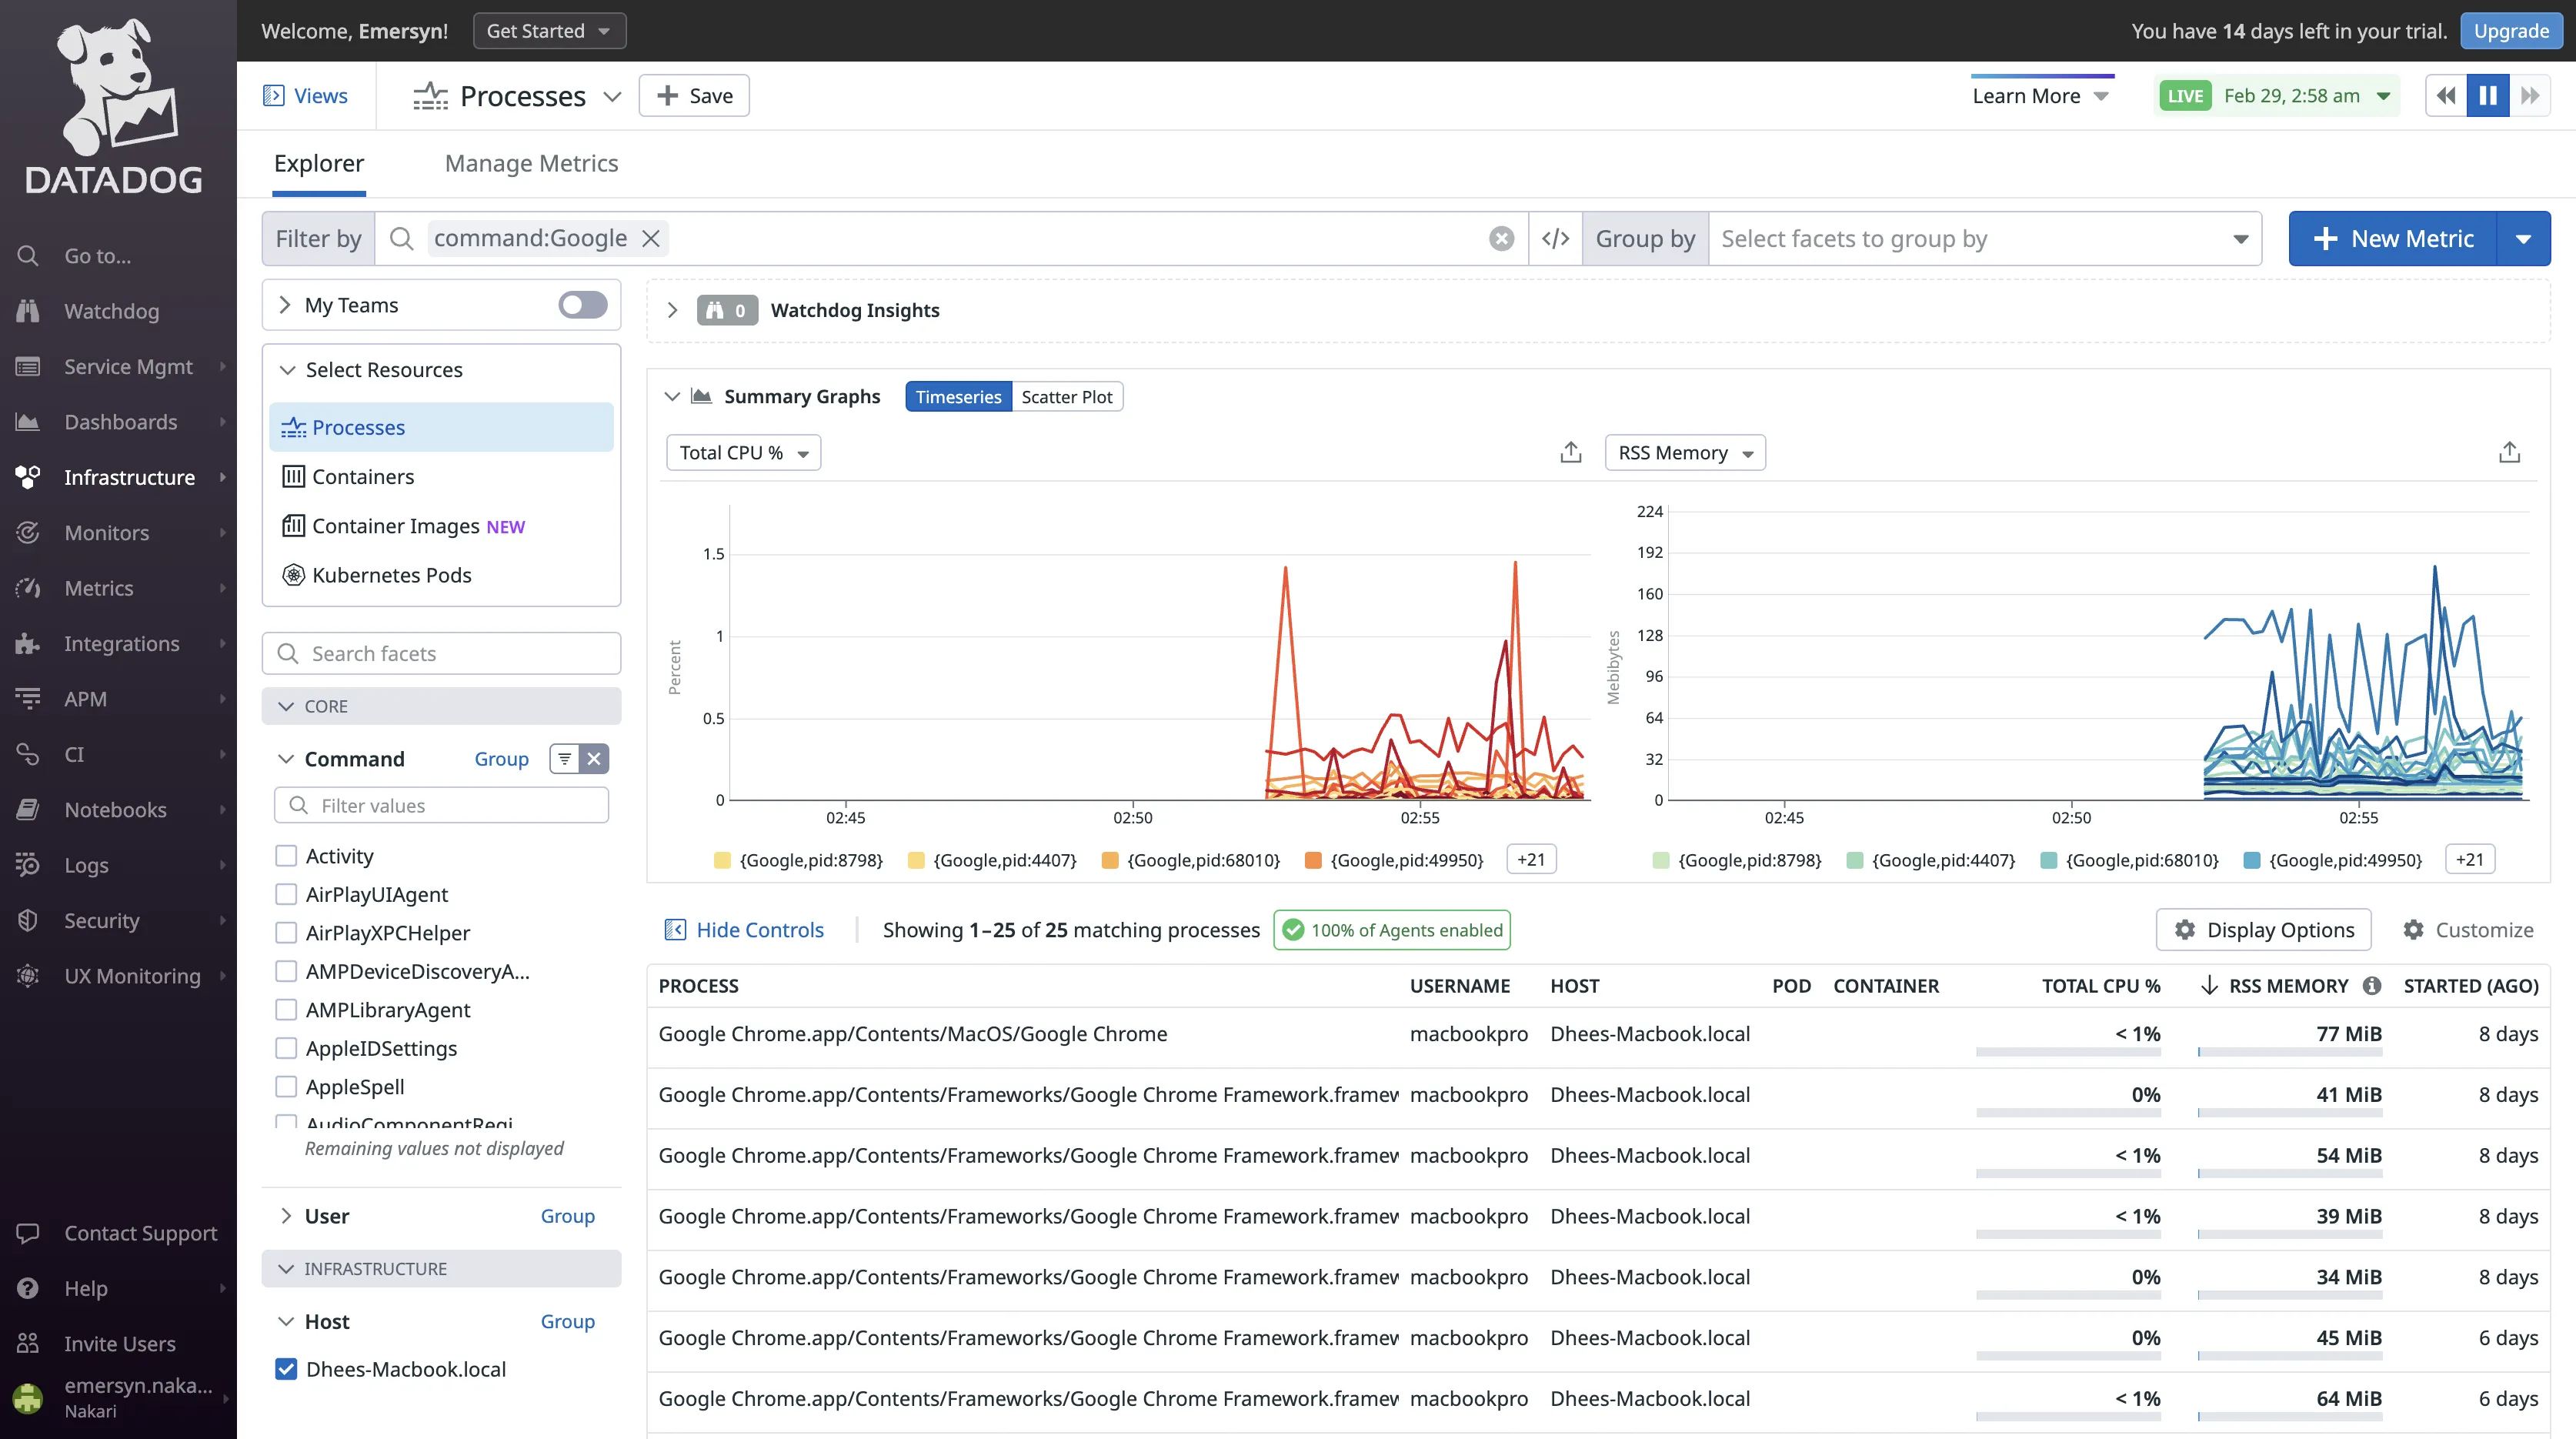
With Datadog, I was able to see some of my application metrics using the Processes feature. This feature displays all the processes running on your infrastructure in real-time.
Splunk
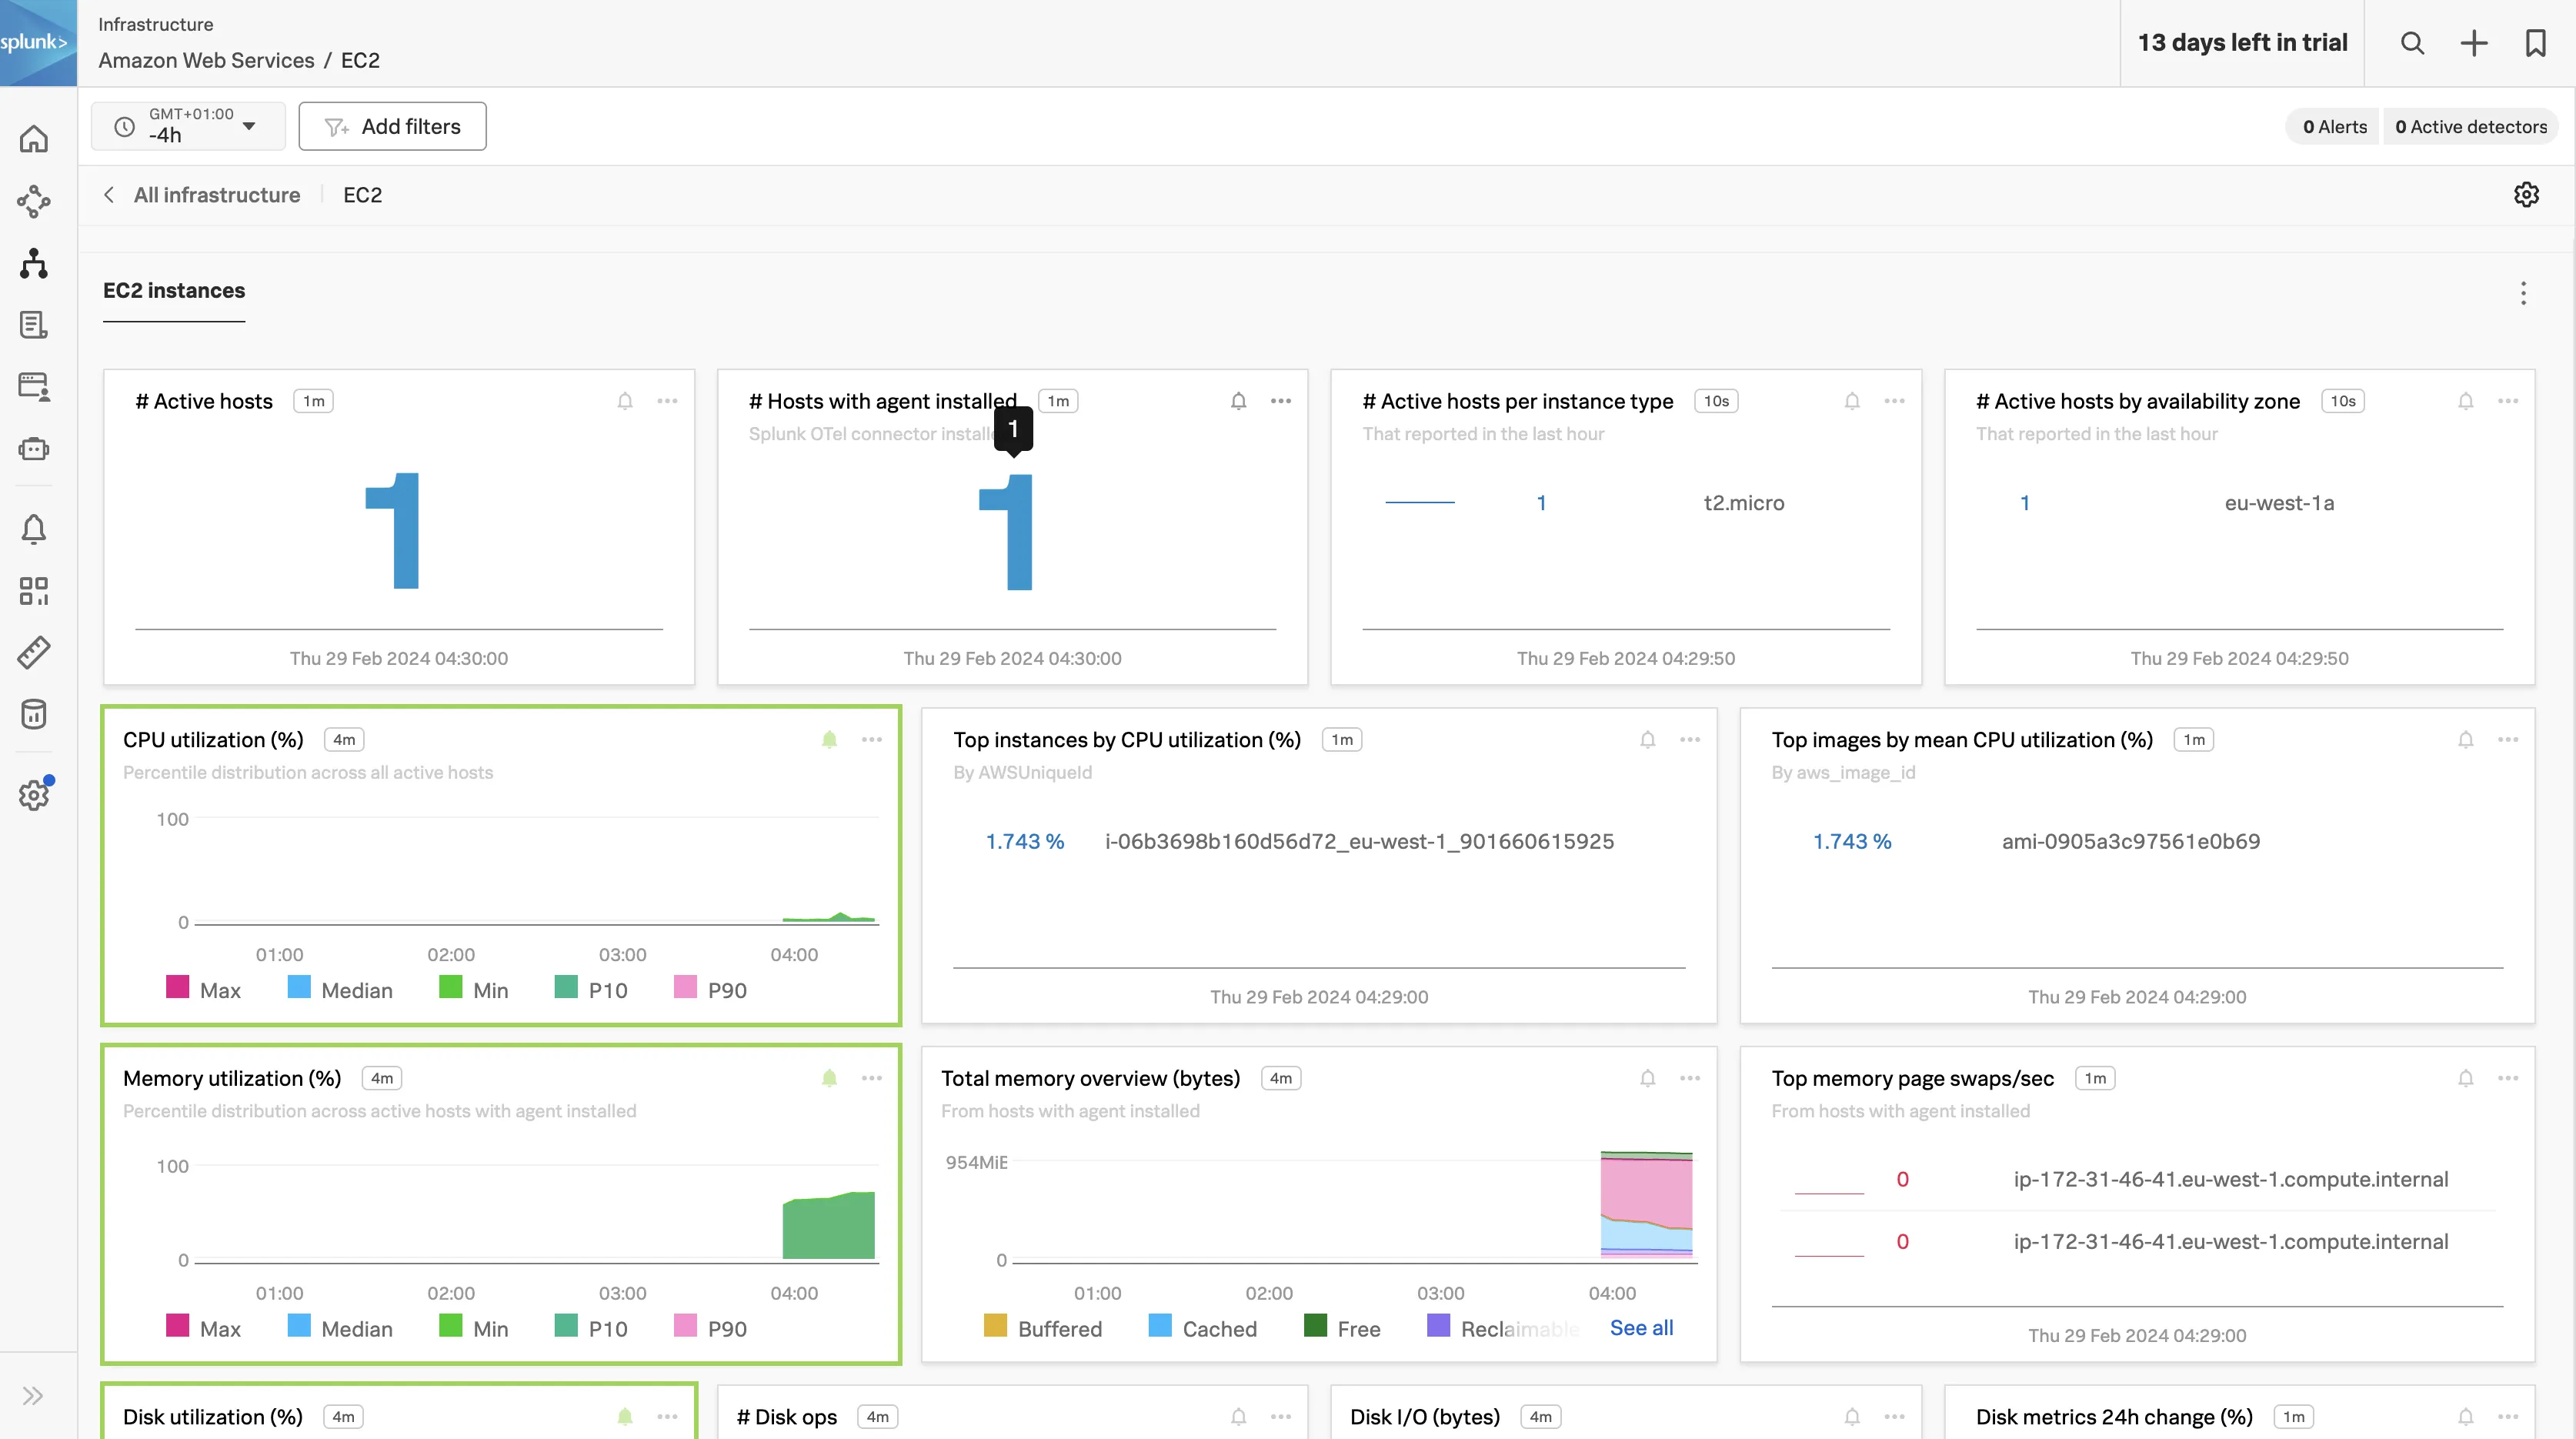
Infrastructure Monitoring in Splunk is designed to address real-time cloud monitoring requirements at scale. Splunk provided me with full-stack visibility into my infrastructure hosted in the cloud. It also supports in-context troubleshooting with logs by combining real-time metrics with logs already ingested in the Splunk Platform via Log Observer Connect. This is very useful for troubleshooting purposes.
Both tools perform well when it comes to infrastructure monitoring. Consider the costs when choosing between them.
Cut Your Observability Spend by 80%—Here's How
Switch from Datadog seamlessly with our automated migration tool, comparable features and up to 80% cost savings.
Learning Curve: Datadog for ease of use, Splunk for experienced users
Datadog
Datadog is very beginner-friendly and easy to use. There was little to no need to use the documentation for navigation.
Splunk
In contrast to Datadog, I didn’t have a good user experience with Splunk, I was mostly confused. It has a steep learning curve and is not beginner-friendly. Unlike Datadog, which offers a unified user interface for all monitoring activities, Splunk's approach is more fragmented, with distinct user interface platforms tailored to specific use cases. For example, there is the Splunk Cloud platform for data search and analysis, the Splunk Observability Cloud platform for APM and observability, and even the Splunk Attack Analyzer for security analysis.
Pricing: Based on the use case
Datadog
Datadog has a complex SKU pricing model, so the price of each Datadog product varies. In dynamic environments, where microservices are in use, data volume can quickly change over time. With Datadog’s SKU pricing model, it makes it difficult to predict costs in such environments.
In addition to this, Datadog charges for the creation of custom metrics ($0.05 per custom metric). Over time, this can significantly impact your billing.
Splunk
Splunk also has a complex SKU pricing model, some of the products do not have a fixed price and require contacting their sales team. Because Splunk deals with a large scale of data, it can be very expensive.
Both Datadog and Splunk can become costly, but Datadog's pricing model is more favorable compared to Splunk's. This is primarily because Splunk is engineered to manage large-scale data, necessitating significant storage and the processing and ingestion of vast data volumes. Datadog, on the other hand, can be used to focus on monitoring your environment on a smaller, less demanding scale.
Datadog vs Splunk: Final Verdict
If you are looking for observability and monitoring, you should choose Datadog over Splunk. Splunk also provides good observability and monitoring, but it is best suited for log management.
However, Splunk's complexity may pose challenges for some users, potentially making it less accessible for those who wish to grasp and utilize the data quickly.
Here’s a use-case-based guide for Datadog vs Splunk:
- If you need a tool that is easy to get started with, choose Datadog
- If you want a better correlation between your signals, then choose Datadog.
- If you want comprehensive log management capabilities, choose Splunk.
- If you want to use the entire platform without worrying too much about billing, choose Datadog.
- If your use case is Cloud SIEM, then choose Splunk.
- If you want to search through large data volumes, choose Splunk.
Datadog and Splunk are great tools but they are costly to use. If you’re looking for a cost-effective option, SigNoz is a full-stack open-source monitoring and observability tool that can be used as an alternative to Datadog and Splunk.
Why choose SigNoz over Datadog and Splunk?
Datadog and Splunk have their drawbacks even as powerful monitoring and observability tools. Here are a few reasons why you should choose SigNoz over Datadog and Splunk:
- Transparent & Simple Pricing: Unlike Datadog, which charges for every custom metric you create, SigNoz offers a different approach. With SigNoz, your charges remain at $0.1 per million samples, regardless of the type of metrics you send. Also, SigNoz provides transparent and predictable pricing. You are billed solely based on the volume of data you send, which helps prevent unexpected costs. This is in contrast to Datadog and Splunk, where pricing can be more complex and less predictable. For those new to SigNoz, the open-source version is completely free to use, reducing costs for users who are just starting to explore the platform.
- Single Pane of Glass: SigNoz provides logs, metrics, and traces under a single pane of glass. Unlike Splunk, which has multiple platforms for different use cases, SigNoz consolidates all the information you need about your applications and infrastructure in a unified interface. You can correlate metrics and traces easily with a single click and create custom dashboards for monitoring your infrastructure.
- Open-Source: SigNoz offers both an open-source and cloud version, providing users with flexibility based on their specific requirements. Users can choose between the versions depending on their use case: opt for the self-hosted (open-source) version for complete control over environment management, or choose the cloud version for hassle-free management without the need for self-hosting.
- OpenTelemetry support: SigNoz is built to natively support OpenTelemetry, an open source project under the Cloud Native Computing Foundation(CNCF), for generating telemetry data (logs, metrics, and traces). OpenTelemetry also frees you from vendor lock-in, enabling users to export data to any backend of choice.
Getting Started with SigNoz
SigNoz Cloud is the easiest way to run SigNoz. Sign up for a free account and get 30 days of unlimited access to all features.

You can also install and self-host SigNoz yourself since it is open-source. With 24,000+ GitHub stars, open-source SigNoz is loved by developers. Find the instructions to self-host SigNoz.
Key Takeaways
- Datadog excels in cloud-native monitoring and offers a user-friendly experience.
- Splunk shines in log management and complex data analysis scenarios.
- Consider deployment options, scalability needs, and your specific use cases.
- Evaluate the total cost of ownership, including licensing, training, and maintenance.
- SigNoz presents a compelling open-source alternative worth exploring.
FAQs
Is Datadog better than Splunk for cloud environments?
Datadog is often considered more suitable for cloud environments due to its cloud-native architecture and extensive integrations with cloud services. However, Splunk has made significant strides in cloud monitoring and may be preferable if you need to combine cloud and on-premises data analysis. Consider SigNoz as an open-source alternative that can be a cost-effective solution for cloud environments.
How do Datadog and Splunk compare in terms of cost for large-scale deployments?
For large-scale deployments, Splunk can become expensive due to its data ingestion-based pricing model. Datadog's host-based pricing may be more predictable but can also add up quickly. It's crucial to model your expected usage and compare the total cost of ownership for both platforms.
Can Splunk handle real-time monitoring as effectively as Datadog?
While Datadog is known for its real-time monitoring capabilities, Splunk has significantly improved in this area. With proper configuration, Splunk can provide effective real-time monitoring, especially when combined with its powerful analytics capabilities.
What are the main differences in the learning curve between Datadog and Splunk?
Datadog generally has a gentler learning curve, with an intuitive interface and out-of-the-box dashboards. Splunk, while more powerful, often requires more time to master, especially when it comes to advanced search and analytics using SPL.
What are the main differences between Datadog and Splunk?
Datadog and Splunk are both popular monitoring and observability tools, but they have key differences. Datadog excels in ease of use and APM features, while Splunk is known for its powerful log management and search capabilities. Datadog is more suitable for general monitoring and observability, while Splunk is better for large-scale data search and analysis.
Which tool is better for Application Performance Monitoring (APM)?
Datadog is generally considered better for APM due to its advanced features, intuitive user interface, and ease of setup. It offers code-level tracing, live trace search, continuous profiling, and error tracking. While Splunk also provides APM capabilities, Datadog's offering is more comprehensive and user-friendly.
How do Datadog and Splunk compare in terms of log management?
Splunk is superior for enterprise-level log management, especially for businesses dealing with large datasets and extensive log volumes. It offers advanced search capabilities and can integrate data from various sources. Datadog also provides good log management features, including automatic tagging and pattern analysis, but it's more suitable for smaller-scale log management needs.
Which tool has better search capabilities?
Splunk is widely recognized for its powerful search capabilities, particularly when dealing with large volumes of data. It uses the Splunk Processing Language (SPL) for complex queries and data analysis. While Datadog offers good search functionality, Splunk is the better choice for advanced, large-scale data searching.
How do Datadog and Splunk compare in terms of pricing?
Both Datadog and Splunk have complex pricing models that can become costly. Datadog's pricing is generally more favorable for smaller-scale monitoring needs, but it charges for custom metrics creation. Splunk can be very expensive, especially for large-scale data processing. The choice depends on your specific use case and data volume.
Is there an open-source alternative to Datadog and Splunk?
Yes, SigNoz is mentioned as a full-stack open-source monitoring and observability tool that can be used as a cost-effective alternative to Datadog and Splunk. It offers transparent pricing, a unified interface for logs, metrics, and traces, and native support for OpenTelemetry.
Further reading:
SigNoz - Open-Source Alternative to DataDog
