Top 11 Prometheus Alternatives in 2026 [Includes Open-Source]
Prometheus has been one of the most popular open-source monitoring tools for the last few years. However, as systems become more complex, Prometheus looks like a monolithic application that just can’t match performance needs anymore. In fact, it also lacks high availability and easy scalability. In this article, we will go through the top 11 Prometheus alternatives that you can consider using.
That calls for searching for Prometheus alternatives. While your options are many, you can narrow down your search by focusing on the ones that deliver superior performance, data ingestion, compression with high availability, and scalability. Let’s take a look at the top 11 tools.
Why Look for Prometheus Alternatives?
Prometheus is a popular metrics monitoring tool. But there are many use cases where it might not be the best fit. Some scenarios where people look for Prometheus alternatives are:
- Complex set up and issues in scaling
Some people find it complex to set up. Also, managing its scalability for very large and dynamic environments can become complex. - Not a fan of PromQL
Some users just don’t like PromQL, the query language of Prometheus for querying metrics. - More use cases than just Metrics monitoring
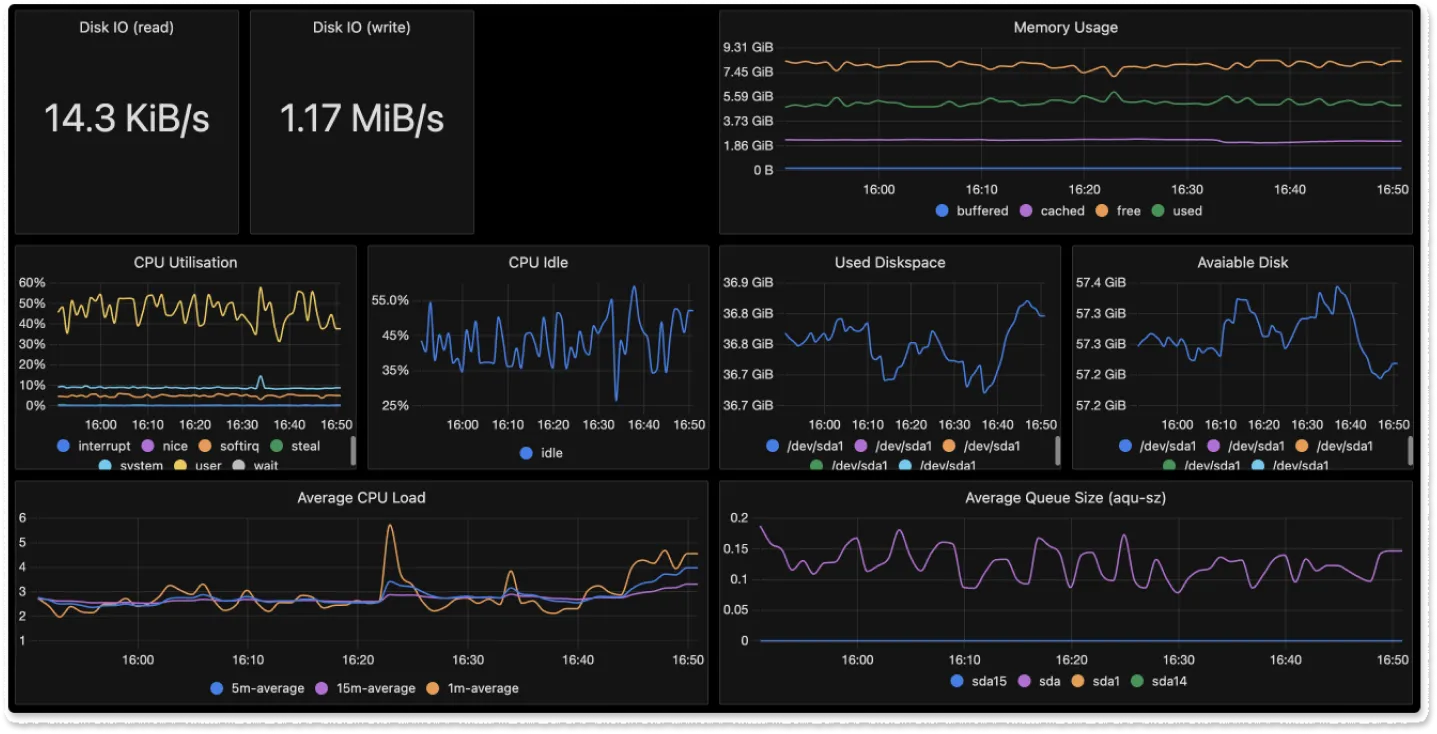
Prometheus is limited to metrics monitoring. Some users want to do more than metrics and don’t want to use multiple tools for their monitoring set up. SigNoz, an open-source Prometheus alternative can do logs, metrics, and traces under a single pane of glass.
We have created a list of 11 Prometheus alternatives that you can consider for your use-cases.
Top 11 Prometheus Alternatives
1. SigNoz (Open-Source)
SigNoz is a full-stack OpenTelemetry native monitoring tool. It’s effective not only as a Prometheus alternative but also for monitoring any application that generates different types of telemetry data. It offers logs, metrics and traces under a single pane of glass, and has other exceptional features like root cause analysis, live tailing, anomaly detection, and detailed trace filtering.
Not only that, but it uses columnar ClickHouse-based storage to generate analytics quickly. Moreover, when it comes to metrics and dashboards, you can enable a Prometheus receiver to receive any metrics exposed in a running Prometheus instance. It has a strong community that’s proactive, extensive documentation, and a user-friendly journey. Additionally, there are no licensing costs if you self-host it as it is open source.
It also provides a cloud version where you can just sign-up and start sending your monitoring data.
Pros:
- Support for PromQL to help you set up trigger-based alerts with the DIY query builder
- Ingest, process, and analyze data at highly scalable levels while reducing costs
- Easy to migrate out of Prometheus to SigNoz as it supports Prometheus metrics
Cons:
- Live support is unavailable
- More visualization types needed
2. InfluxDB + Chronograf
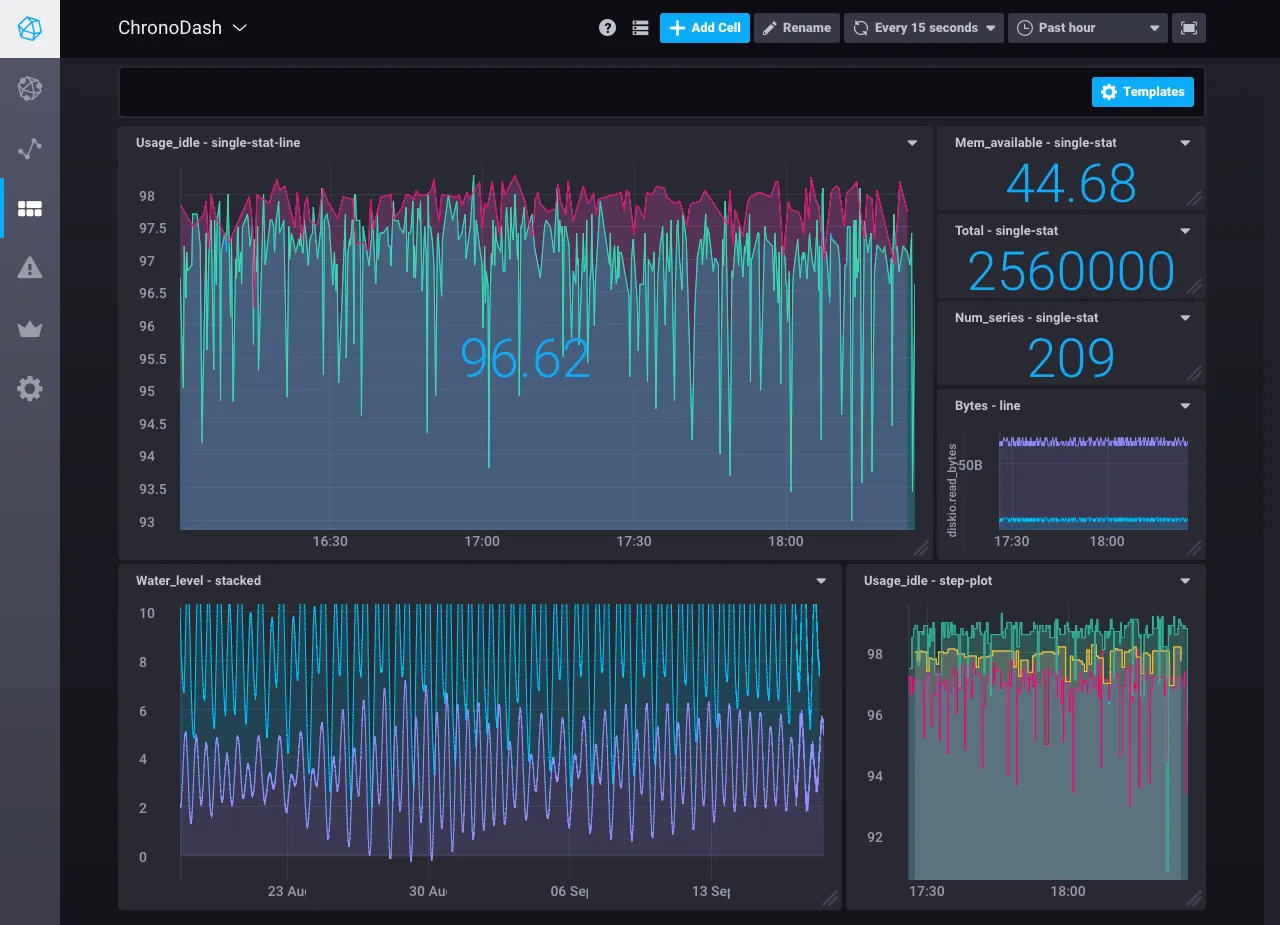
Source: Influxdata documentation
InfluxDB is a database for collecting and storing time-series data, whereas Chronograf is for visualizing that data and deriving metrics and real-time analytics. In fact, Chronograf can also help you build queries, alerts, and dashboards.
You can use 20+ pre-built dashboards, templates, and libraries to not build everything from scratch, and save yourself time. It’s ideal for all your Influx deployments. Now back to InfluxDB, it’s perfect for handling telemetry data and comes with a straightforward query language that is easy and quick to learn.
Its powerful integrations can make aggregating large data sets a breeze! It’s extremely resource-efficient, sometimes more than Prometheus, and when backed by Chronograf’s simple interface and customizable dashboards, it can be effective for infrastructure and alert management.
Pros:
- InfluxDB is known for fast bulk queries, low latency, and resource efficiency, and its retention policies are top-tier for scalability
- Chronograf’s best at visualizing time-series data with better redundancy storage, customizable dashboards, and a user-friendly interface
Cons:
- InfluxDB has certain operations which are difficult to execute, and its open-source version lacks support for certain deployments
- Chronograf has limited data support and is less powerful than visualization alternatives
3. Zabbix
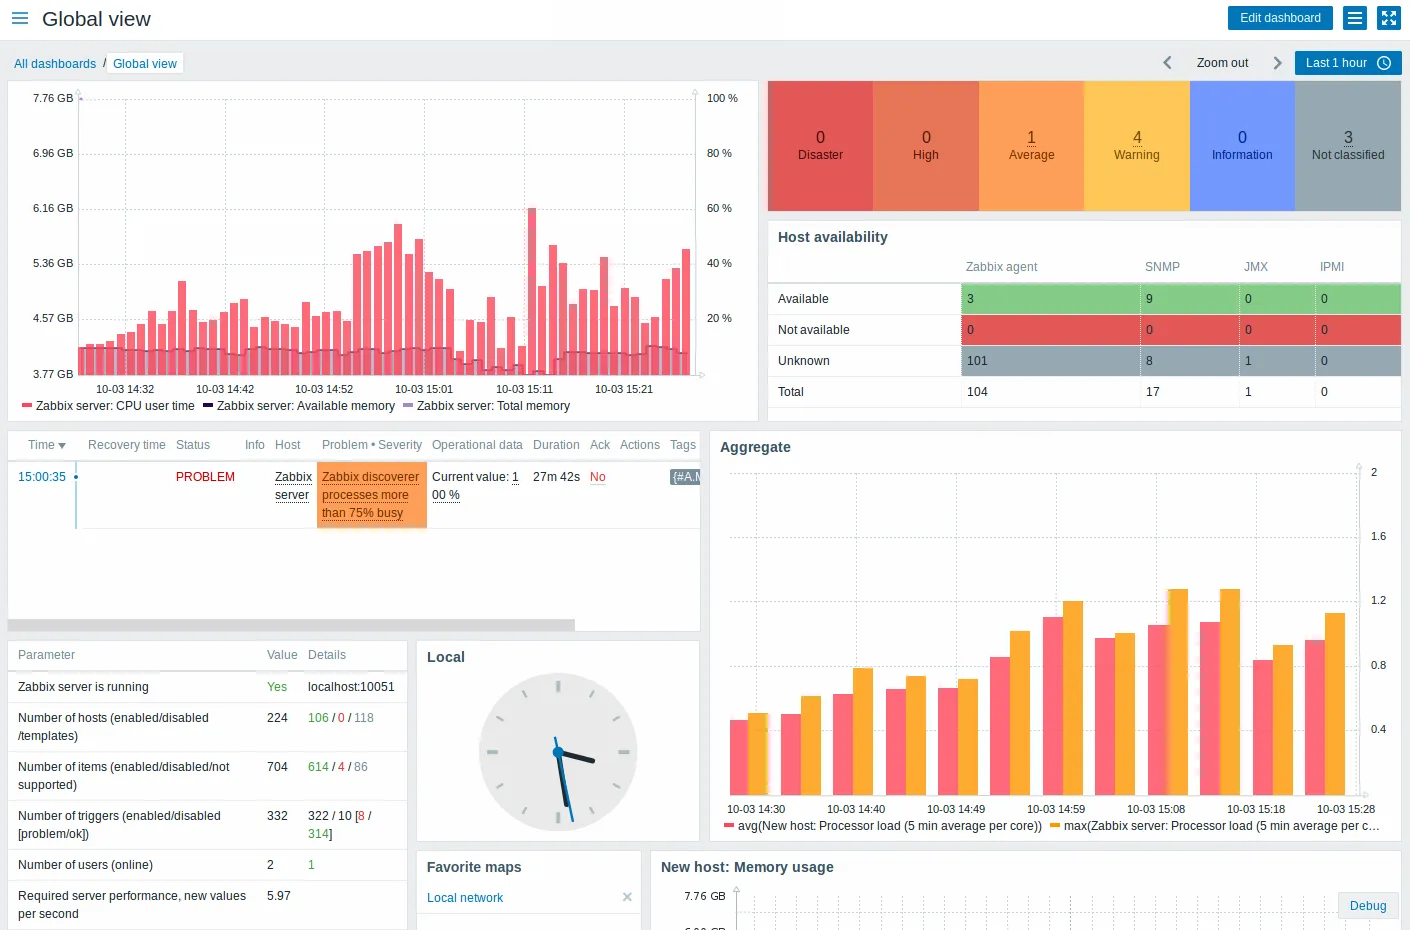
Source: Zabbix
An enterprise-class network monitoring solution, Zabbix is an excellent Prometheus alternative that’s also open-source. In fact, Zabbix is a Prometheus predecessor which provides high-performance monitoring, low resource usage, and streamlined data processing.
Zabbix is known for its reliability in production environments. You can take advantage of its advanced alerting features or self-healing capabilities.
Zabbix offers flexibility of deployment options along with a ‘single pane of glass’ view of your entire infrastructure. It has a web interface for smooth real-time monitoring, alerting, and visualization of infrastructure performance. You can also use its APIs to integrate them into your applications and enjoy integration with numerous services like Grafana, Prometheus, Elasticsearch, and AWS.
Pros:
- More ready-to-use solutions with easy-to-understand performance graphs, severity charts, and customizable options
- Can process unstructured data, and can collect data from numerous sources like SNMP and JMX
Cons:
- There’s no built-in machine-learning support within the application
- Lack of pre-built integration options, especially for specific platforms or cloud applications
4. Nagios
Source: Nagios
Supported by a powerful community, Nagios is an open-source monitoring solution perfect for your entire infrastructure. As a Prometheus alternative, it gets the job done when you’re focusing on application network traffic and security. It’s known for its centralized visual operational status that enables speedy resolutions and a commercial-grade netflow data analysis solution for checking data dips and spikes.
It has a log server for easy visualization, analysis, and archival of logs. You can use the multiple available add-ons for cross-platform monitoring, flexible data transport mechanisms, or integrating passive alerts. You can rely on Nagios for server performance monitoring, capacity planning, and snapshot configurations in addition to server, network, and application monitoring.
Pros:
- Facilitates high availability of applications with a web-based interface and a vast library of plugins
- Multitude of graphical reports, dashboards for visualizing multiple end points with community support
Cons:
- It can be costly, despite being an open-source solution
- The UI can be better in comparison to modern monitoring alternatives
5. Icinga
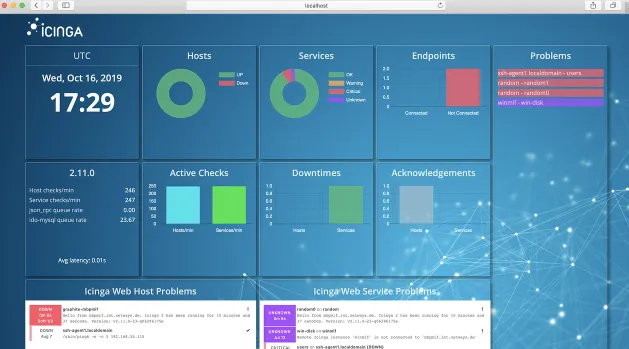
Icinga is a popular Prometheus alternative that has six core areas of focus: infrastructure monitoring, monitoring automation, cloud monitoring, outstanding integrations, meaningful visualizations, and triggered-based alerts or notifications.
You can check availability, performance, and trends or combine and visualize metrics. You can also create reports, automate and synchronize monitoring objects with ease. It’s highly configurable and relies on active checks to monitor a system, as opposed to Prometheus’s pull-based model.
It stores data in external databases like MySQL or PostgreSQL and doesn’t have a dedicated query language like Prometheus. However, Icinga doesn’t have great visualization options. Prometheus, often used with Grafana, has better in-built visualization capabilities. What’s special about Icinga is its advanced alerting system with flexible notification options like email or SMS.
Pros:
- It actively collects data, thereby facilitating more real-time alerts for faster troubleshooting
- Compatible with a wide range of systems with multiple integrations and plugins
Cons:
- High scalability depends on manual configuration entirely
- It can be a steep learning curve with complicated configuration options
6. Splunk
Source: Splunk
Splunk is a proprietary commercial-grade data management software with a built-in AI that can improve detection, investigation, and response. It can collect data accurately and efficiently from various sources and allow for real-time visualization, allowing enterprises to restore mission-critical services in seconds.
Splunk is also adept at distributed tracing, which is ideal for troubleshooting microservices-based architectures. This is a bonus for highly scalable production environments with complex systems. It’s an SIEM with enormous searching and reporting facilities.
Moreover, it can create a data source from any type of data generation. It has its own search processing language (SPL) with advanced functionalities like data search, correlation, and visualization and also more plugins and integrations than Prometheus!
Pros:
- Effective at automating workflows and proactive monitoring in real-time
- Better scalability options with a push model that stores data in a centralized database
Cons:
- It is pricier with licensing costs, and deployment size considerations
- It requires a higher network overhead as it’s constantly pulling data
7. Logz.io
Logz.io isn’t a Prometheus alternative, it’s more of a wrapper that offers Prometheus as a service so that you can track logs and traces within a single platform. This implies that you’ll be able to scrape metrics using Prometheus but won’t be limited by its management, scalability, or storage, as Logz.io will take care of it.
Perfect for cloud, hybrid, or on-premise environments, Logz.io can centralize your metrics once you create an account and add a remote write to your config files. If you’re not an existing Prometheus user,you can use the Telemetry Collector agent, which will help collect metrics for further storage and analysis.
With log management, infrastructure monitoring, and distributed tracing as its main areas of strength, Logz.io is replacing traditional APM as a cloud-based SIEM. You can use pre-built dashboards, create newer ones, or migrate older dashboards to correlate data easily. In fact, its data optimization hub can help you filter out low-priority data.
Pros:
- Faster troubleshooting with reduced costs to improve system health, performance, and security
- 300+ integrations to monitor any stack, and quick and easy onboarding functionalities
Cons:
- Customer service isn’t exceptional
- You can process a limited number of logs daily, and bypassing this requires expensive add-on purchases
8. VictoriaMetrics
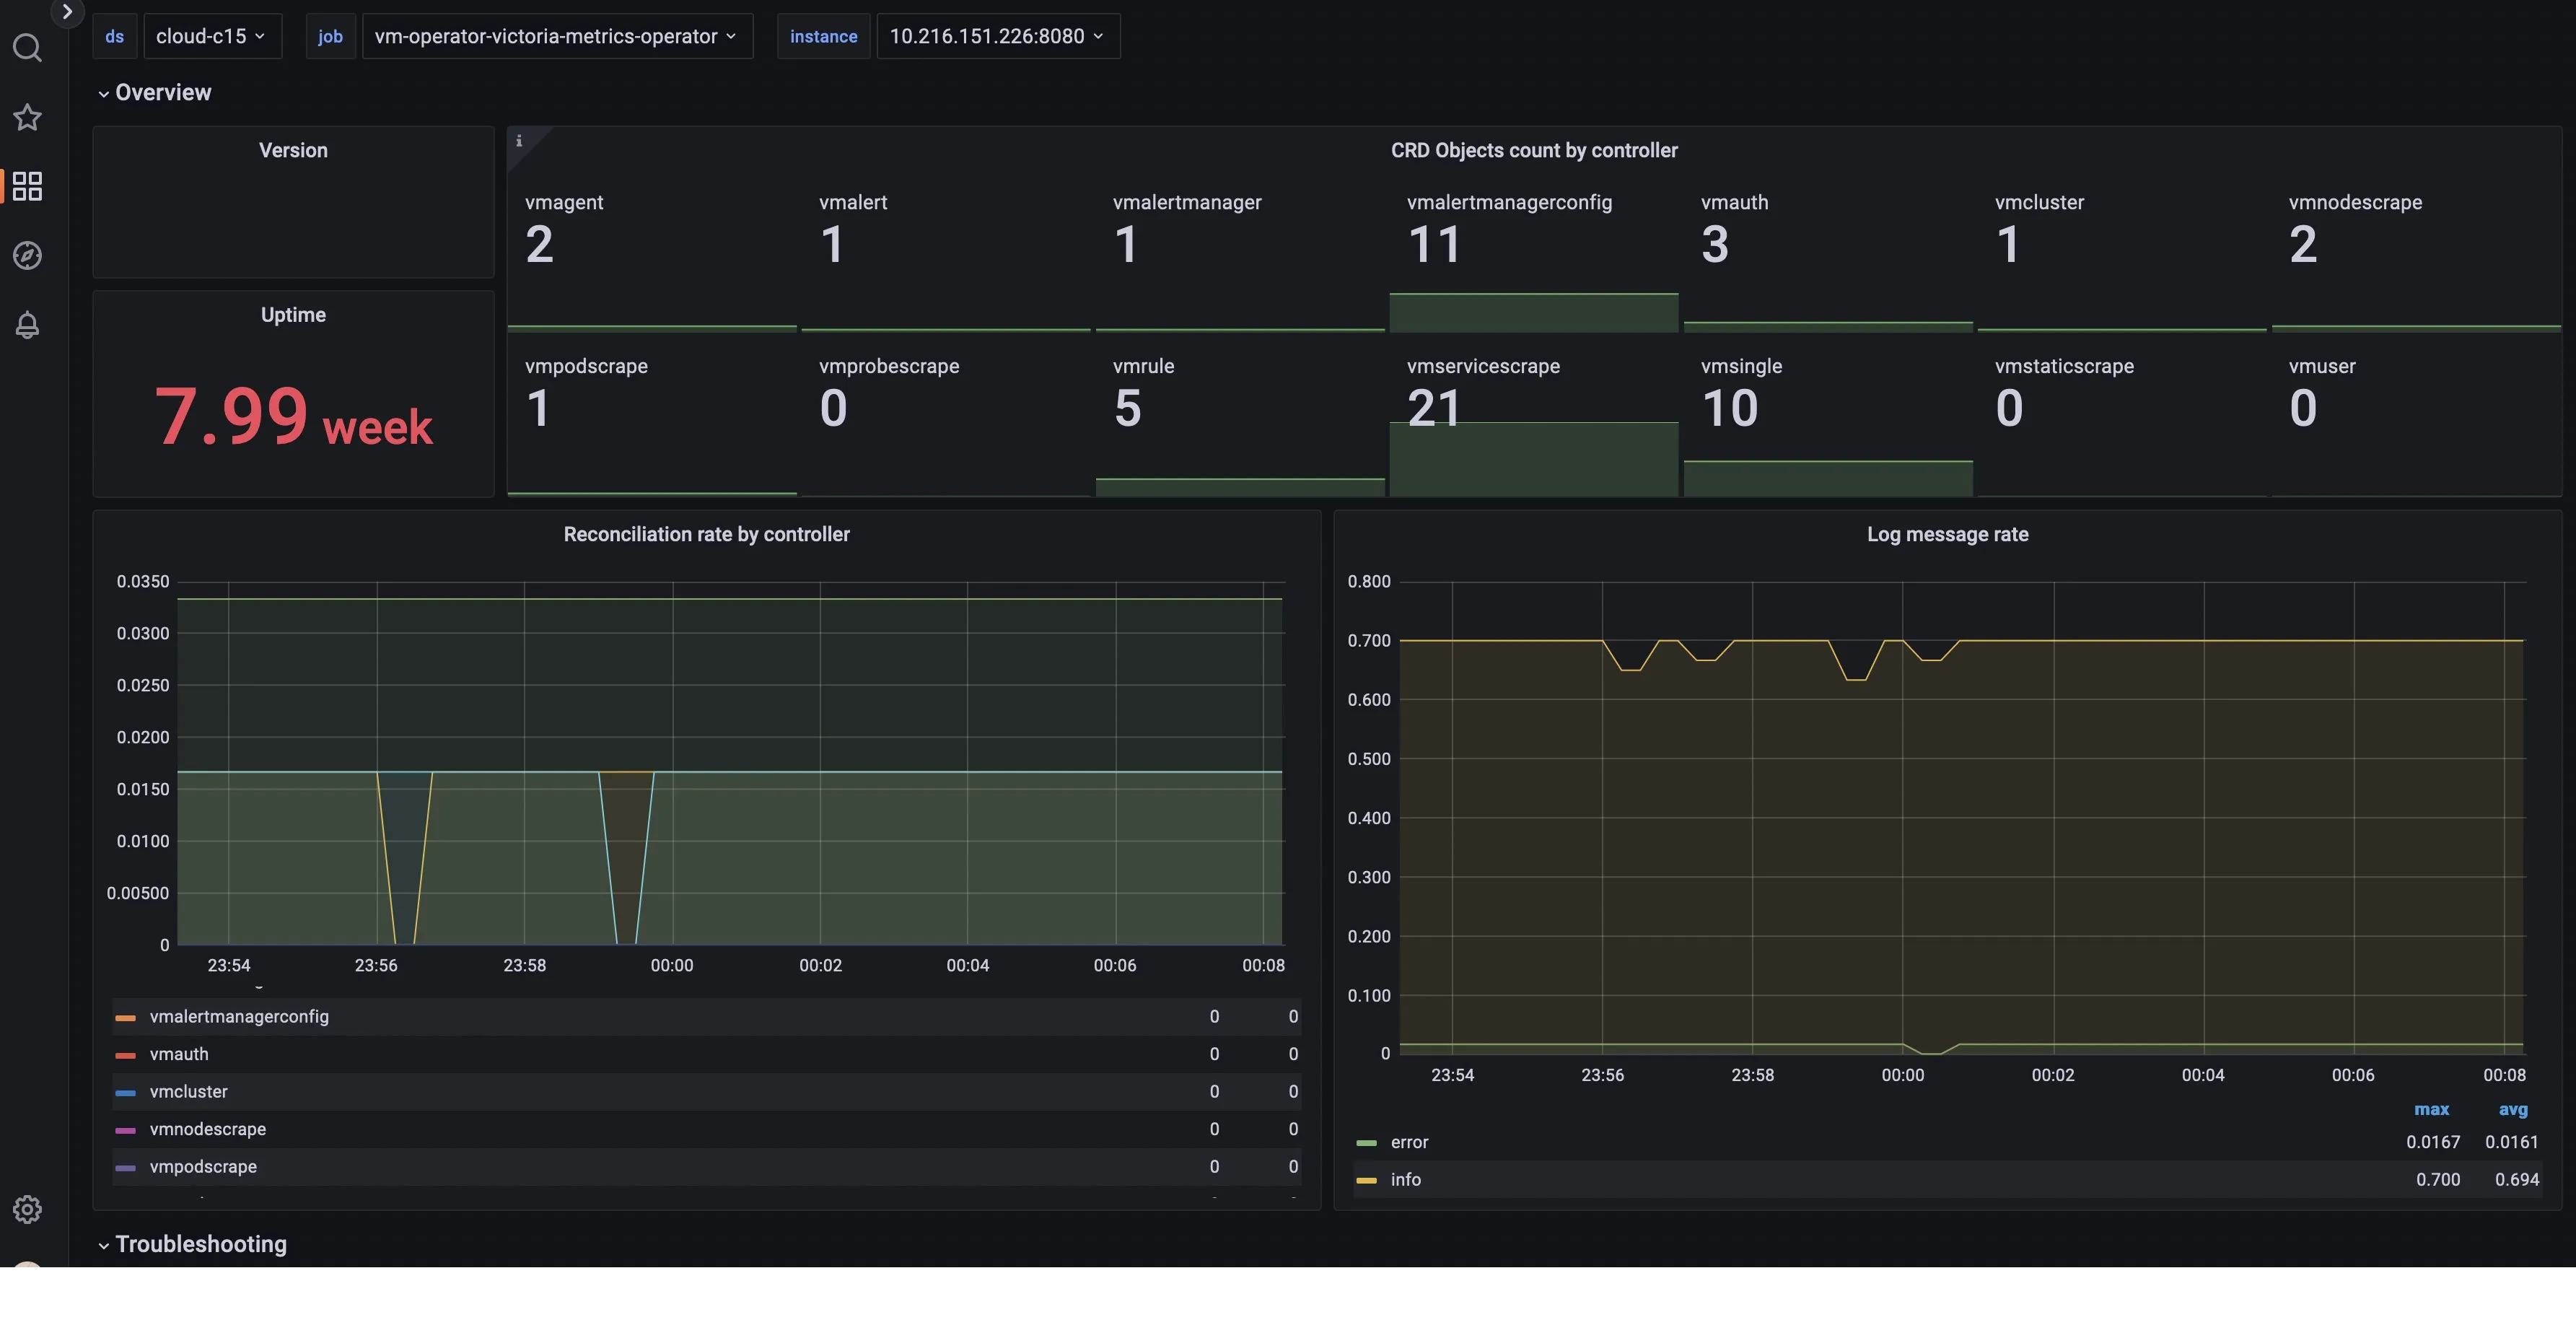
Source: VictoriaMetrics
VictoriaMetrics is a superior Prometheus alternative that’s known for being more resource-efficient. It’s an open-source observability solution that is easy to configure and operate, ideal for long-term metrics storage and multi-tenancy support.
It offers the same features as Prometheus does, but has additional benefits like high performance, high scalability, and anomaly detection for troubleshooting. While scraping data, Prometheus uses more resources in comparison to VictoriaMetrics. Its query language MetricsQL allows you to do more than PromQL. You can use Remotewrite to configure VictoriaMetrics to read data from Prometheus.
Pros:
- More effective data compression capabilities than other alternatives
- It can be used as a long-term storage solution for Prometheus with fast backups, and advanced data ingestion and querying
Cons:
- It can be pricier, especially while dealing with large volumes of data
- The graphical user interface can be enhanced
9. TimescaleDB + Telegraf + Grafana
TimescaleDB, Telegraf, and Grafana come together to make a powerful application monitoring stack. TimescaleDB helps you store time-series data in a highly scalable platform for real-time and historical analysis.
Telegraf collects, aggregates, and sends metrics and events, which get stored in TimescaleDB. Then, Grafana helps you visualize this data. When you have a TimescaleDB instance running, you’ll be able to query the data and build real-time dashboards. Furthermore, TimescaleDB makes it exceptionally easy to get the data out, thereby reducing time and lessening the learning curve.
Telegraf, with its data collection, is here to evaluate database performance and application response time. Grafana can help you set up alert rules and dispatch timely notifications for faster troubleshooting.
Pros:
- Purpose-built tools allow you more flexibility to collect data and visualize metrics
- You’re able to have an eye on all application layers to ensure a seamless and optimized user experience
Cons:
- You have to use three separate tools
- It might require more manual intervention to manage them
10. Sensu
Source: Sensu
Sensu is an observability platform that offers monitoring-as-code for DevOps and SRE teams. It’s designed for the cloud and open-source and lets you visualize every protocol across a single dashboard view. This Prometheus alternative has different functionalities than Prometheus but lets you automate workflows, enjoy instant visibility, and integrate tools and plugins for a seamless experience.
It’s known for its flexible, API-rich observability pipeline, but it doesn’t have a data storage backend. In fact, it relies on time-series databases like Prometheus or Graphite. It’s not that efficient at alerting like Prometheus. However, it’s effective for monitoring data.
Pros:
- Perfect for multi-cloud monitoring, with container monitoring being the best
- Easy to set up this centralized monitoring management platform, and push and pull models make it flexible
Cons:
- Built-in alerting and notification triggers could be more advanced
- Scalability can be difficult as it doesn’t have a native federated architecture
11. Mimir by Grafana (open-source)
Mimir is an open-source, horizontally scalable time-series database provided by Grafana.
It extends the Prometheus ecosystem with a focus on horizontal scalability and long-term storage. Designed to be API-compatible with Prometheus, Mimir allows for seamless integration with existing Prometheus setups but distinguishes itself by enabling massive scale across multiple nodes and clusters.
It offers durable, long-term storage capabilities and is built to handle billions of metrics across many tenants, addressing the scalability and multi-tenancy limitations of Prometheus. Mimir's architecture facilitates easier management of large-scale monitoring environments, providing robustness and resilience without sacrificing Prometheus's core strengths.
Pros:
- Scalability
- Long-term storage
Cons:
- Learning Curve
- Operation overhead
How to Choose the Right Prometheus Alternative
There are too many alternatives you’d find. While each comes with its pros and cons, here’s what you should consider before picking the right one:
- The underlying database should support very high write throughput as a lot of monitoring signals are generated
- You should be able to easily visualize the data using custom graphs and charts
- Along with visualization, you should be able to set up custom alerts and notifications
- You should take care of the data access pattern depending on your monitoring use case
- There should be a balance between ease of use and functionalities
- Take care of the cost involved — this includes additional costs apart from data storage
- Ensure that you can independently scale your data storage layer without impacting the visualizations
SigNoz can be a great Prometheus alternative, provided its existing compatibility with the Prometheus ecosystem. Moreover, it can be your one-stop solution for all observability needs.
Getting Started with SigNoz
SigNoz Cloud is the easiest way to run SigNoz. Sign up for a free account and get 30 days of unlimited access to all features.

You can also install and self-host SigNoz yourself since it is open-source. With 24,000+ GitHub stars, open-source SigNoz is loved by developers. Find the instructions to self-host SigNoz.
Further Reading:
