Overview
OpenTelemetry Go automatic instrumentation attaches eBPF probes to a running Go process and exports traces to SigNoz. eBPF is a Linux kernel feature that runs small programs at chosen points in a process. The agent runs beside your application as a separate process. Your binary stays as you built it.
The agent produces traces only. It produces no metrics and no logs. SigNoz derives rate, error, and latency metrics from the spans.
Prerequisites
- A Linux host on amd64 or arm64, with kernel 4.19 or later. On macOS and Windows, run the agent in a Linux container or a virtual machine.
- Permission to run a privileged container as root.
- A Go application that uses at least one supported library.
- The path of the application binary, and the path must be readable by the agent.
- An instance of SigNoz (either Cloud or Self-Hosted).
How it works
The agent runs as its own process next to your application. It reads the target binary, finds the functions it knows how to trace, and attaches uprobes to them. A uprobe is a kernel hook that fires when the process reaches a chosen instruction.
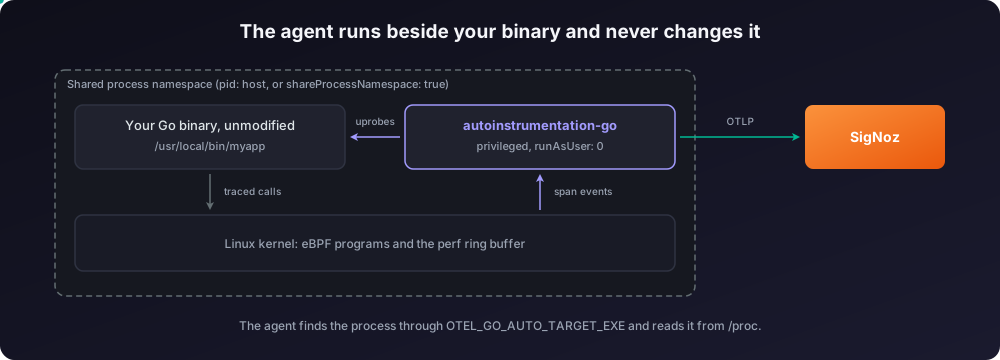
The eBPF programs write events into a kernel ring buffer. The agent reads that buffer, builds spans, and exports them to SigNoz. This is why the agent needs a shared process namespace, root, and a privileged container: it reads another process through /proc and loads programs into the kernel.
Send traces to SigNoz
Step 1. Run the agent next to your application
The agent finds the target process through OTEL_GO_AUTO_TARGET_EXE, which holds the full path of the binary. It shares a process namespace with the application, so it can read that path.
Add the agent as a service in your docker-compose.yaml. It needs the host process namespace, the /proc directory, and the same binary path as the application:
services:
  myapp:
    image: <your-image>
    volumes:
      - ./bin:/app:ro
    command: /app/myapp

  go-auto:
    image: otel/autoinstrumentation-go:v0.24.0
    privileged: true
    pid: "host"
    environment:
      OTEL_GO_AUTO_TARGET_EXE: /app/myapp
      OTEL_SERVICE_NAME: "<service-name>"
      OTEL_EXPORTER_OTLP_ENDPOINT: "https://ingest.<region>.signoz.cloud:443"
      OTEL_EXPORTER_OTLP_HEADERS: "signoz-ingestion-key=<your-ingestion-key>"
    volumes:
      - ./bin:/app:ro
      - /proc:/host/proc
    depends_on:
      - myapp
Mount the binary at the same path in both containers. The agent reads the path through /proc, so the two paths must match.
Start the stack:
docker compose up -dRun the agent as a second container in the same Pod as the application.
Store the ingestion key in a Secret:
kubectl create secret generic signoz-ingestion \
  --from-literal=otlp-headers="signoz-ingestion-key=<your-ingestion-key>"
Add the agent container and set shareProcessNamespace on the Pod:
apiVersion: apps/v1
kind: Deployment
metadata:
  name: myapp
spec:
  replicas: 1
  selector:
    matchLabels:
      app: myapp
  template:
    metadata:
      labels:
        app: myapp
    spec:
      # The agent and the application must share a process namespace.
      shareProcessNamespace: true
      containers:
        - name: myapp
          image: <your-image>
          ports:
            - containerPort: 8080

        - name: autoinstrumentation-go
          image: otel/autoinstrumentation-go:v0.24.0
          imagePullPolicy: IfNotPresent
          env:
            - name: OTEL_GO_AUTO_TARGET_EXE
              value: /usr/local/bin/myapp
            - name: OTEL_SERVICE_NAME
              value: "<service-name>"
            - name: OTEL_EXPORTER_OTLP_ENDPOINT
              value: "https://ingest.<region>.signoz.cloud:443"
            - name: OTEL_EXPORTER_OTLP_HEADERS
              valueFrom:
                secretKeyRef:
                  name: signoz-ingestion
                  key: otlp-headers
          securityContext:
            runAsUser: 0
            privileged: true
OTEL_GO_AUTO_TARGET_EXE holds the binary path inside the application container. The agent resolves it through the shared process namespace.
Apply it:
kubectl apply -f deployment.yamlIf your cluster enforces Pod Security admission, the namespace must allow privileged Pods. Label it before you apply the Deployment:
kubectl label namespace <your-namespace> pod-security.kubernetes.io/enforce=privilegedRun the agent container against a process on the host. Mount the binary read-only at the same path it has on the host:
docker run --rm \
  --privileged \
  --pid=host \
  -v /usr/local/bin/myapp:/usr/local/bin/myapp:ro \
  -v /proc:/host/proc \
  -e OTEL_GO_AUTO_TARGET_EXE=/usr/local/bin/myapp \
  -e OTEL_SERVICE_NAME="<service-name>" \
  -e OTEL_EXPORTER_OTLP_ENDPOINT="https://ingest.<region>.signoz.cloud:443" \
  -e OTEL_EXPORTER_OTLP_HEADERS="signoz-ingestion-key=<your-ingestion-key>" \
  otel/autoinstrumentation-go:v0.24.0
To run the agent without Docker, build it from source. The build needs Linux, clang, llvm, and libbpf-dev. See the build instructions. The project publishes no prebuilt binaries.
Verify these values:
<region>: Your SigNoz Cloud region.<your-ingestion-key>: Your SigNoz ingestion key.<service-name>: The name your service gets in SigNoz, for examplepayment-service.OTEL_GO_AUTO_TARGET_EXE: The full path of the application binary, not the process name.
If the application is not running yet, the agent waits for it to start.
Step 2. Confirm that the agent attached
Read the agent logs. A successful start ends with these lines:
loading probe
instrumentation loaded successfully, starting...
The agent also logs Offset not cached, analyzing directly for each field it reads from the binary. You see this when your Go version or library version is newer than the agent release. The agent then reads the offsets from the DWARF data in the binary.
This fallback needs debug information. A binary built with -ldflags "-s -w" carries none, so the agent fails to load the probe instead of continuing. Either build that binary without stripping, or run an agent release whose cache covers your versions.
Validate
Send a few requests to your application, then open SigNoz.
Open Services. Your service appears with request rate, error rate, and latency within a minute or two.
Open Traces and filter by your service name. HTTP server spans use the route as the name, for example GET /rolldice.

Open one trace. Database calls and outbound HTTP calls appear as child spans of the request.

Supported libraries
The agent traces four libraries:
| Library | Spans |
|---|---|
net/http (client and server) | HTTP |
google.golang.org/grpc (client and server) | RPC |
database/sql | Database client |
github.com/segmentio/kafka-go | Messaging |
The agent takes no new probes until the new probe API is ready, so expect few additions. For the version ranges of the release this guide pins, see the compatibility matrix for v0.24.0.
Record the SQL statement
By default, a database/sql span carries no query text and is named DB. Two variables change that:
OTEL_GO_AUTO_INCLUDE_DB_STATEMENT=true
OTEL_GO_AUTO_PARSE_DB_STATEMENT=true
OTEL_GO_AUTO_INCLUDE_DB_STATEMENT adds the SQL text to the span. OTEL_GO_AUTO_PARSE_DB_STATEMENT also names the span after the operation and the table, for example SELECT rolls. The second variable works only when the first one is set.
Query text can contain personal data. Turn these on only when your queries are safe to store.
Capture spans from the OpenTelemetry API
If the application already creates spans with the OpenTelemetry global tracer provider, the agent can export them together with the eBPF spans. Set this variable on the agent:
OTEL_GO_AUTO_GLOBAL=trueAgent v0.24.0 supports go.opentelemetry.io/otel from v0.14.0 to v1.43.0. With Go 1.24 and later, the application needs v1.33.0 or later. An application on a newer otel release needs a newer agent, so check the compatibility file for the tag you run.
See Manual instrumentation in Go for how to create those spans.
Troubleshooting
Still not seeing data in SigNoz? Work through Debug missing traces, logs, and metrics, which covers SDK diagnostics, Collector connectivity, and the common ingestion errors for all three signals.
The agent starts but finds no process
- Cause:
OTEL_GO_AUTO_TARGET_EXEdoes not match the binary path, or the two containers do not share a process namespace. - Fix: Print the real path with
readlink /proc/<pid>/exeand use that value. In Docker, setpid: "host". In Kubernetes, setshareProcessNamespace: trueon the Pod. - Verify: The agent logs
instrumentation loaded successfully, starting....
The agent exits with a permission or BPF error
- Cause: The container is not privileged, the user is not root, or the kernel is older than 4.19.
- Fix: Set
privileged: trueandrunAsUser: 0. Rununame -ron the node to check the kernel version. - Verify: The agent loads its probes and stays running.
Kubernetes rejects the Pod
- Cause: Pod Security admission blocks the privileged container.
- Fix: Label the namespace with
pod-security.kubernetes.io/enforce=privileged, or move the workload to a namespace that allows privileged Pods. - Verify:
kubectl get podsshows the Pod with both containers ready.
The agent runs but no spans reach SigNoz
- Cause: The application uses no supported library, or the export fails.
- Fix: Compare your libraries against the supported list. Set
OTEL_LOG_LEVEL=debugon the agent and look forhandling spanlines and export errors. - Verify: The agent logs spans, and the service appears in SigNoz.
Spans have no Kubernetes attributes
- Cause: The agent does not read pod metadata.
- Fix: Send the data through the SigNoz Kubernetes Collector, which adds the
k8s.*attributes. You can also set them yourself with the downward API inOTEL_RESOURCE_ATTRIBUTES. - Verify: Spans carry
k8s.pod.nameandk8s.namespace.name.
Setup OpenTelemetry Collector (Optional)
Use the OpenTelemetry Collector when you need to process, filter, or route telemetry before it reaches SigNoz. Follow the Switch to Collector guide for setup instructions.
Then point the agent at the Collector:
OTEL_EXPORTER_OTLP_ENDPOINT="http://<collector-host>:4318"Limitations
- The agent runs on Linux only. On macOS and Windows, it must run in a Linux container or a virtual machine.
- The agent needs a privileged container and the root user.
- It traces four libraries. Your own code and other frameworks get no spans.
- It produces traces only, so you get no Go runtime metrics.
- The OpenTelemetry project still labels the agent as work in progress. Test it on a non-production service first.
Next steps
- Compare this page with Go compile-time instrumentation, which is stable and covers more libraries.
- Use OBI when you want kernel-level metrics and traces for services in any language.
- Set up alerts on error rate and latency.
Get Help
If you need help with the steps in this topic, please reach out to us on SigNoz Community Slack. If you are a SigNoz Cloud user, please use in product chat support located at the bottom right corner of your SigNoz instance or contact us at cloud-support@signoz.io.


