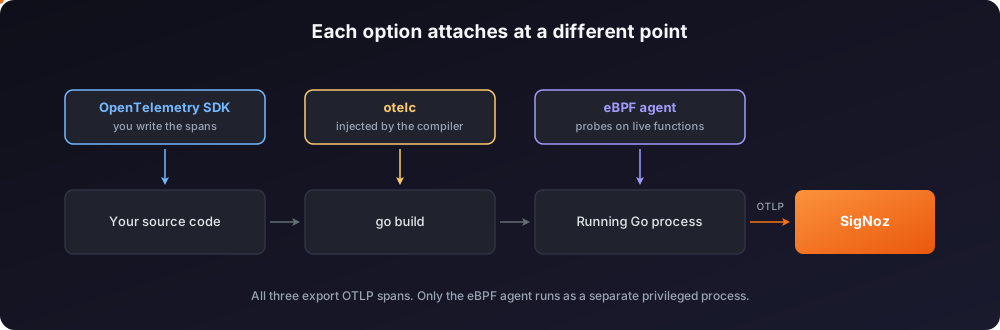
Go has three ways to send traces to SigNoz. You can add the OpenTelemetry SDK to your code, you can build the instrumentation into your binary, or you can attach an eBPF agent to the running process. This page compares them so you can pick one and start.
Compare the options
| OpenTelemetry SDK | Compile-time | eBPF | |
|---|---|---|---|
| How it works | You initialize the SDK and wrap libraries in your code | otelc injects the instrumentation during go build | A separate agent attaches probes to the running process |
| Code change | Yes | No | No |
| Rebuild | Yes | Yes | No |
| Elevated privileges | No | No | Yes, root and a privileged container |
| Operating system | Any | Any | Linux only |
| Library coverage | Every library with a contrib package | 13 common libraries | 4 libraries |
| Custom spans | Yes | Through the OpenTelemetry API | Through the global tracer provider |
| Signals | Traces, metrics, and logs | Traces and Go runtime metrics | Traces |
| Project status | Stable | Stable since v1.0.0 | Work in progress |
Choose your approach
Start with the OpenTelemetry SDK when you own the code and want full control. You choose which libraries to instrument, you add spans around your own business logic, and you send all three signals. This path costs you a few lines of setup code.
Reach for compile-time instrumentation when you want traces without touching the source. You add otelc to the build command, and the tool instruments the libraries it recognizes. Use it when a team owns many services and you want the same coverage in all of them.
Choose eBPF instrumentation only when you cannot rebuild the binary. A vendor binary or a frozen release artifact fits this case. The agent needs a privileged container, it runs on Linux only, and the OpenTelemetry project still labels it as work in progress.
Start here
Instrument your Go code with the OpenTelemetry SDK and send traces, metrics, and logs
Build the instrumentation into your binary with otelc, without a code change
Attach an agent to a running Go binary that you cannot rebuild
Add custom spans, attributes, and events around your own business logic
Combine the approaches
Both zero-code options carry the spans you write yourself.
- With compile-time instrumentation, the OpenTelemetry API works as usual. Create spans with
otel.Tracer(...)and they join the injected traces. See Manual instrumentation in Go. - With the eBPF agent, set
OTEL_GO_AUTO_GLOBAL=true. The agent then exports the spans your application sends to the OpenTelemetry global tracer provider.
Next steps
- Send logs from your Go application with Logrus, Zap, or Zerolog.
- Create a dashboard from the Go runtime metrics.
- Still not seeing data in SigNoz? Work through Debug missing traces, logs, and metrics.
Get Help
If you need help with the steps in this topic, please reach out to us on SigNoz Community Slack. If you are a SigNoz Cloud user, please use in product chat support located at the bottom right corner of your SigNoz instance or contact us at cloud-support@signoz.io.


