Overview
OpenTelemetry Go compile-time instrumentation adds tracing to your application during go build. The tool is called otelc. It rewrites the build, not your source code, so you keep your code free of OpenTelemetry calls. The instrumented binary exports traces and Go runtime metrics to SigNoz over OTLP.
Prerequisites
- Go 1.25 or later.
- An application that uses at least one supported library.
- An instance of SigNoz (either Cloud or Self-Hosted).
How it works
otelc wraps the Go toolchain. It reads your dependency graph, finds the libraries it has rules for, and injects hook code into those packages as the compiler runs. Your files on disk never change, so the repository shows no diff.
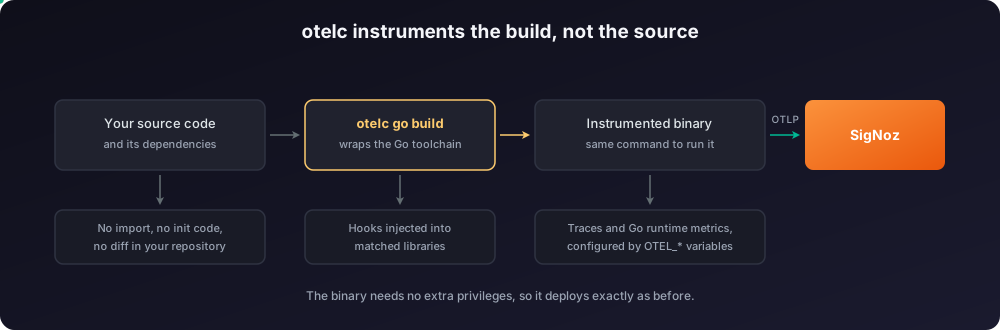
The build also injects the OpenTelemetry SDK setup. The binary reads the standard OTEL_* environment variables at startup and exports OTLP to SigNoz on its own. It needs no agent and no extra privileges.
Send traces to SigNoz
Step 1. Install otelc
Install the tool with go install:
go install go.opentelemetry.io/otelc/tool/cmd/otelc@v1.1.0Confirm that the tool is on your path:
otelc versionStep 2. Build your application with otelc
Put otelc in front of your normal build command.
otelc go build -o myapp .If a Makefile or a CI pipeline owns the build command, keep go build and plug otelc in through GOFLAGS:
otelc setup
export GOFLAGS="${GOFLAGS} '-toolexec=otelc toolexec'"
go build -o myapp .
Run otelc setup once in the module directory, and again after the dependencies change. It writes the matched rules to .otelc-build/, which the build reads.
Install otelc in the build stage and build the binary with it:
FROM golang:1.25 AS build
WORKDIR /src
RUN go install go.opentelemetry.io/otelc/tool/cmd/otelc@v1.1.0
COPY go.mod go.sum ./
RUN go mod download
COPY . .
RUN otelc go build -o /out/myapp .

FROM debian:bookworm-slim
RUN apt-get update && apt-get install -y --no-install-recommends ca-certificates \
    && rm -rf /var/lib/apt/lists/*
COPY --from=build /out/myapp /usr/local/bin/myapp
ENTRYPOINT ["/usr/local/bin/myapp"]
The runtime image must contain root certificates. Without them, the export to SigNoz Cloud fails with a TLS error.
The build prints one line for each instrumentation that it applies. The binary behaves like the one you built before.
Step 3. Set the environment variables and run
The instrumented binary reads the standard OpenTelemetry environment variables at startup. It needs no other configuration.
export OTEL_SERVICE_NAME="<service-name>"
export OTEL_EXPORTER_OTLP_ENDPOINT="https://ingest.<region>.signoz.cloud:443"
export OTEL_EXPORTER_OTLP_HEADERS="signoz-ingestion-key=<your-ingestion-key>"
export OTEL_RESOURCE_ATTRIBUTES="service.version=<service-version>"

./myappservices:
myapp:
image: <your-image>
environment:
OTEL_SERVICE_NAME: "<service-name>"
OTEL_EXPORTER_OTLP_ENDPOINT: "https://ingest.<region>.signoz.cloud:443"
OTEL_EXPORTER_OTLP_HEADERS: "signoz-ingestion-key=<your-ingestion-key>"
OTEL_RESOURCE_ATTRIBUTES: "service.version=<service-version>"Store the ingestion key in a Secret:
kubectl create secret generic signoz-ingestion \
  --from-literal=otlp-headers="signoz-ingestion-key=<your-ingestion-key>"
Add the environment variables to your Deployment:
    spec:
      containers:
        - name: myapp
          image: <your-image>
          env:
            - name: OTEL_SERVICE_NAME
              value: "<service-name>"
            - name: OTEL_EXPORTER_OTLP_ENDPOINT
              value: "https://ingest.<region>.signoz.cloud:443"
            - name: OTEL_EXPORTER_OTLP_HEADERS
              valueFrom:
                secretKeyRef:
                  name: signoz-ingestion
                  key: otlp-headers
The instrumented binary needs no extra privileges and no sidecar.
Verify these values:
<region>: Your SigNoz Cloud region.<your-ingestion-key>: Your SigNoz ingestion key.<service-name>: The name your service gets in SigNoz, for examplepayment-service.<service-version>(optional): Your release version, image tag, or git commit, for example1.4.2.
At startup the application logs these lines:
trace provider initialized with auto-export
OpenTelemetry initialized
runtime metrics enabled
Validate
Send a few requests to your application, then open SigNoz.
Open Services. Your service appears with request rate, error rate, and latency within a minute or two.
Open Traces and filter by your service name. Each request produces one server span, one client span for an outbound HTTP call, and one span for each database call.

Open one trace and select a database span. The span carries the query text, the database system, and the address of the database server.

Open Metrics and search for go.. The Go runtime metrics, such as go.goroutine.count and go.memory.used, arrive with the same service name.
Supported libraries
otelc instruments these libraries. Your application gets spans for the libraries it uses.
| Library | Spans |
|---|---|
net/http (client and server) | HTTP |
google.golang.org/grpc (client and server) | RPC |
database/sql | Database client |
github.com/gin-gonic/gin | HTTP server |
github.com/redis/go-redis/v9 | Database client |
go.mongodb.org/mongo-driver | Database client |
github.com/segmentio/kafka-go | Messaging |
github.com/aws/aws-sdk-go-v2 | AWS client |
github.com/linode/linodego/v2 | HTTP client |
k8s.io/client-go | Kubernetes resource |
github.com/openai/openai-go, github.com/anthropics/anthropic-sdk-go | GenAI |
log, log/slog, github.com/sirupsen/logrus | Trace and span ID in log records |
This table matches v1.1.0, the version this guide installs. Later releases add more libraries, so check the supported libraries for v1.1.0 against the version you install.
Turn instrumentations on or off
The binary contains every instrumentation that matched your dependencies. You can select a subset at runtime without a rebuild:
# Run only net/http and gRPC instrumentation.
OTEL_GO_ENABLED_INSTRUMENTATIONS=nethttp,grpc ./myapp

# Run everything except net/http.
OTEL_GO_DISABLED_INSTRUMENTATIONS=nethttp ./myapp
Names are lowercase. The allowlist applies first, then the denylist removes entries from it.
To control what the build puts into the binary, declare the instrumentations in an otel.instrumentation.go file. See the external configuration guide.
Troubleshooting
Still not seeing data in SigNoz? Work through Debug missing traces, logs, and metrics, which covers SDK diagnostics, Collector connectivity, and the common ingestion errors for all three signals.
The application logs x509: certificate signed by unknown authority
- Cause: The container image has no root certificates, so it cannot open a TLS connection to SigNoz Cloud.
- Fix: Install
ca-certificatesin the runtime image, or copy the certificates from the build stage. - Verify: The export errors stop and traces arrive in SigNoz.
The build succeeds but no spans arrive
- Cause: The application uses no supported library, or the build did not run through
otelc. - Fix: Check the build output for the injected instrumentations. Make sure that the command starts with
otelc go build, or thatGOFLAGScarries-toolexec=otelc toolexec. - Verify: The application logs
OpenTelemetry initializedat startup.
Spans exist but a library is missing
- Cause: The instrumentation is turned off, or the library is not supported.
- Fix: Unset
OTEL_GO_ENABLED_INSTRUMENTATIONSandOTEL_GO_DISABLED_INSTRUMENTATIONS, then compare your library against the supported list. - Verify: The missing spans appear in the trace detail view.
Spans have no Kubernetes attributes
- Cause: The application does not know its pod, namespace, or node.
- Fix: Send the data through the SigNoz Kubernetes Collector, which adds the
k8s.*attributes. You can also set them yourself with the downward API inOTEL_RESOURCE_ATTRIBUTES. - Verify: Spans carry
k8s.pod.nameandk8s.namespace.name.
Setup OpenTelemetry Collector (Optional)
Use the OpenTelemetry Collector when you need to process, filter, or route telemetry before it reaches SigNoz. Follow the Switch to Collector guide for setup instructions.
Then point the application at the Collector:
OTEL_EXPORTER_OTLP_ENDPOINT="http://<collector-host>:4318"Limitations
- The tool instruments a fixed list of libraries. Custom frameworks and your own code get no spans.
- You must rebuild and redeploy the application to add or remove instrumentation at build time.
- v1.1.0 exports traces and Go runtime metrics. It records no HTTP or database metrics, so SigNoz derives rate, error, and latency from the spans.
Next steps
- Add manual spans for your own business logic. The OpenTelemetry API works alongside the injected instrumentation.
- Create dashboards from the Go runtime metrics.
- Set up alerts on error rate and latency.
Get Help
If you need help with the steps in this topic, please reach out to us on SigNoz Community Slack. If you are a SigNoz Cloud user, please use in product chat support located at the bottom right corner of your SigNoz instance or contact us at cloud-support@signoz.io.


