Overview
This guide walks the three points where telemetry gets lost between your application and SigNoz, in order. You do not have to read all of it. Start with the interactive troubleshooter below, or follow the steps manually. Each step tells you what to check, what a healthy result looks like, and where to go next based on what you find.
- Is your application generating telemetry? Confirm the data exists before worrying about where it goes.
- Is your telemetry being exported? Enable diagnostic logging and read the exporter errors.
- Is your telemetry reaching SigNoz? Verify connectivity and the ingestion endpoint or Collector.
The steps apply to both SigNoz Cloud and Self-Hosted SigNoz. Where the two differ, the difference is called out.
Find your problem
Answer a few questions to get to the most likely cause and its fix. Select your signal at the top; the path is the same for traces, logs, and metrics.
Answer a few questions to find where your data is getting lost.
Set OTEL_TRACES_EXPORTER=console, restart your app, and exercise the code path. Do you see spans printed in your console?
This checks whether the data exists at all, before worrying about where it goes. Use OTEL_TRACES_EXPORTER=otlp,console to keep exporting to SigNoz while you look. Works for the Java, Node.js, Python, .NET, Ruby, and PHP agents; in Go, add a stdout exporter in code instead.
Prefer to see the whole decision tree at once? The flowchart below covers the same checks.
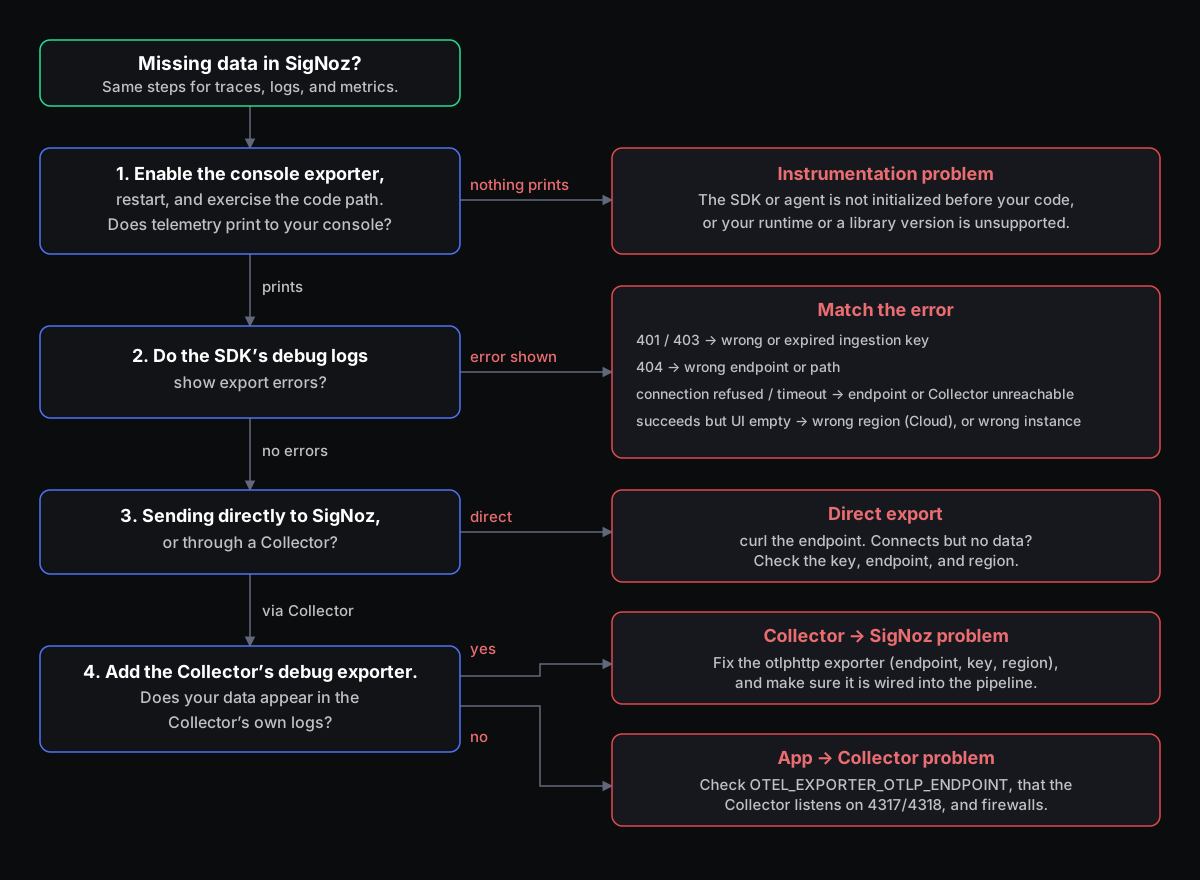
Step 1: Is your application generating telemetry?
Before checking the network, confirm the telemetry exists. Route it to your console so you can see it printed locally.
Use the console exporter
Not every SDK reads the exporter environment variables, so the setup depends on your language.
These auto-instrumentation agents read the OpenTelemetry exporter environment variables. Set the exporter to console (the current spec value, not the deprecated logging) and telemetry prints to stdout:
export OTEL_TRACES_EXPORTER=console
export OTEL_METRICS_EXPORTER=console
export OTEL_LOGS_EXPORTER=console
To keep exporting to SigNoz and print to the console, use a comma-separated list: OTEL_TRACES_EXPORTER=otlp,console.
For language-specific setup problems, see the troubleshooting section of your guide: Java, Node.js, Python, .NET, or Ruby.
PHP reads the same environment variables but also requires autoloading. Set the exporter to console and enable OTEL_PHP_AUTOLOAD_ENABLED:
export OTEL_PHP_AUTOLOAD_ENABLED=true
export OTEL_TRACES_EXPORTER=console
export OTEL_METRICS_EXPORTER=console
export OTEL_LOGS_EXPORTER=console
For PHP-specific setup problems, see PHP troubleshooting.
The Go SDK has no production-ready auto-instrumentation agent (the eBPF-based opentelemetry-go-instrumentation project is still experimental) and does not read OTEL_*_EXPORTER. Add a stdout exporter in code, either with the autoexport contrib module (which then honors OTEL_TRACES_EXPORTER=console) or by wiring stdouttrace, stdoutmetric, or stdoutlog directly.
For Go-specific setup problems, see Go troubleshooting.
Configure a console or stdout exporter as described in your language's OpenTelemetry documentation. Every SigNoz instrumentation guide also carries a troubleshooting section for its language: find yours in the instrumentation overview.
Restart your application and exercise the code path that should produce data: send a request, run the job, emit a log.
- Spans, metrics, or logs print to stdout. Your instrumentation works, so the problem is export or connectivity. Continue to Step 2.
- Nothing prints. Your application is not producing telemetry. This is an instrumentation problem, not a networking one. See When no data is generated.
When no data is generated
If nothing prints to the console, the instrumentation is not active or not supported for your setup. Check the following:
- The instrumentation is initialized. Auto-instrumentation must load before your app code runs: the Java agent via
-javaagent,opentelemetry-instrumentfor Python, or requiring the SDK first in Node.js. Follow the setup steps in your language's instrumentation guide. - Your runtime version is supported. Older runtimes such as .NET Framework 4.5, Node.js 14, or Python 3.7 may fall outside the supported range for the OpenTelemetry SDK. Check the requirements in your language's guide and in the OpenTelemetry language documentation.
- Your third-party library version is supported. Auto-instrumentation hooks into specific versions of frameworks and clients. A library that is too new or too old produces no spans. See the supported libraries lists in the OpenTelemetry docs.
- The code path ran. Confirm the request or job you expect to trace executed while instrumentation was active.
Step 2: Is your telemetry being exported?
The data exists but is not reaching SigNoz, so the exporter is either failing or misconfigured. Turn on the SDK's diagnostic logging to read the exporter's own error messages.
Set the log level to debug:
export OTEL_LOG_LEVEL=debugThe SDK prints exporter activity and any connection or authentication errors to the console. For Node.js-specific issues, see Node.js troubleshooting.
Enable the Java agent's debug logging:
export OTEL_JAVAAGENT_DEBUG=true
# or as a JVM flag: -Dotel.javaagent.debug=trueFor Java-specific issues, see Java troubleshooting.
The SDK's exporters log through Python's standard logging module, so set it to DEBUG to see their output. OTEL_PYTHON_LOG_LEVEL alone does not do this: it only takes effect when OTEL_PYTHON_LOG_CORRELATION=true is also set, and it controls log-correlation formatting, not exporter diagnostics.
For manual SDK setup, add this before your instrumentation code runs:
import logging
logging.basicConfig(level=logging.DEBUG)
For zero-code instrumentation, add the same line to the top of your entry-point script. opentelemetry-instrument initializes the SDK before your script's own code runs, so this will not catch an error during that initial setup, but it is in place before the exporter's later export attempts, which is what surfaces connection and authentication errors:
opentelemetry-instrument python your_app.pyRe-run your app and read the exporter output. See the OpenTelemetry Python configuration docs and Python troubleshooting.
The Go SDK has no debug environment variable. Export errors print to stderr by default through the built-in error handler. For more detail, set a custom logger in code:
import (
    "go.opentelemetry.io/otel"
    "github.com/go-logr/stdr"
    "log"
)

stdr.SetVerbosity(8) // stdr defaults to verbosity 0 (errors only); the SDK logs debug detail at V(8)
otel.SetLogger(stdr.New(log.Default()))
For Go-specific issues, see Go troubleshooting.
Set the log level to debug before starting the instrumented process:
export OTEL_LOG_LEVEL=debugThis applies to the zero-code auto-instrumentation agent. Logs are written to a default location; override it with OTEL_DOTNET_AUTO_LOG_DIRECTORY. For .NET-specific issues, see .NET troubleshooting.
Enable the SDK's internal (self-diagnostic) logging as described in your language's OpenTelemetry documentation, then re-run your application and read the exporter output. Language-specific issues are covered in the troubleshooting section of each guide, including Ruby, PHP, and Rust.
Restart the app with diagnostic logging on and read the output:
- An export error appears. The exporter is trying and failing. Match the error in Quick debug to correct the endpoint, region, or key.
- No errors, exports appear to succeed. The data leaves your application cleanly. Continue to Step 3.
Step 3: Is your telemetry reaching SigNoz?
How you verify this depends on your topology.
If you export directly to SigNoz
Test that the endpoint is reachable from the machine running your application.
curl -v https://ingest.<region>.signoz.cloud:443<region> is the region shown under Settings → Ingestion in the SigNoz UI. SigNoz Cloud serves both OTLP/gRPC and OTLP/HTTP on port 443. See the ingestion overview.
curl -v http://<signoz-host>:4318Self-Hosted SigNoz listens on 4317 for OTLP/gRPC and 4318 for OTLP/HTTP, and requires no ingestion key by default. <signoz-host> is the host or Service DNS name of your SigNoz OTLP endpoint. See self-hosted ingestion.
- The connection fails. A firewall or network policy is blocking outbound access to the endpoint.
- The connection succeeds but data still does not appear. The endpoint, region, or key is wrong. See Quick debug, or the Ingestion Troubleshooting guide for the full catalog of ingestion status codes.
If you use an OpenTelemetry Collector
Two links need verifying: application → Collector, and Collector → SigNoz.
Verify data inside the Collector
This debug exporter is a Collector pipeline component, different from the SDK's OTEL_LOG_LEVEL=debug in Step 2: Step 2 shows whether your application is exporting, while this shows what the Collector receives. Add it to the relevant pipeline in your existing otel-collector-config.yaml rather than replacing the whole file:
receivers:
  otlp:                                                # data coming IN from your app
    protocols:
      grpc:
        endpoint: 0.0.0.0:4317                         # OTLP/gRPC: your app sends here
      http:
        endpoint: 0.0.0.0:4318                         # OTLP/HTTP: your app sends here

processors:
  batch:                                               # keep any processors your pipeline already has;

exporters:
  debug:
    verbosity: detailed
  otlphttp:                                            # data going OUT to SigNoz
    # SigNoz Cloud: port 443, with an ingestion key
    endpoint: https://ingest.<region>.signoz.cloud:443
    headers:
      signoz-ingestion-key: <your-ingestion-key>
    # Self-hosted SigNoz: port 4318, no key by default
    # endpoint: http://<signoz-host>:4318

# The service section wires components into pipelines.
# REQUIRED: a receiver, processor, or exporter does nothing until it is listed here.
# Keep your pipeline's existing receivers and processors; just add debug to exporters.
service:
  pipelines:
    traces:
      receivers: [otlp]
      processors: [batch]
      exporters: [debug, otlphttp]
    logs:
      receivers: [otlp]
      processors: [batch]
      exporters: [debug, otlphttp]
    metrics:
      receivers: [otlp]
      processors: [batch]
      exporters: [debug, otlphttp]
Verify these values:
<region>: Your SigNoz Cloud region.<your-ingestion-key>: Your SigNoz ingestion key.
The Collector's two sides use different ports, which is where most setups go wrong:
- Receivers (
otlp) are the ports the Collector listens on for data from your application:4317for OTLP/gRPC and4318for OTLP/HTTP. Point your app'sOTEL_EXPORTER_OTLP_ENDPOINTat these, for examplehttp://<collector-host>:4318. - Exporters (
otlphttp) are where the Collector sends data onward:https://ingest.<region>.signoz.cloud:443for SigNoz Cloud, orhttp://<signoz-host>:4318for Self-Hosted SigNoz.
Port 443 appears only on the exporter side for SigNoz Cloud. Ports 4317 and 4318 are used by the receiver side and by Self-Hosted SigNoz.
Restart the Collector and check its logs.
- Data appears in the debug output but not in SigNoz. The Collector receives data but cannot export it. The problem is the
otlphttpexporter config: endpoint, region, or key. See Quick debug. - No data in the debug output. Data is not reaching the Collector. Check the application-to-Collector hop below.
Reference: the debug exporter documentation and the Collector troubleshooting guide.
Verify the application can reach the Collector
Confirm the application points at the Collector:
echo $OTEL_EXPORTER_OTLP_ENDPOINT
# Expect http://localhost:4318 (OTLP/HTTP) or your Collector host and port
Confirm the Collector is listening on the OTLP ports:
netstat -tuln | grep -E '4317|4318'Ports 4317 and 4318 should be in the LISTEN state.
For Kubernetes, verify the Collector Service has endpoints:
kubectl get svc otel-collector -n observability
kubectl get endpoints otel-collector -n observabilityEnable Collector diagnostic logs
If the Collector itself is erroring, raise its internal log level to see why:
service:
  telemetry:
    logs:
      level: DEBUG
Quick debug
Open the tab that matches the error you are seeing. Errors appear in your application's console for a direct SDK export, and in the Collector's logs when you use a Collector.
No error message yet? Enable diagnostic logging with OTEL_LOG_LEVEL=debug, restart, and read the output. Step 2 has the equivalent setting for each language.
401, 403, or gRPC Unauthenticated. Your ingestion key is missing, wrong, expired, or revoked, so the endpoint rejects the request before accepting any data.
- Set the key as
signoz-ingestion-key=<your-ingestion-key>in the OTLP headers for a direct export, or under theotlphttpexporterheadersfor a Collector. - Confirm the key has not expired or been revoked under Settings → Ingestion. See ingestion keys.
- Self-Hosted SigNoz needs no ingestion key by default. A
401there points at a proxy, load balancer, or gateway in front of SigNoz.
404 Not Found. The URL is wrong. The usual causes are a trailing slash (.../v1/logs/ instead of .../v1/logs), the wrong signal path, or the wrong port.
- SigNoz Cloud:
https://ingest.<region>.signoz.cloud:443, never4317or4318. - Self-Hosted SigNoz:
http://<signoz-host>:4318for OTLP/HTTP.
connection refused, a timeout, or no such host. Nothing is listening at the address you are exporting to.
- Exporting directly: the endpoint host or port is wrong, or a firewall is blocking outbound
443(Cloud) or4318(self-hosted). - Using a Collector: it is not running or not reachable. Confirm it is listening with
netstat -tuln | grep -E '4317|4318', thatOTEL_EXPORTER_OTLP_ENDPOINTpoints at the right host (in Kubernetes, the Service DNS name such ashttp://otel-collector.observability.svc.cluster.local:4318), and that network policies and security groups allow the connection.
Exports succeed, but nothing appears in SigNoz. There is no error in your logs, yet the UI stays empty.
- On SigNoz Cloud this is almost always a wrong region: data sent to a region that does not match your account never shows up, even with a valid-looking key. Confirm
<region>under Settings → Ingestion or in the region and endpoint table. - On Self-Hosted SigNoz, confirm you are querying the same instance you are exporting to.
- On either deployment, widen the time range in the UI. Recently sent data can fall outside a narrow window.
Data arrives, then drops off or goes missing. Telemetry showed up and then stopped, or only part of it arrives.
- On SigNoz Cloud, your ingestion key may have hit its rate or volume limit and is being throttled. Review ingestion key limits and set up meter alerts to catch this before data drops.
- On Self-Hosted SigNoz, check the resource limits and disk capacity of your SigNoz and ClickHouse instances.
For the complete list of ingestion HTTP and gRPC status codes with root causes and resolutions, see the Ingestion Troubleshooting guide.
Other things that can silently drop data
These limits drop data without an obvious instrumentation error: exports are rejected or throttled after they leave your app, so nothing looks wrong on your side.
- Payload too large. SigNoz Cloud rejects payloads over 16 MB with HTTP
413. Reduce batch sizes or export intervals. Self-hosted deployments apply whatever limit your ingress or proxy sets. - Timeouts on large or slow exports. Increase the export timeout with
OTEL_EXPORTER_OTLP_TIMEOUT(in milliseconds, for exampleOTEL_EXPORTER_OTLP_TIMEOUT=30000) and enable gzip withOTEL_EXPORTER_OTLP_COMPRESSION=gzip.
See ingestion considerations for details.
How your telemetry reaches SigNoz
SigNoz ingests data only in OTLP, over gRPC or HTTP. The port depends on where you send it:
- SigNoz Cloud accepts OTLP/gRPC and OTLP/HTTP on port
443, so the endpoint is alwayshttps://ingest.<region>.signoz.cloud:443, sent with thesignoz-ingestion-keyheader. Find your region and key under Settings → Ingestion. - Self-Hosted SigNoz and OpenTelemetry Collectors use the default ports
4317(gRPC) and4318(HTTP), and need no ingestion key by default.
Anything that is not OTLP, such as Prometheus scrape output, StatsD packets, or Jaeger and Zipkin spans, must be converted to OTLP by an OpenTelemetry Collector first.
Instrumentation comes first: your SDK, zero-code agent, or added libraries are what produce the telemetry. A Collector is optional, added later to batch, enrich, or scrape non-OTLP sources. The only thing your choice changes on the app side is the export endpoint, OTEL_EXPORTER_OTLP_ENDPOINT:
- Direct to SigNoz: point it at
https://ingest.<region>.signoz.cloud:443for Cloud, orhttp://<signoz-host>:4318for self-hosted. - Through a Collector: point it at the Collector, for example
http://<collector-host>:4318. The Collector then holds the SigNoz endpoint and, on Cloud, the ingestion key. It can be a K8s-Infra chart, the OpenTelemetry Operator, a host binary, or a Docker container.


