Prerequisites
- Python 3.8 or higher
- An instance of SigNoz (either Cloud or Self-Hosted)
Send logs to SigNoz
Auto-instrumentation automatically captures logs from your Python application with trace correlation.
Step 1: Install dependencies
Install the OpenTelemetry distro and OTLP exporter:
pip install opentelemetry-distro opentelemetry-exporter-otlp
Install the instrumentation packages:
opentelemetry-bootstrap -a install
Step 2: Set environment variables
export OTEL_PYTHON_LOGGING_AUTO_INSTRUMENTATION_ENABLED=true
export OTEL_EXPORTER_OTLP_ENDPOINT="https://ingest.<region>.signoz.cloud:443"
export OTEL_EXPORTER_OTLP_HEADERS="signoz-ingestion-key=<your-ingestion-key>"
export OTEL_SERVICE_NAME="python-app"
Verify these values:
<region>: Your SigNoz Cloud region.<your-ingestion-key>: Your SigNoz ingestion key.
If using a local OTel Collector, use:
export OTEL_PYTHON_LOGGING_AUTO_INSTRUMENTATION_ENABLED=true
export OTEL_EXPORTER_OTLP_ENDPOINT="http://localhost:4317"
export OTEL_SERVICE_NAME="python-app"
Add these environment variables to your deployment manifest:
env:
  - name: OTEL_PYTHON_LOGGING_AUTO_INSTRUMENTATION_ENABLED
    value: 'true'
  - name: OTEL_EXPORTER_OTLP_ENDPOINT
    value: 'https://ingest.<region>.signoz.cloud:443'
  - name: OTEL_EXPORTER_OTLP_HEADERS
    value: 'signoz-ingestion-key=<your-ingestion-key>'
  - name: OTEL_SERVICE_NAME
    value: 'python-app'
Replace the placeholders:
<region>: Your SigNoz Cloud region.<your-ingestion-key>: Your SigNoz ingestion key.
Avoiding Duplicate Logs
If using the k8s-infra chart (which auto-collects container logs), disable log collection for this application to prevent duplicates.
Create a Dockerfile in your project root:
FROM python:3.9-slim

WORKDIR /app

# Install dependencies
RUN pip install opentelemetry-distro opentelemetry-exporter-otlp
RUN opentelemetry-bootstrap -a install

# Copy application code
COPY . .

# Set OpenTelemetry environment variables
ENV OTEL_PYTHON_LOGGING_AUTO_INSTRUMENTATION_ENABLED=true
ENV OTEL_EXPORTER_OTLP_ENDPOINT="https://ingest.<region>.signoz.cloud:443"
ENV OTEL_EXPORTER_OTLP_HEADERS="signoz-ingestion-key=<your-ingestion-key>"
ENV OTEL_SERVICE_NAME="python-app"

# Expose application port
EXPOSE 8000

# Start the application with auto-instrumentation
CMD ["opentelemetry-instrument", "python", "main.py"]
Build and run the container:
docker build -t python-app .
docker run -p 8000:8000 python-app
Replace the placeholders in the Dockerfile:
<region>: Your SigNoz Cloud region.<your-ingestion-key>: Your SigNoz ingestion key.
Set environment variables in PowerShell:
$env:OTEL_PYTHON_LOGGING_AUTO_INSTRUMENTATION_ENABLED="true"
$env:OTEL_EXPORTER_OTLP_ENDPOINT = "https://ingest.<region>.signoz.cloud:443"
$env:OTEL_EXPORTER_OTLP_HEADERS = "signoz-ingestion-key=<your-ingestion-key>"
$env:OTEL_SERVICE_NAME = "python-app"
Replace the placeholders:
<region>: Your SigNoz Cloud region.<your-ingestion-key>: Your SigNoz ingestion key.
Step 3: Run your application
Run your application with the opentelemetry-instrument wrapper:
opentelemetry-instrument python main.py
For web frameworks like FastAPI or Flask:
opentelemetry-instrument uvicorn main:app --host 0.0.0.0 --port 8000
Log Correlation
OpenTelemetry auto-instrumentation automatically injects trace_id and span_id into your logs when a tracing context is active, allowing you to correlate logs with traces in SigNoz.
By default, auto-instrumentation collects traces, metrics, and logs. To collect only logs, disable traces and metrics:
export OTEL_TRACES_EXPORTER="none"
export OTEL_METRICS_EXPORTER="none"
Use code-level instrumentation when you need fine-grained control over how logs are exported.
Step 1: Install dependencies
pip install opentelemetry-api opentelemetry-sdk opentelemetry-exporter-otlp-proto-grpc
Step 2: Set environment variables
export OTEL_EXPORTER_OTLP_ENDPOINT="https://ingest.<region>.signoz.cloud:443"
export OTEL_EXPORTER_OTLP_HEADERS="signoz-ingestion-key=<your-ingestion-key>"
export OTEL_SERVICE_NAME="python-app"
Verify these values:
<region>: Your SigNoz Cloud region.<your-ingestion-key>: Your SigNoz ingestion key.
Add these environment variables to your deployment manifest:
env:
  - name: OTEL_EXPORTER_OTLP_ENDPOINT
    value: 'https://ingest.<region>.signoz.cloud:443'
  - name: OTEL_EXPORTER_OTLP_HEADERS
    value: 'signoz-ingestion-key=<your-ingestion-key>'
  - name: OTEL_SERVICE_NAME
    value: 'python-app'
Replace the placeholders:
<region>: Your SigNoz Cloud region.<your-ingestion-key>: Your SigNoz ingestion key.
Create a Dockerfile in your project root:
FROM python:3.9-slim

WORKDIR /app

# Copy and install application dependencies
COPY requirements.txt .
RUN pip install -r requirements.txt

# Install OpenTelemetry dependencies
RUN pip install opentelemetry-api opentelemetry-sdk opentelemetry-exporter-otlp-proto-grpc

# Copy application code
COPY . .

# Set OpenTelemetry environment variables
ENV OTEL_EXPORTER_OTLP_ENDPOINT="https://ingest.<region>.signoz.cloud:443"
ENV OTEL_EXPORTER_OTLP_HEADERS="signoz-ingestion-key=<your-ingestion-key>"
ENV OTEL_SERVICE_NAME="python-app"

# Start the application
CMD ["python", "main.py"]
Build and run the container:
docker build -t python-app .
docker run python-app
Replace the placeholders in the Dockerfile:
<region>: Your SigNoz Cloud region.<your-ingestion-key>: Your SigNoz ingestion key.
Set environment variables in PowerShell:
$env:OTEL_EXPORTER_OTLP_ENDPOINT = "https://ingest.<region>.signoz.cloud:443"
$env:OTEL_EXPORTER_OTLP_HEADERS = "signoz-ingestion-key=<your-ingestion-key>"
$env:OTEL_SERVICE_NAME = "python-app"
Replace the placeholders:
<region>: Your SigNoz Cloud region.<your-ingestion-key>: Your SigNoz ingestion key.
Step 3: Configure OpenTelemetry Logger
Create a file to configure the OpenTelemetry logger with trace correlation:
import logging
from opentelemetry import trace
from opentelemetry._logs import set_logger_provider
from opentelemetry.exporter.otlp.proto.grpc._log_exporter import OTLPLogExporter
from opentelemetry.exporter.otlp.proto.grpc.trace_exporter import OTLPSpanExporter
from opentelemetry.sdk._logs import LoggerProvider, LoggingHandler
from opentelemetry.sdk._logs.export import BatchLogRecordProcessor
from opentelemetry.sdk.resources import Resource
from opentelemetry.sdk.trace import TracerProvider
from opentelemetry.sdk.trace.export import BatchSpanProcessor

# Setup resource
resource = Resource.create()

# Setup TracerProvider for trace correlation
trace_provider = TracerProvider(resource=resource)
trace.set_tracer_provider(trace_provider)
trace_provider.add_span_processor(BatchSpanProcessor(OTLPSpanExporter()))

# Configure logger provider
logger_provider = LoggerProvider(resource=resource)
set_logger_provider(logger_provider)

# Add OTLP exporter (reads endpoint/headers from environment variables)
exporter = OTLPLogExporter()
logger_provider.add_log_record_processor(BatchLogRecordProcessor(exporter))

# Attach OTel handler to Python's root logger
handler = LoggingHandler(level=logging.NOTSET, logger_provider=logger_provider)
logging.getLogger().addHandler(handler)
logging.getLogger().setLevel(logging.INFO)
Step 4: Use in your application
Import the logger configuration at the start of your application. Logs emitted within a span context are automatically correlated:
import otel_logger # Import first to configure logging
import logging
from opentelemetry import trace
logger = logging.getLogger(__name__)
tracer = trace.get_tracer(__name__)
# Logs outside spans
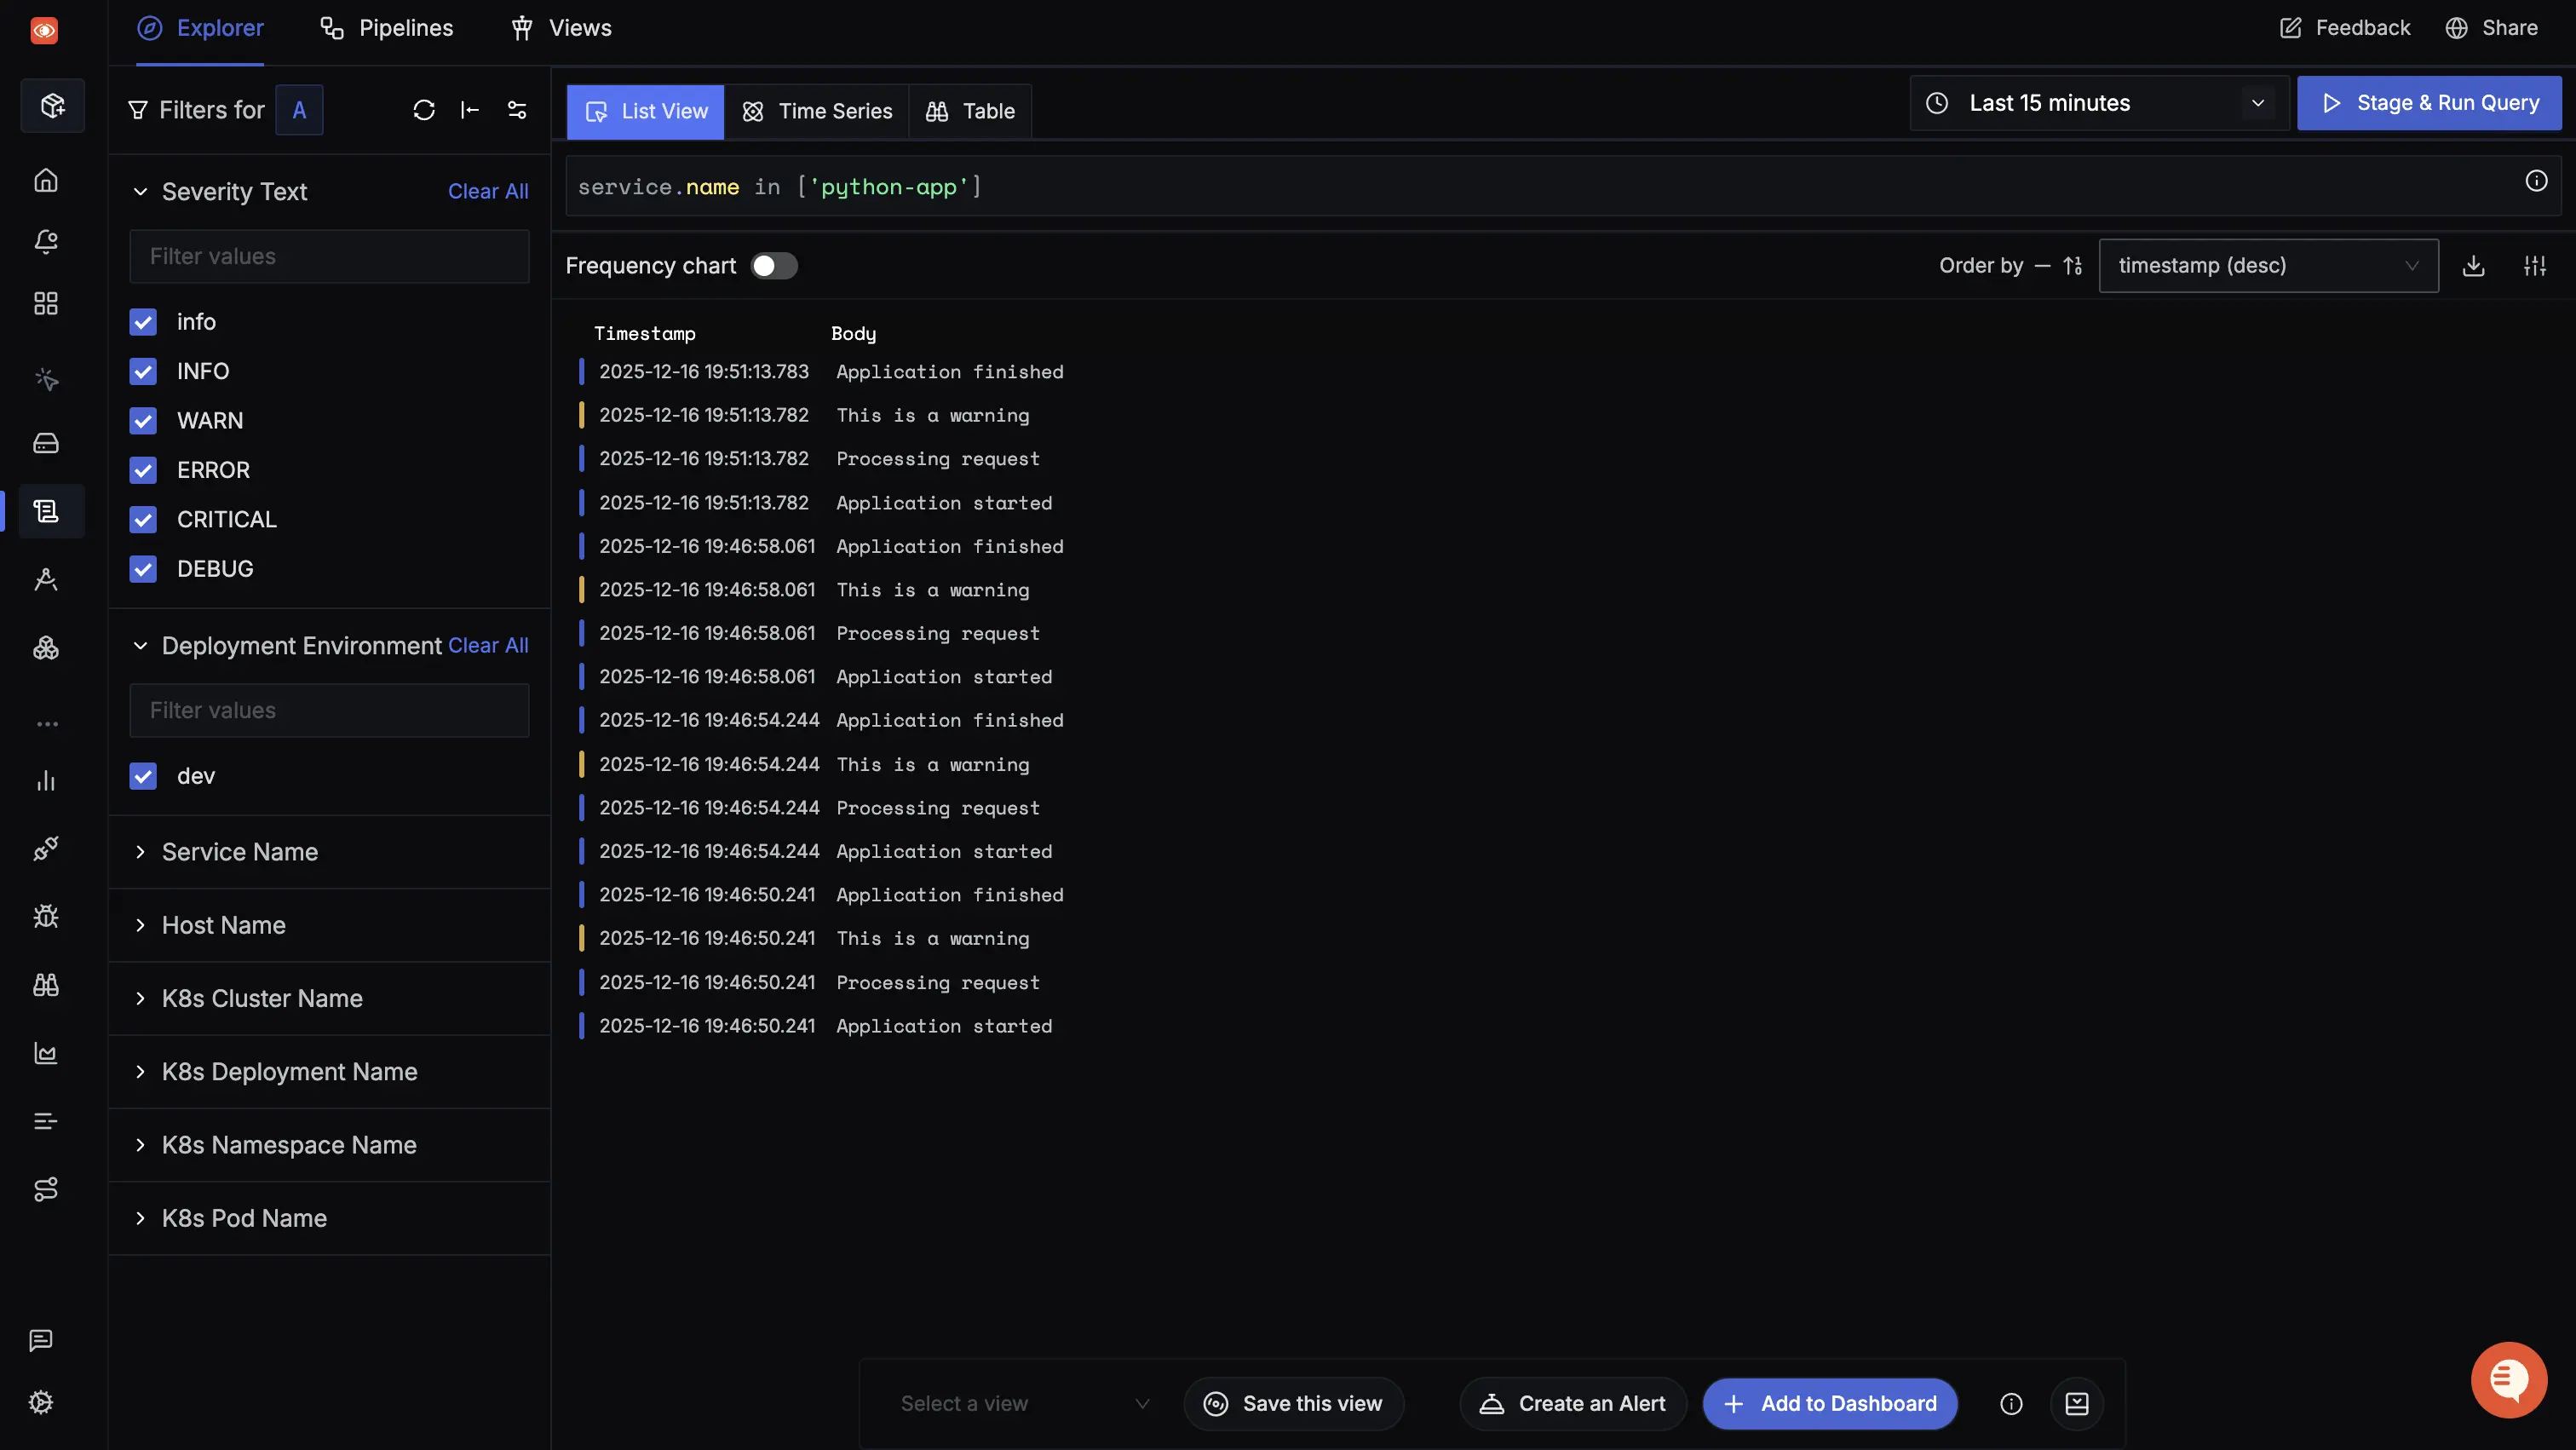
logger.info("Application started")
# Logs inside spans are automatically correlated with trace_id and span_id
with tracer.start_as_current_span("process_request"):
logger.info("Processing request") # This log is correlated with the span
logger.warning("This is a warning")
logger.info("Application finished")
Step 5: Run your application
python main.py
Validate Logs
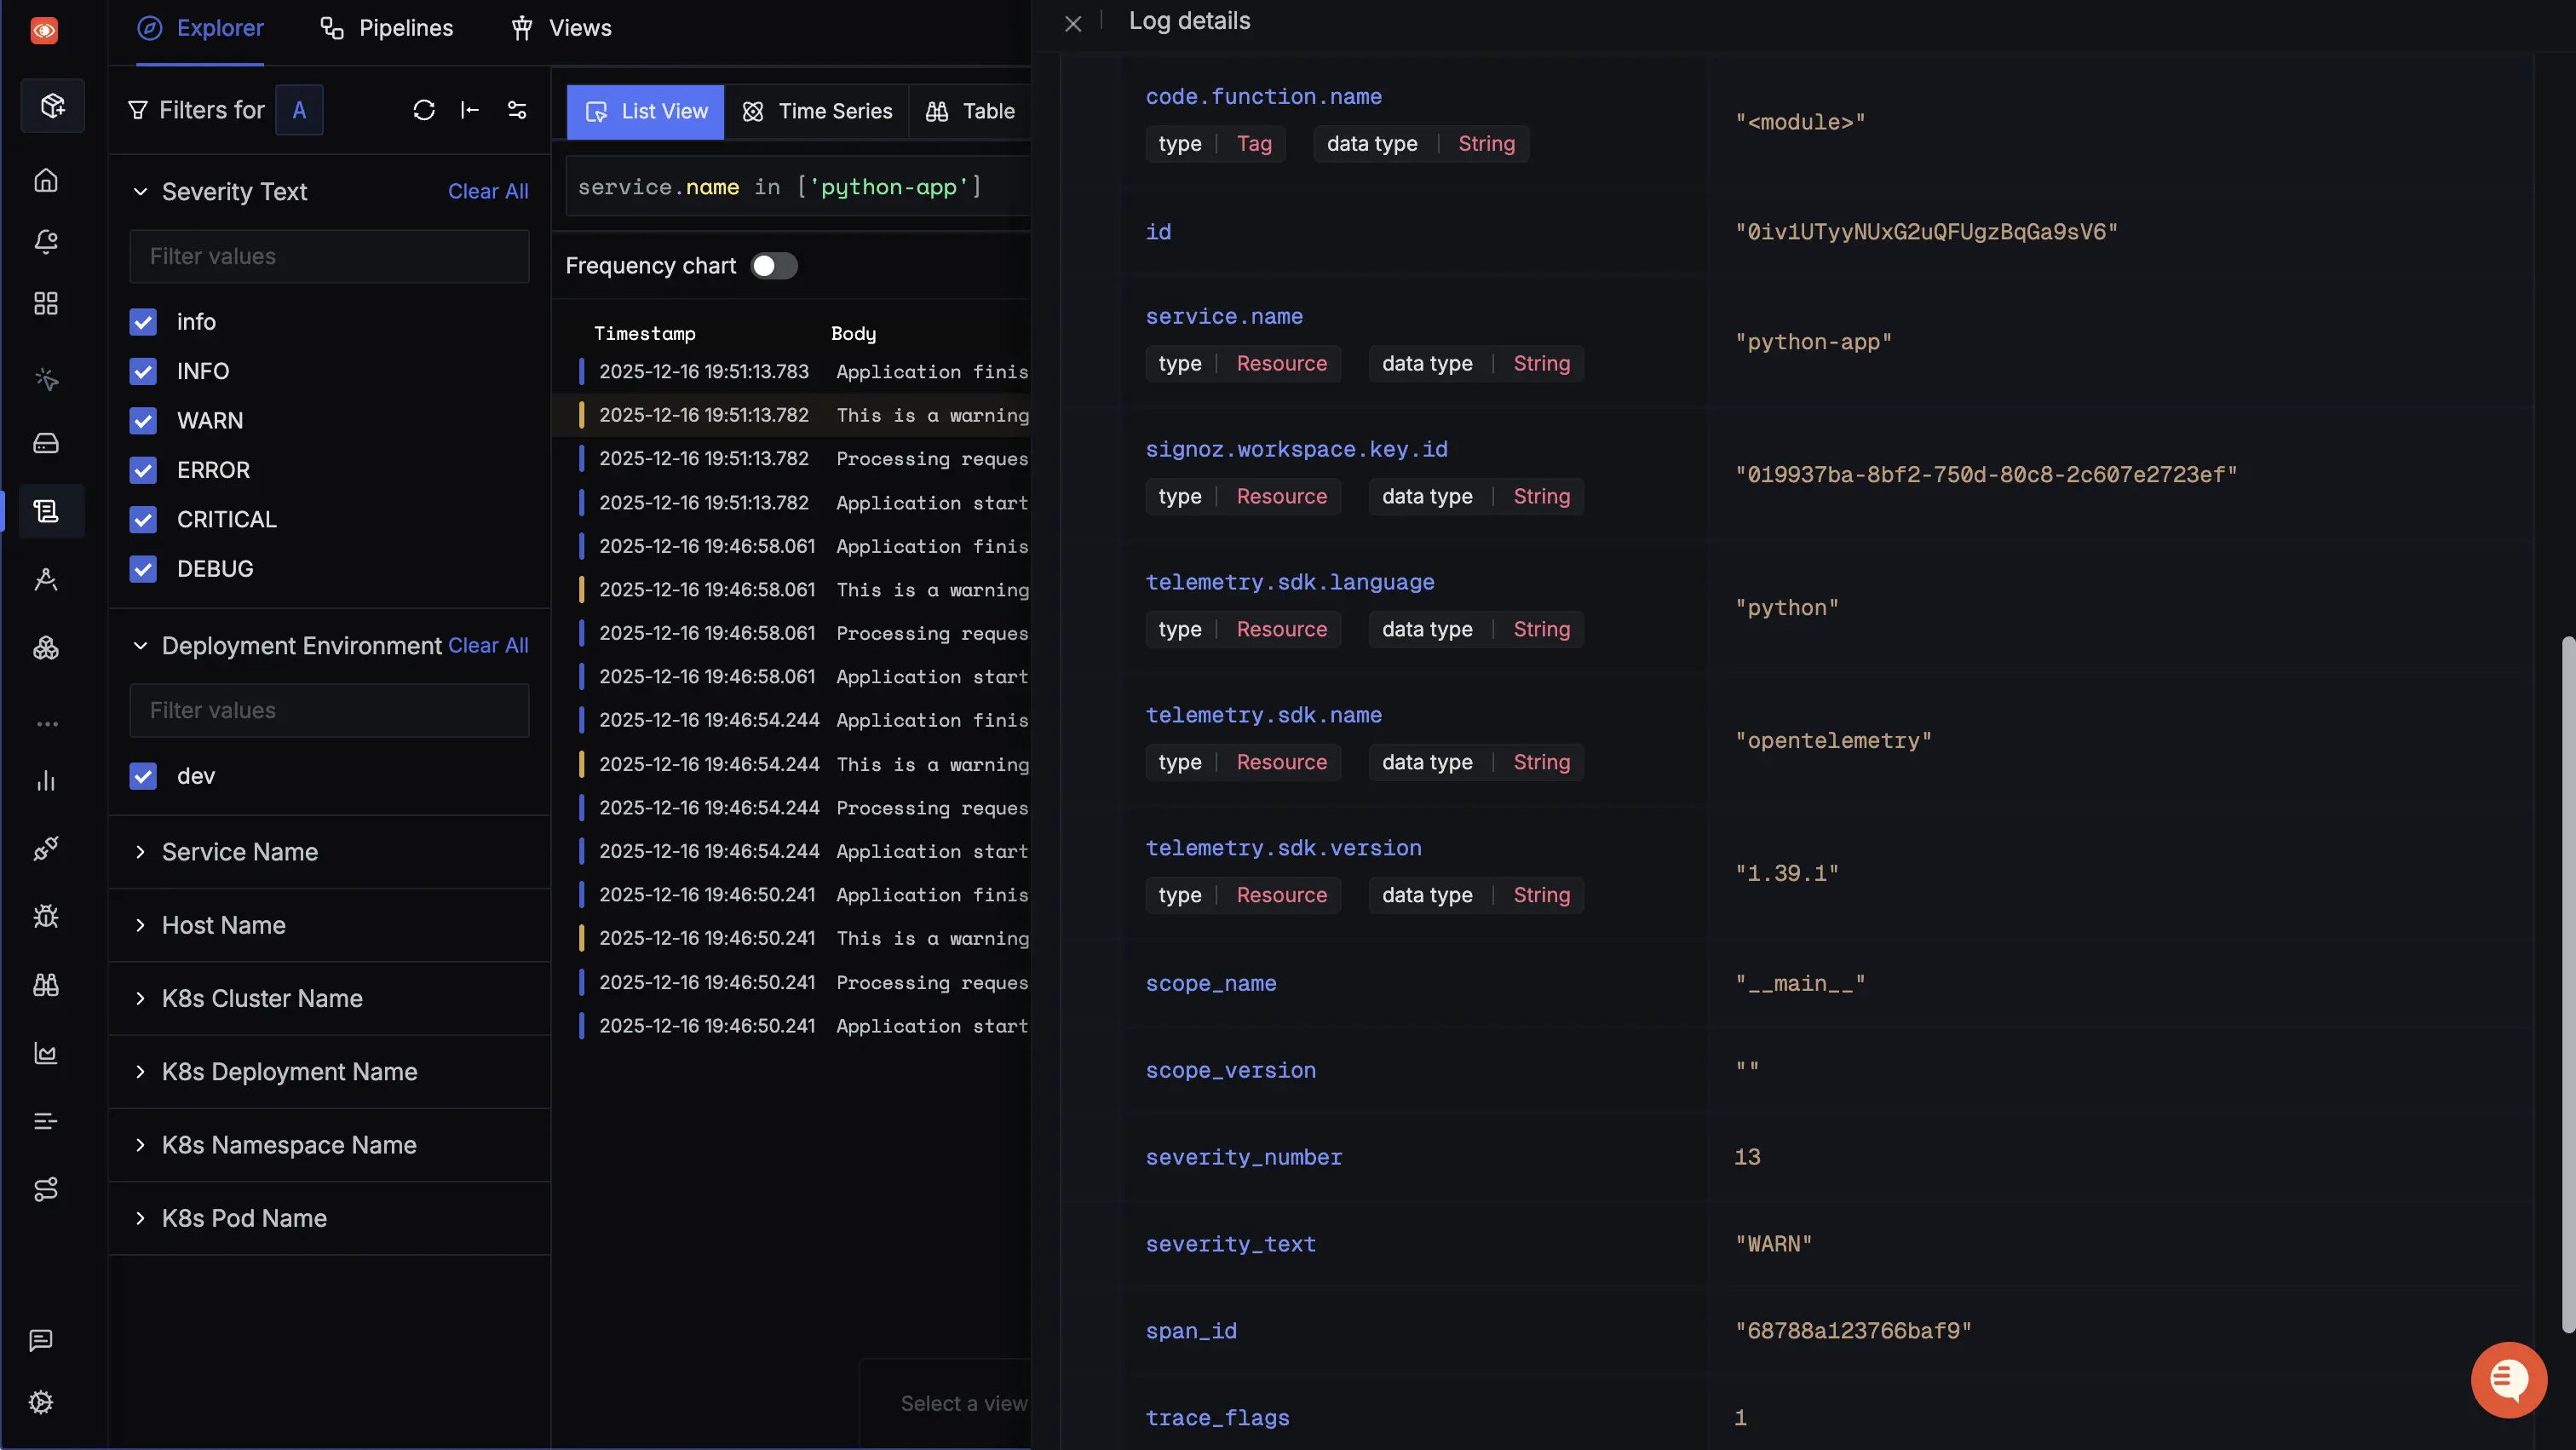
Captured logs can be viewed in the Logs Explorer section.
Setup OpenTelemetry Collector (Optional)
What is the OpenTelemetry Collector?
Think of the OTel Collector as a middleman between your app and SigNoz. Instead of your application sending data directly to SigNoz, it sends everything to the Collector first, which then forwards it along.
Why use it?
- Cleaning up data — Filter out noisy traces you don't care about, or remove sensitive info before it leaves your servers.
- Keeping your app lightweight — Let the Collector handle batching, retries, and compression instead of your application code.
- Adding context automatically — The Collector can tag your data with useful info like which Kubernetes pod or cloud region it came from.
- Future flexibility — Want to send data to multiple backends later? The Collector makes that easy without changing your app.
See Switch from direct export to Collector for step-by-step instructions to convert your setup.
For more details, see Why use the OpenTelemetry Collector? and the Collector configuration guide.
Troubleshooting
Why do I see "404 Not Found" errors?
This usually happens if the endpoint URL is incorrect.
- Cloud:
https://ingest.<region>.signoz.cloud:443 - Self-Hosted:
http://localhost:4317
Why are my logs not appearing in SigNoz?
- Check if the application started successfully and is actually generating logs.
- Verify your
<region>and<your-ingestion-key>are correct. - Ensure
OTEL_PYTHON_LOGGING_AUTO_INSTRUMENTATION_ENABLEDis set totrue(if using auto-instrumentation).
Next Steps
- Log Query/Filtering guides
- Alerts setup for logs
- Correlate logs with traces and metrics for complete observability
Get Help
If you need help with the steps in this topic, please reach out to us on SigNoz Community Slack.
If you are a SigNoz Cloud user, please use in product chat support located at the bottom right corner of your SigNoz instance or contact us at cloud-support@signoz.io.
