Enterprise Observability - Complete Guide
As you build and maintain distributed, cloud-native applications, you need clear, actionable insights into your systems’ behavior.
We'll cover what observability is (and how it differs from traditional monitoring), explore its key pillars, and outline a roadmap for implementing observability in a large organization. By the end, you’ll see how observability improves reliability, security, and performance, and you’ll have actionable steps to start or enhance an observability strategy in your enterprise.
What is Enterprise Observability?
Enterprise observability is a modern approach to understanding and managing the performance, reliability, and behavior of complex IT systems. It involves collecting, correlating, and analyzing signals—such as logs, metrics, and traces—at scale to view the system's internal states comprehensively.
Unlike traditional monitoring, which focuses on predefined metrics and thresholds, observability enables teams to investigate unknown issues and confidently perform root-cause analysis.
This practice has become essential for organizations operating in distributed and dynamic environments, such as those relying on microservices, containerized applications, or multi-cloud architectures. These setups are highly ephemeral and complex, making traditional monitoring tools insufficient for maintaining reliability and performance.
Key Pillars of Observability (MELT)
Modern observability centers on four main types of telemetry data often summarized as MELT: Metrics, Events, Logs, and Traces. Each pillar provides unique insight, and together they offer a 360° view of system behavior.
Here's why each is important:
Metrics: Numeric measurements that reflect the health and performance of systems over time. Metrics are typically aggregated (e.g. CPU usage, request rates, error counts) and are great for spotting trends or anomalies at a high level. They enable dashboards and alerts that quickly show if something is off (spikes, drops, thresholds exceeded). Metrics are the pulse of your infrastructure, helping you monitor SLAs and capacity.
Events: Discrete occurrences in the system with a timestamp, often representing state changes or significant actions. For example, a deployment, a user login, or an error notification are events. Events provide context around what happened and when, which is crucial for correlating cause and effect. In the MELT model, events fill in the story by capturing things metrics or logs might not fully contextualize (e.g. a config change right before an outage).
Logs: Immutable, timestamped records of events and messages that occur within applications and systems. Logs are highly detailed and capture the granular behavior of software – error stack traces, transaction details, debug info, etc. They answer questions like "What exactly happened?" and "In what order?". Because logs can store rich information (parameters, user IDs, etc.), they're indispensable for post-incident forensics and debugging. In an observability context, logs help drill down into issues uncovered by metrics or alerts.
Traces: Traces follow the journey of a single request or transaction through a distributed system, recording how it passes through various services and components. A trace is like a hierarchical log for one operation, showing each step (with timings) across microservices or processes. Tracing is vital for understanding dependencies and performance in modern architectures – for example, if a user action is slow, traces help pinpoint which service or database call caused the slowdown. They give a end-to-end view that is essential for debugging in microservices or serverless environments. By visualizing request flows (often as flame graphs or timelines), tracing lets teams find bottlenecks and optimize complex transactions.
While each pillar provides unique insights, their true value emerges when combined. Together, metrics, events, logs, and traces create a comprehensive framework that enables rapid detection and resolution of issues. An effective observability strategy leverages all four data types to ensure complete system visibility.
Why Traditional Monitoring Falls Short
Traditional monitoring typically focuses on a predefined set of metrics and health checks – it's great for known issues and simple architectures, but it struggles in today's complex systems. In a traditional setup, you might monitor CPU, memory, and a few app-specific metrics with static thresholds. This works for catching issues you anticipated, but what about the unknown unknowns?
Here's why traditional monitoring approaches are insufficient for modern enterprises:
Reactive vs Proactive: Monitoring is reactive, alerting when thresholds are crossed. Observability is proactive, helping explore why issues occur and catching unexpected anomalies. Monitoring asks "Is everything okay?" while observability asks "Do we understand our system's behavior?"
Predefined Metrics Only: Traditional monitoring collects only anticipated metrics, missing unexpected issues. For example, a third-party API causing cascade failures might go undetected if not explicitly monitored.
Siloed Views: Traditional tools separate logs, APM, and server metrics, making incident correlation tedious and time-consuming. Observability unifies all telemetry data for faster analysis.
Dynamic Systems Challenges: Modern enterprises with microservices, containers, and ephemeral infrastructure overwhelm traditional monitoring. The volume and volatility of data from constantly changing services exceed what static monitoring can effectively track.
While traditional monitoring is necessary, it's not sufficient for modern enterprises. It tells you that something is wrong, but observability tells you what's wrong and why. Enterprises adopting observability move from firefighting known issues to a more resilient posture where even unexpected problems can be dissected and resolved quickly.
Difference Between Monitoring and Observability
| Aspect | Monitoring | Observability |
|---|---|---|
| Definition | Tracks predefined metrics and thresholds. | Explores system behavior by exposing internal states. |
| Focus | Known issues and static thresholds. | Unknown issues and dynamic, ad-hoc analysis. |
| Key Components | Metrics and alerts. | Logs, metrics, and traces (correlated insights). |
| Approach | Reactive: Alerts on threshold breaches. | Proactive: Enables root-cause analysis and system insights. |
| Scope | Limited to detecting and alerting on predefined problems. | Provides a holistic view of the entire system. |
| Use Case | Answering "What is wrong?" | Answering "Why is it wrong?" and "How do I fix it?" |
| Tools | Typically single-purpose tools (e.g., metrics collectors). | Unified platforms combining logs, metrics, and traces. |
| Scalability | Struggles with complex, dynamic, and distributed systems. | Designed for modern, distributed architectures. |
| Example | Monitoring CPU usage exceeds 80%. | Identifying the root cause of high CPU usage in a microservice. |
Why Enterprise Observability Matters
For large organizations, observability isn’t a luxury – it’s quickly becoming a necessity. Here are key reasons enterprises are investing in observability:
Managing Growing System Complexity
Enterprises run distributed systems at scale with hundreds of microservices, hybrid environments, and globally distributed users. Observability provides a holistic view of these complex ecosystems, preventing small issues from snowballing into major incidents.
Example: When a container spins up temporarily to handle a surge in requests, observability tools capture its performance metrics and logs before it disappears.
Faster Issue Resolution & Reduced Downtime
Observability helps reduce MTTR (Mean Time to Repair) by providing rich context when failures occur. Instead of spending days reproducing issues, engineers can examine traces and logs to pinpoint root causes in minutes. Example: If an application experiences slow response times, traces can reveal whether the bottleneck is in the database query, network latency, or application code.
Cross-Team Collaboration
Observability breaks down silos by offering a single source of truth that all stakeholders can use. When an incident strikes, developers, SREs, and business analysts can look at the same dashboards to understand the impact.
Customer Experience & Business Impact
Beyond uptime, observability connects technical performance to business outcomes. Teams can prioritize issues based on business impact and demonstrate how improvements like reducing latency directly correlate with metrics such as conversion rates.
Example: Reducing latency by 100ms might directly correlate with a 5% increase in e-commerce conversions, demonstrating the tangible value of observability initiatives.
Bottom line: Enterprises need observability to maintain control and confidence in their systems as they scale. It’s about being proactive and prepared, rather than reactive and surprised. A robust observability practice means fewer outages, faster recovery when incidents do happen, and more insight to drive improvements. As one IBM report put it, “Monitoring tells you when something is wrong, while observability can tell you what’s happening, why it’s happening, and how to fix it.”. That capability is invaluable at enterprise scale.
Key Benefits of Implementing Enterprise Observability
Improved Reliability and System Resilience
Proactive Issue Detection & Resolution: Enterprise observability employs advanced anomaly detection techniques, such as machine learning (ML) algorithms or predefined thresholds, to detect irregular patterns before they escalate into system failures, reducing downtime and improving user experience.
Reduced Downtime: By correlating signals across metrics, logs, and traces, engineers can quickly identify the root cause of incidents and address them, dramatically cutting Mean Time to Repair. Instead of hours spent combing through logs, a team can use distributed tracing to pinpoint a failing service in minutes.
Higher Uptime and Consistency: With comprehensive instrumentation and monitoring, nothing goes unnoticed. This ensures systems meet or exceed their uptime targets because the observability platform is watching every critical component.
Enhanced Security and Compliance
Anomaly Detection for Security: Observability tools can spot unusual patterns that might signal security issues, such as surges in database queries (possible SQL injection) or failed login attempts followed by error spikes. This integration with security monitoring enables real-time threat detection.
Audit Trails: Comprehensive logging provides detailed audit trails crucial for compliance requirements like HIPAA, PCI, or GDPR. If an incident occurs, security teams can trace exactly what happened – which user account, what data was accessed, and which services were involved.
Better Performance and User Experience
Optimized Resource Allocation & Cost Management: Fine-grained observability metrics allow organizations to analyze resource utilization and identify inefficiencies. Example: Detecting overprovisioned Kubernetes clusters or underutilized virtual machines(VMs) can directly reduce cloud costs. By monitoring usage trends, teams can make data-driven decisions about scaling up or down, avoiding unnecessary expenditures on infrastructure. To learn more about Optimized Resource Allocation and Cost Management, check out Optimize Cloud Costs.
Performance Optimization: With detailed traces and metrics, teams can identify slow spots in the system, such as inefficient microservice calls or database queries. These insights allow developers to optimize code, adjust infrastructure, or refine configurations for better performance.
Improved Customer Experience: Reliable systems and stable performance are the cornerstones of user satisfaction. Real-time monitoring of Service Level Agreements (SLAs) and Service Level Objectives (SLOs) ensures that performance guarantees are met. Example: A retailer using observability tools to maintain consistent page load times during peak shopping seasons like Black Friday or Diwali ensures positive customer experiences.
Capacity Planning and Scaling: By analyzing metrics trends, organizations can predict when they'll need more resources and ensure systems can handle peak loads without degradation in user experience.
Business Agility and Innovation
Accelerated Innovation & Time-to-Market: Observability reduces the time teams spend diagnosing and resolving incidents, freeing up resources for innovation. Faster root-cause analysis shortens development cycles, allowing new features to be released quickly. Example: Developers identifying a database query bottleneck within minutes can implement optimizations and refocus on shipping updates.
Continuous Improvement: When developers can watch the performance of new features in production via observability dashboards, it creates a feedback loop that encourages building more efficient, user-friendly systems. This drives a culture of performance tuning where real-world behavior informs ongoing improvements.
ROI of Enterprise Observability
The financial and operational benefits of enterprise observability are tangible, making it a strategic investment for any organization:
- Reduced MTTD/MTTR: By correlating logs, metrics, and traces, observability tools help teams detect and resolve issues faster. To learn how to implement Incident Management using SigNoz, visit our guide.
- Improved Operational Efficiency: Consolidated dashboards eliminate the need for teams to juggle multiple tools, streamlining workflows and reducing context-switching. Unified platforms provide a centralized view for monitoring infrastructure, applications, and network performance.
- Lower TCO: Replacing multiple niche monitoring tools with a unified observability platform reduces licensing costs and administrative overhead.
- Customer Satisfaction & Retention: Stable and high-performing systems build trust with end-users.
Best Practices for Implementing Enterprise Observability
To maximize the benefits of enterprise observability, follow these best practices:
Establish Clear Goals & Success Metrics: Before diving into tools and implementations, it’s crucial to define what you aim to achieve with observability. Goals provide direction, and metrics help track progress. Without clear objectives, observability efforts may focus on collecting irrelevant data or setting alerts that don’t align with business priorities.
What to Do:
- Define SLOs to set measurable benchmarks for your system’s reliability. This can ensure 99.9% uptime, maintain response times below 500ms, or limit error rates to less than 1%.
- Use these metrics to configure alerts and drive decisions, focusing on what impacts users the most.
- Set error budgets, allowing teams to measure how much downtime or latency is acceptable before taking action.
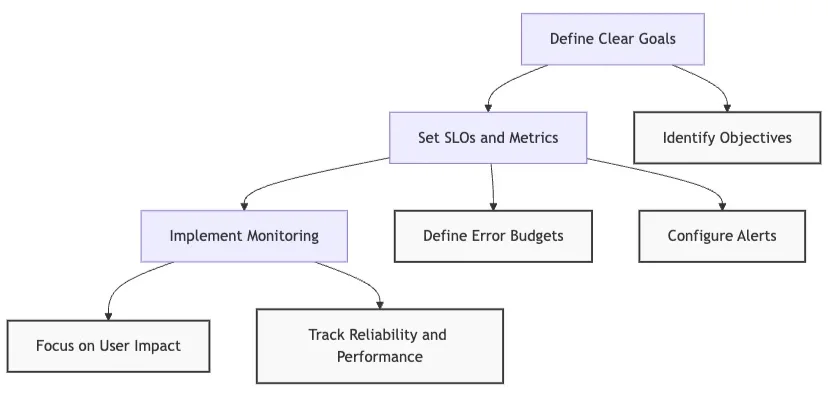
MindMap to establish and check goals Adopt a Holistic Approach: Observability should provide a complete picture of your system’s health by collecting data from all layers of the stack. Monitoring only parts of your system leaves gaps that can hide root causes during incidents.
What to Do: Instrument all layers of your system, including:
- Application code: Collect metrics like request counts, error rates, and processing times.
- Containers and orchestration: Monitor CPU, memory, and pod statuses in Kubernetes.
- Networks: Track latency, bandwidth, and packet loss.
- Databases and storage: Observe query performance and storage utilization.
- Standardize data: Ensure uniformity across all components with frameworks like OpenTelemetry.
- Implement traces, metrics, and logs: Get complete visibility into user interactions and system behavior.
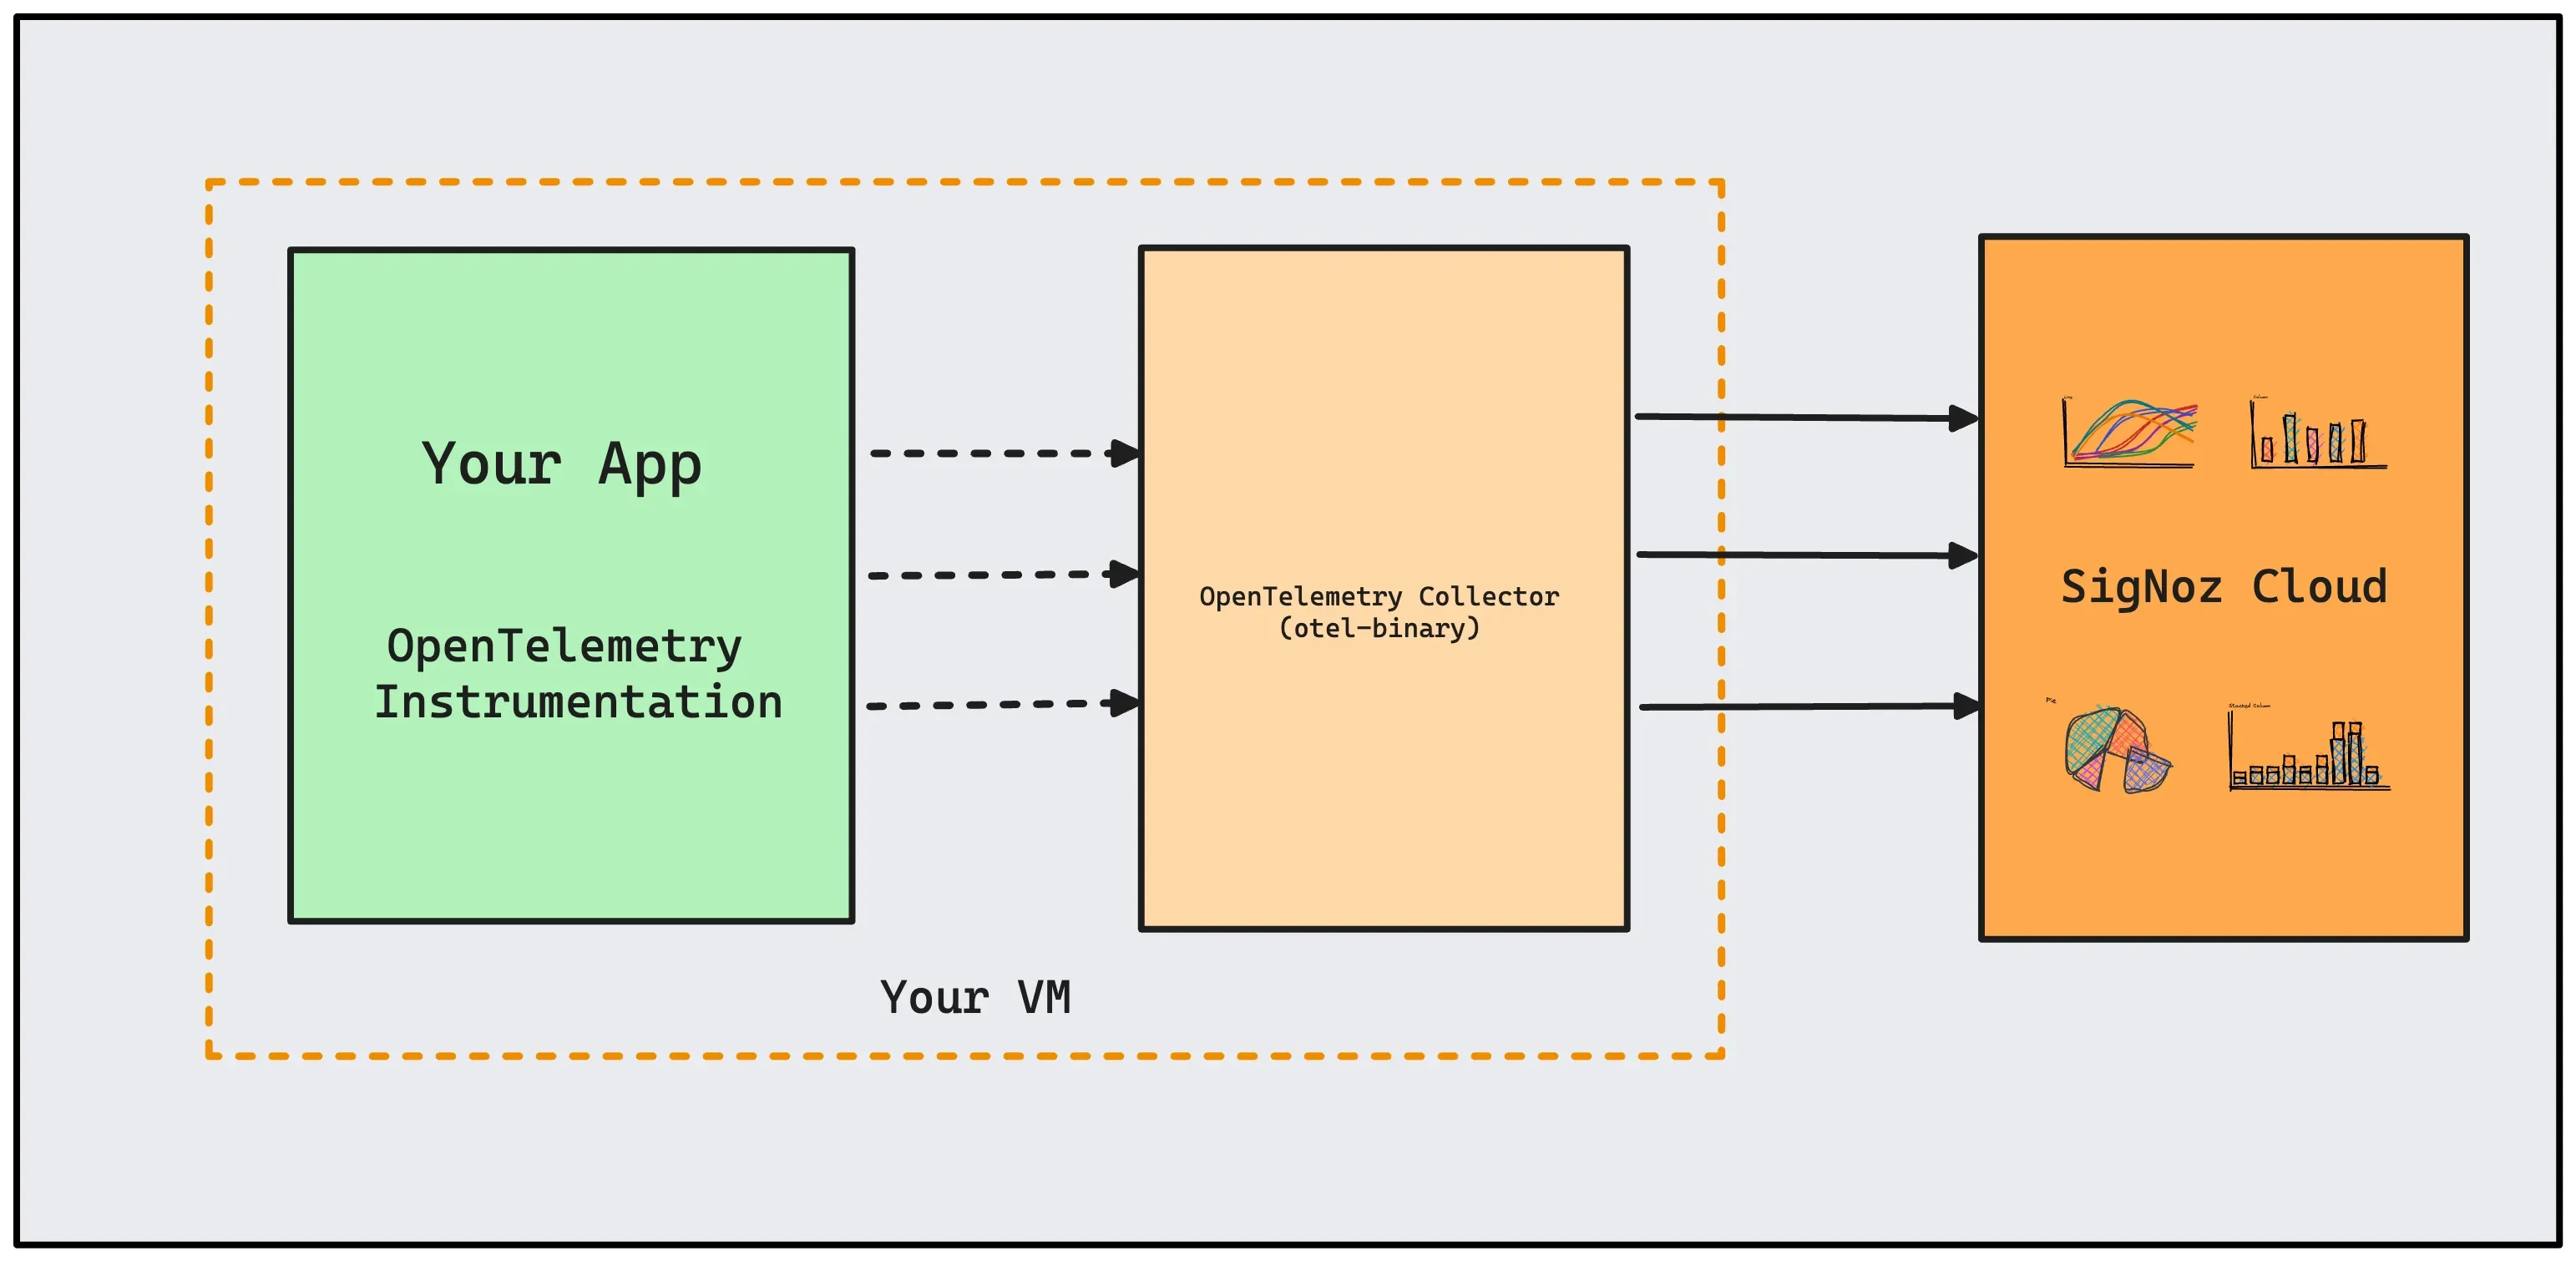
OpenTelemetry-instrumented applications in a VM can send data to otel-binary which then sends data to SigNoz cloud. Implement Data Quality Processes: High-quality data is the cornerstone of effective observability. Poorly managed telemetry can overwhelm teams with irrelevant information. Excessive, low-value data creates noise, leading to missed alerts and wasted resources.
What to Do:
- Use sampling techniques to retain only the most critical or representative data points, especially for high-traffic systems.
- Apply rate-limiting to control how often metrics or logs are ingested, preventing resource overuse.
- Implement indexing strategies for logs and traces to enable faster querying without overloading storage.
- Continuously refine data collection rules to maintain a high signal-to-noise ratio.
Example: For a web application with millions of requests per second, sampling might focus on error traces and performance outliers rather than logging every request.
Foster a Culture of Observability: Observability is not just a technical practice; it’s a mindset that must be embraced across teams. Observability only succeeds when all stakeholders—developers, operations, and management—collaborate and share responsibility for system reliability.
What to Do:
- Encourage cross-team collaboration, where dashboards and alert definitions are shared openly across Dev, Ops, and QA teams.
- Promote a “you build it, you run it” mentality from DevOps, ensuring developers are responsible for monitoring and resolving issues in their own code.
- Offer training sessions on observability tools and workflows, helping teams become proficient with query languages, instrumentation, and dashboard design.
- Foster a culture of learning with post-mortems for outages, focusing on understanding and improving rather than assigning blame.
Choosing the Right Observability Tools for Enterprise Needs
The tools you choose play a significant role in your observability strategy’s success. Keep these factors in mind to ensure your tools meet your current and future needs:
Scalability & Flexibility: Modern enterprises operate in dynamic environments where traffic patterns can shift dramatically—during sales promotions, product launches, or holiday seasons. Your observability tools must be designed to scale in tandem with your infrastructure.
Without scalability, observability tools may fail to capture or process telemetry data during high traffic surges, leading to blind spots in monitoring. Similarly, tools that lack flexibility may struggle to adapt to a multi-cloud, hybrid, or containerized ecosystem.
What to Look For:
- Tools capable of processing high-throughput data without dropping critical metrics or traces.
- Support for distributed architectures, ensuring global teams can monitor systems across multiple regions without latency.
- Real-time ingestion and querying capabilities that remain performant under heavy loads. Example: A streaming platform experiencing a spike during a live event must ensure that latency metrics, user request traces, and error logs are captured without delays, allowing teams to troubleshoot issues on the fly.
Integration Capabilities Observability is most effective when seamlessly integrated across all aspects of your tech stack. A siloed observability toolset creates gaps and inefficiencies in data collection and analysis. Enterprises typically rely on a mix of cloud providers, container orchestrators, CI/CD pipelines, and third-party services. Observability tools must work across these systems to create a unified view.
What to Look For:
Out-of-the-box support for AWS, Azure, and Google Cloud to monitor infrastructure resources such as EC2 instances, storage buckets, and managed databases.
Native integration with Kubernetes for monitoring pods, nodes, and cluster health. Ability to track build times, deployment frequencies, and failure rates, ensuring smooth releases.
Pre-built connectors for tools like Jenkins, GitHub Actions, PagerDuty, or Slack to streamline incident response and notifications. Example: A company deploying microservices on Kubernetes and using AWS for its cloud infrastructure should prioritize tools that can monitor Kubernetes clusters, EC2 instances, and S3 buckets, all within a single interface.
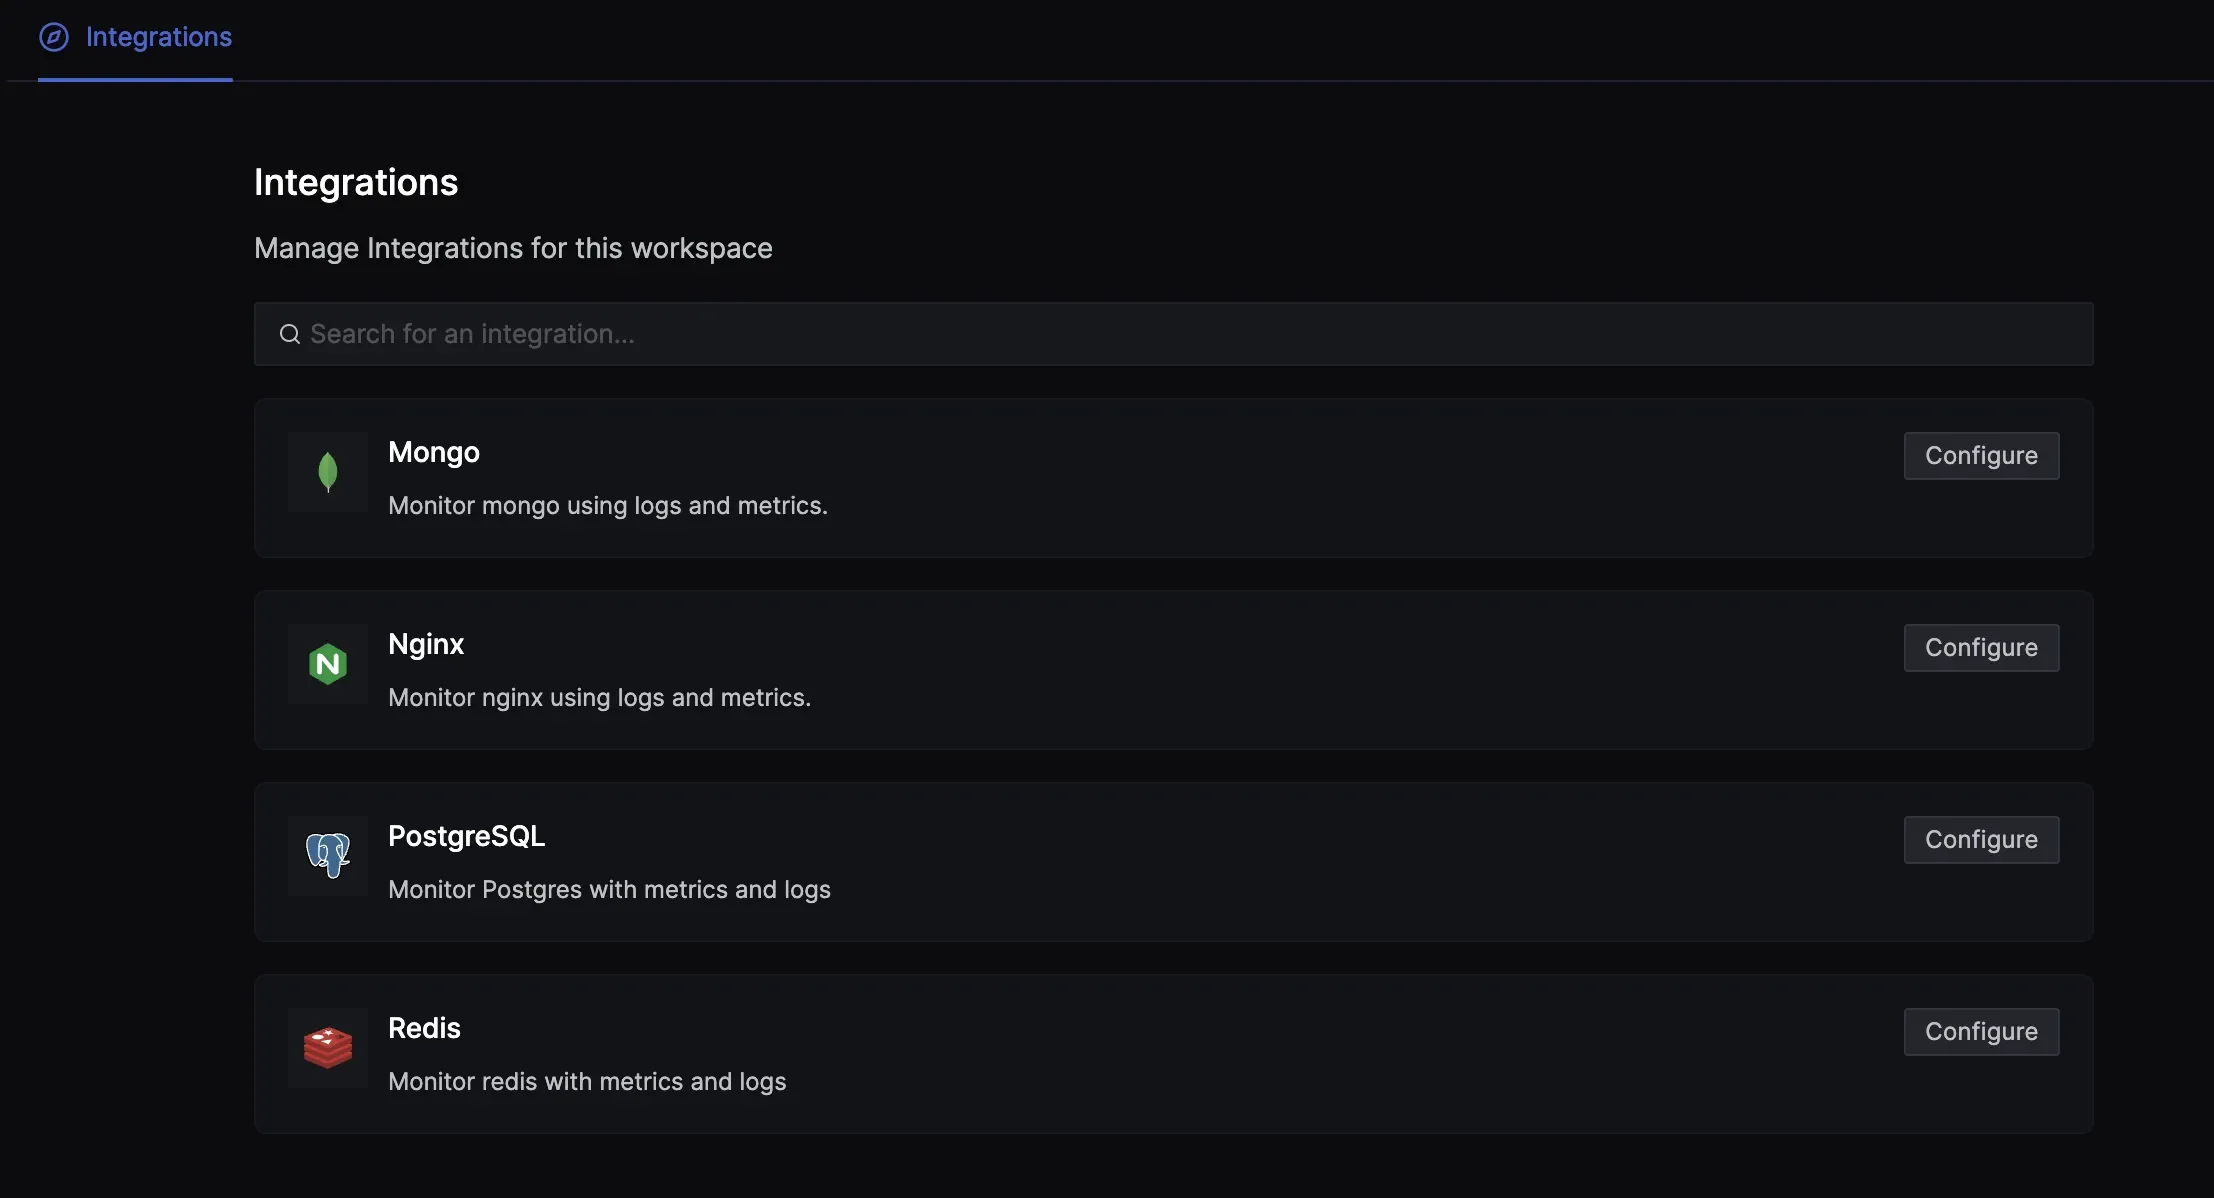
Different pre-built community integrations
User Adoption & Ease of Use Even the most powerful observability tools can fail if they are not user-friendly. For successful adoption, observability platforms must cater to both technical and non-technical users. Observability is not just for engineers; product managers, customer support teams, and executives can also benefit from insights. Tools that are overly complex risk alienating users and limiting adoption across teams.
What to Look For:
- Pre-configured and customizable dashboards allow users to visualize data without steep learning curves. Tools like PromQL or SQL-like interfaces allow advanced users to create specific, meaningful queries.
- Shared dashboards, annotations, and incident timelines that promote cross-functional collaboration.
- For non-technical users, features like drag-and-drop visualization builders are essential. A DevOps engineer may use PromQL to create a detailed latency graph, while a product manager might rely on high-level dashboards showing error rates and uptime trends over the past quarter.
Data Retention & Storage Optimization Efficiently managing telemetry data is a critical challenge for enterprises, especially when dealing with long-term storage or sensitive data. Observability tools must strike a balance between cost, performance, and compliance. Storing all observability data indefinitely is neither practical nor cost-effective. Enterprises also need to ensure compliance with regulations like GDPR, HIPAA, or CCPA when handling user data.
What to Look For:
Support for cost-efficient tiers such as cold storage (e.g., S3 Glacier) for older logs and traces, while retaining high-performance storage for real-time data.
Granular control over how long different types of data (e.g., logs, metrics, traces) are retained allows organizations to prioritize critical insights.
Built-in tools for masking sensitive fields (e.g., personally identifiable information or PII), encryption, and audit logging to meet regulatory requirements.
Efficient data compression techniques to reduce storage costs and indexing strategies for faster querying. Example: A healthcare provider monitoring patient-facing applications must comply with HIPAA by ensuring all telemetry data is encrypted, securely stored, and retained only for the legally mandated duration.
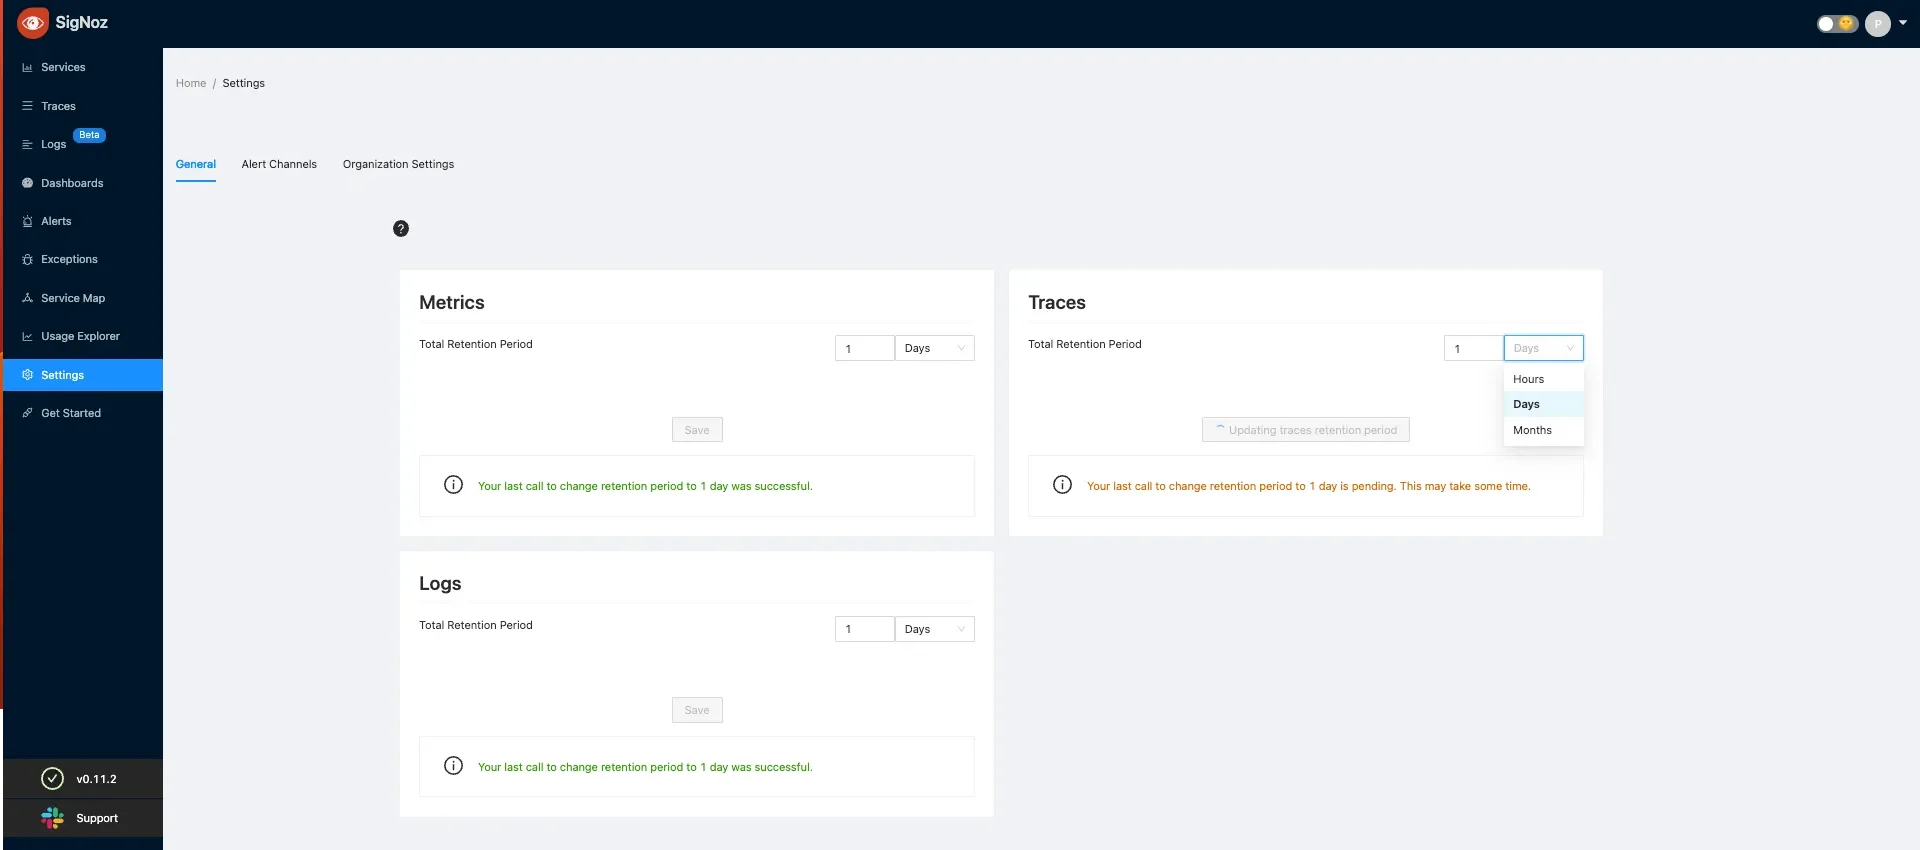
SigNoz metrics, logs and traces retention settings To learn more about the retention period in SigNoz, check out the retention period documentation.
Implementing Enterprise Observability with SigNoz
As businesses navigate the demands of today's digital landscape, ensuring the seamless performance of complex, distributed systems has never been more crucial.
Built on OpenTelemetry—the emerging industry standard for telemetry data—SigNoz integrates seamlessly with your existing Managed Prometheus setup. Using the OpenTelemetry Collector’s Prometheus receiver, SigNoz ingests Prometheus metrics and correlates them with distributed traces and logs, delivering a unified observability solution.
Key features of SigNoz include:
Distributed Tracing: SigNoz enables seamless tracing of requests across microservices, helping you pinpoint bottlenecks and optimize service interactions. By visualizing request flows, you can identify exactly where delays or failures occur in your architecture.
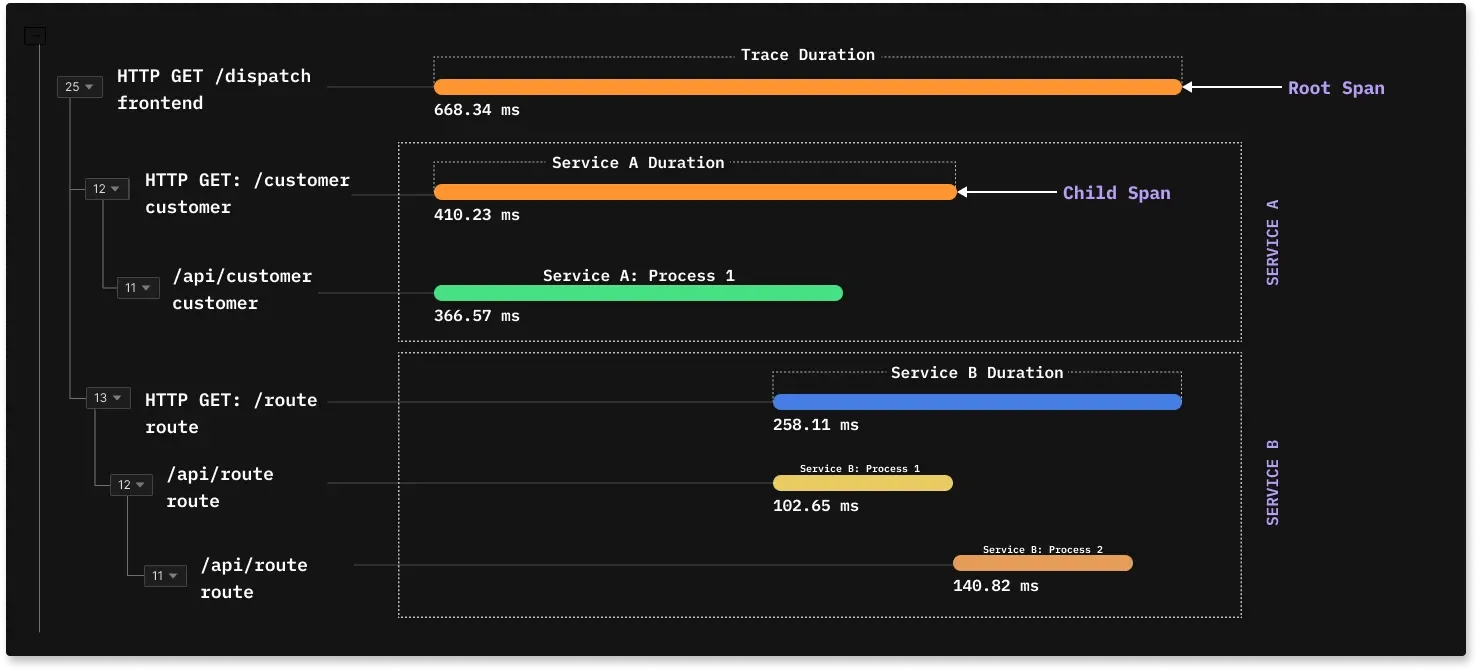
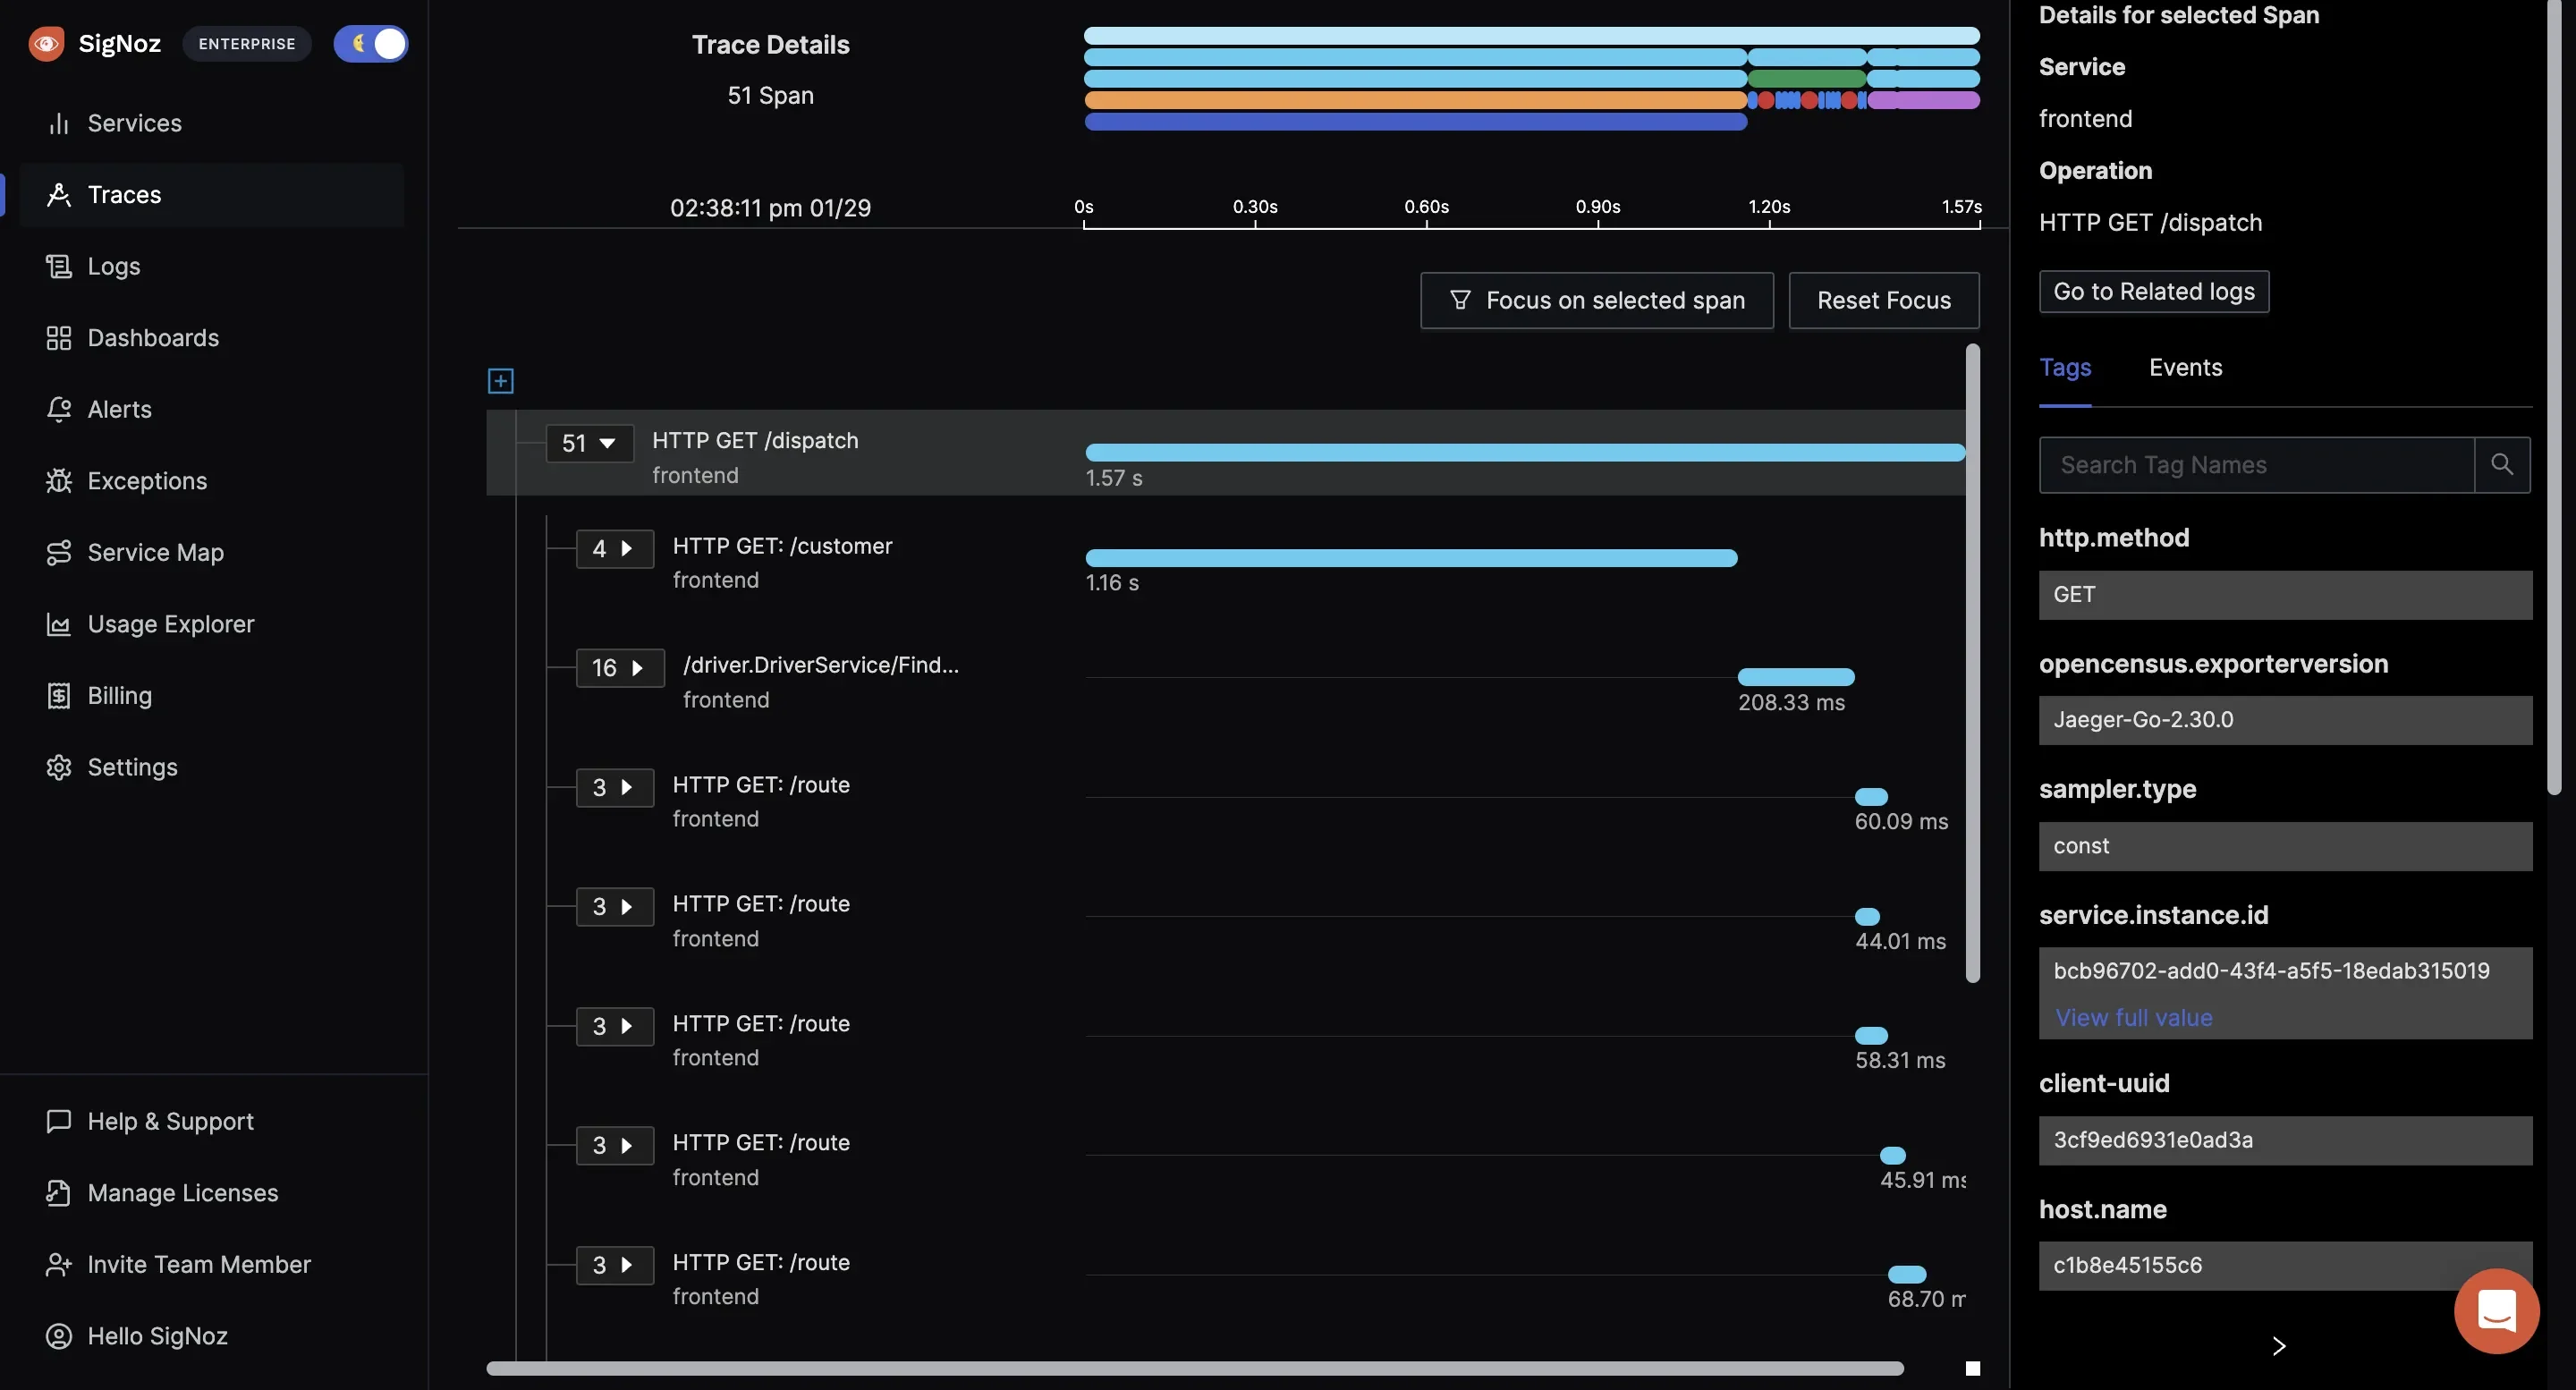
Distributed Tracing in SigNoz Log and Trace Correlation: SigNoz provides a unified view by linking specific log entries to trace spans, offering deeper insights for faster troubleshooting. This correlation allows you to drill down into trace events and analyze related logs efficiently.
Log and Trace Correlation in SigNoz Metrics Monitoring: Visualize critical performance indicators such as request rates, latencies, and system health. SigNoz's customizable dashboards make it easier to track key metrics in real-time and spot anomalies.
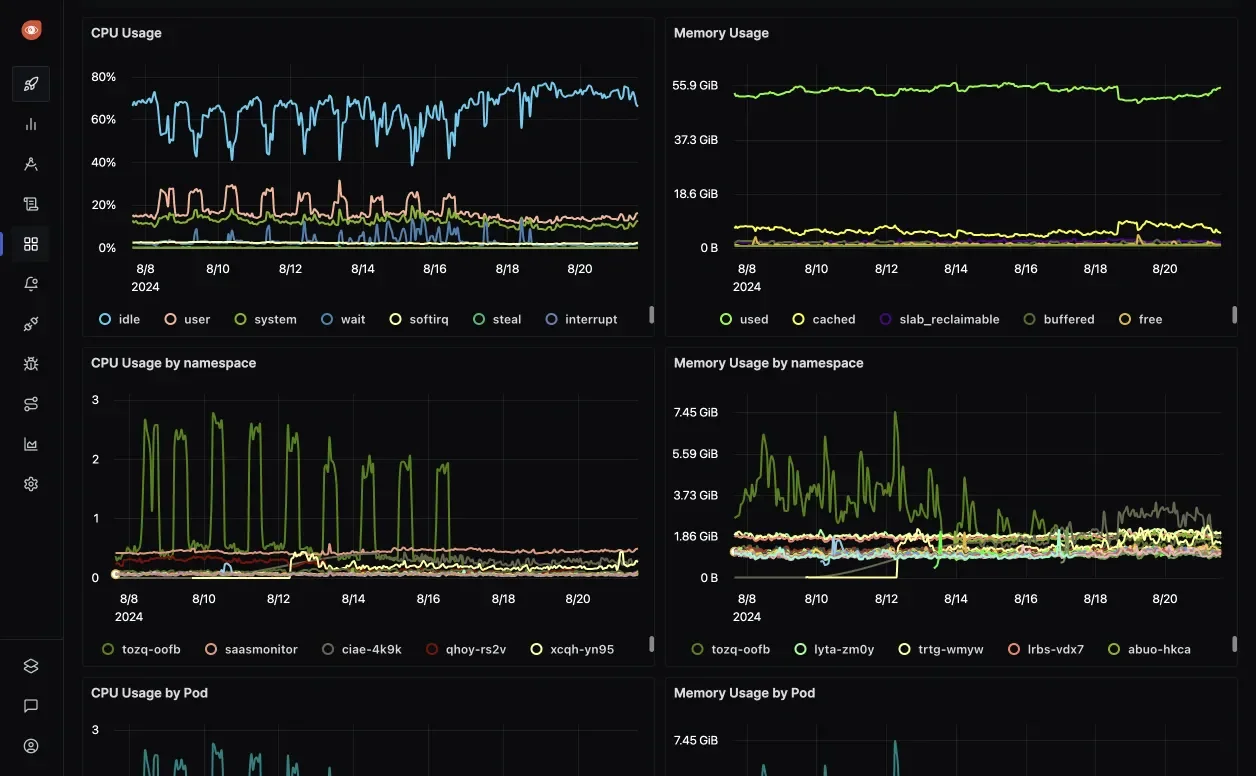
Real-time Metrics Monitoring Dashboard in SigNoz Custom Dashboards & Alerts: Build flexible dashboards to visualize application and system metrics. Set up alerts based on predefined thresholds or anomaly detection to proactively address potential issues.
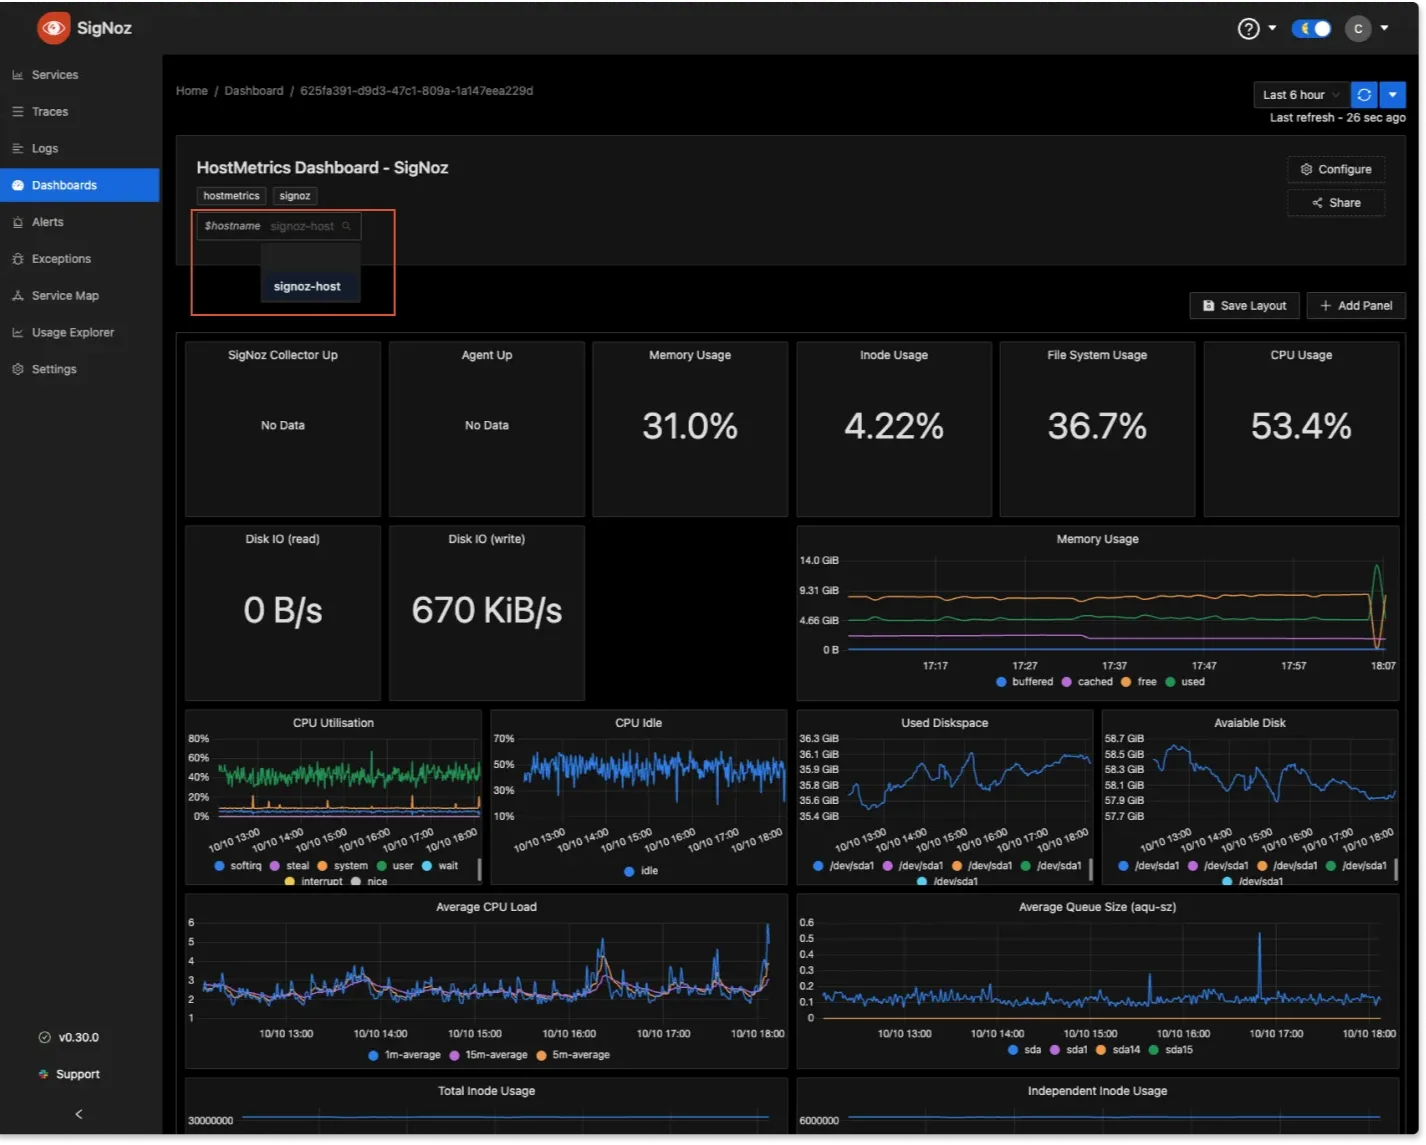
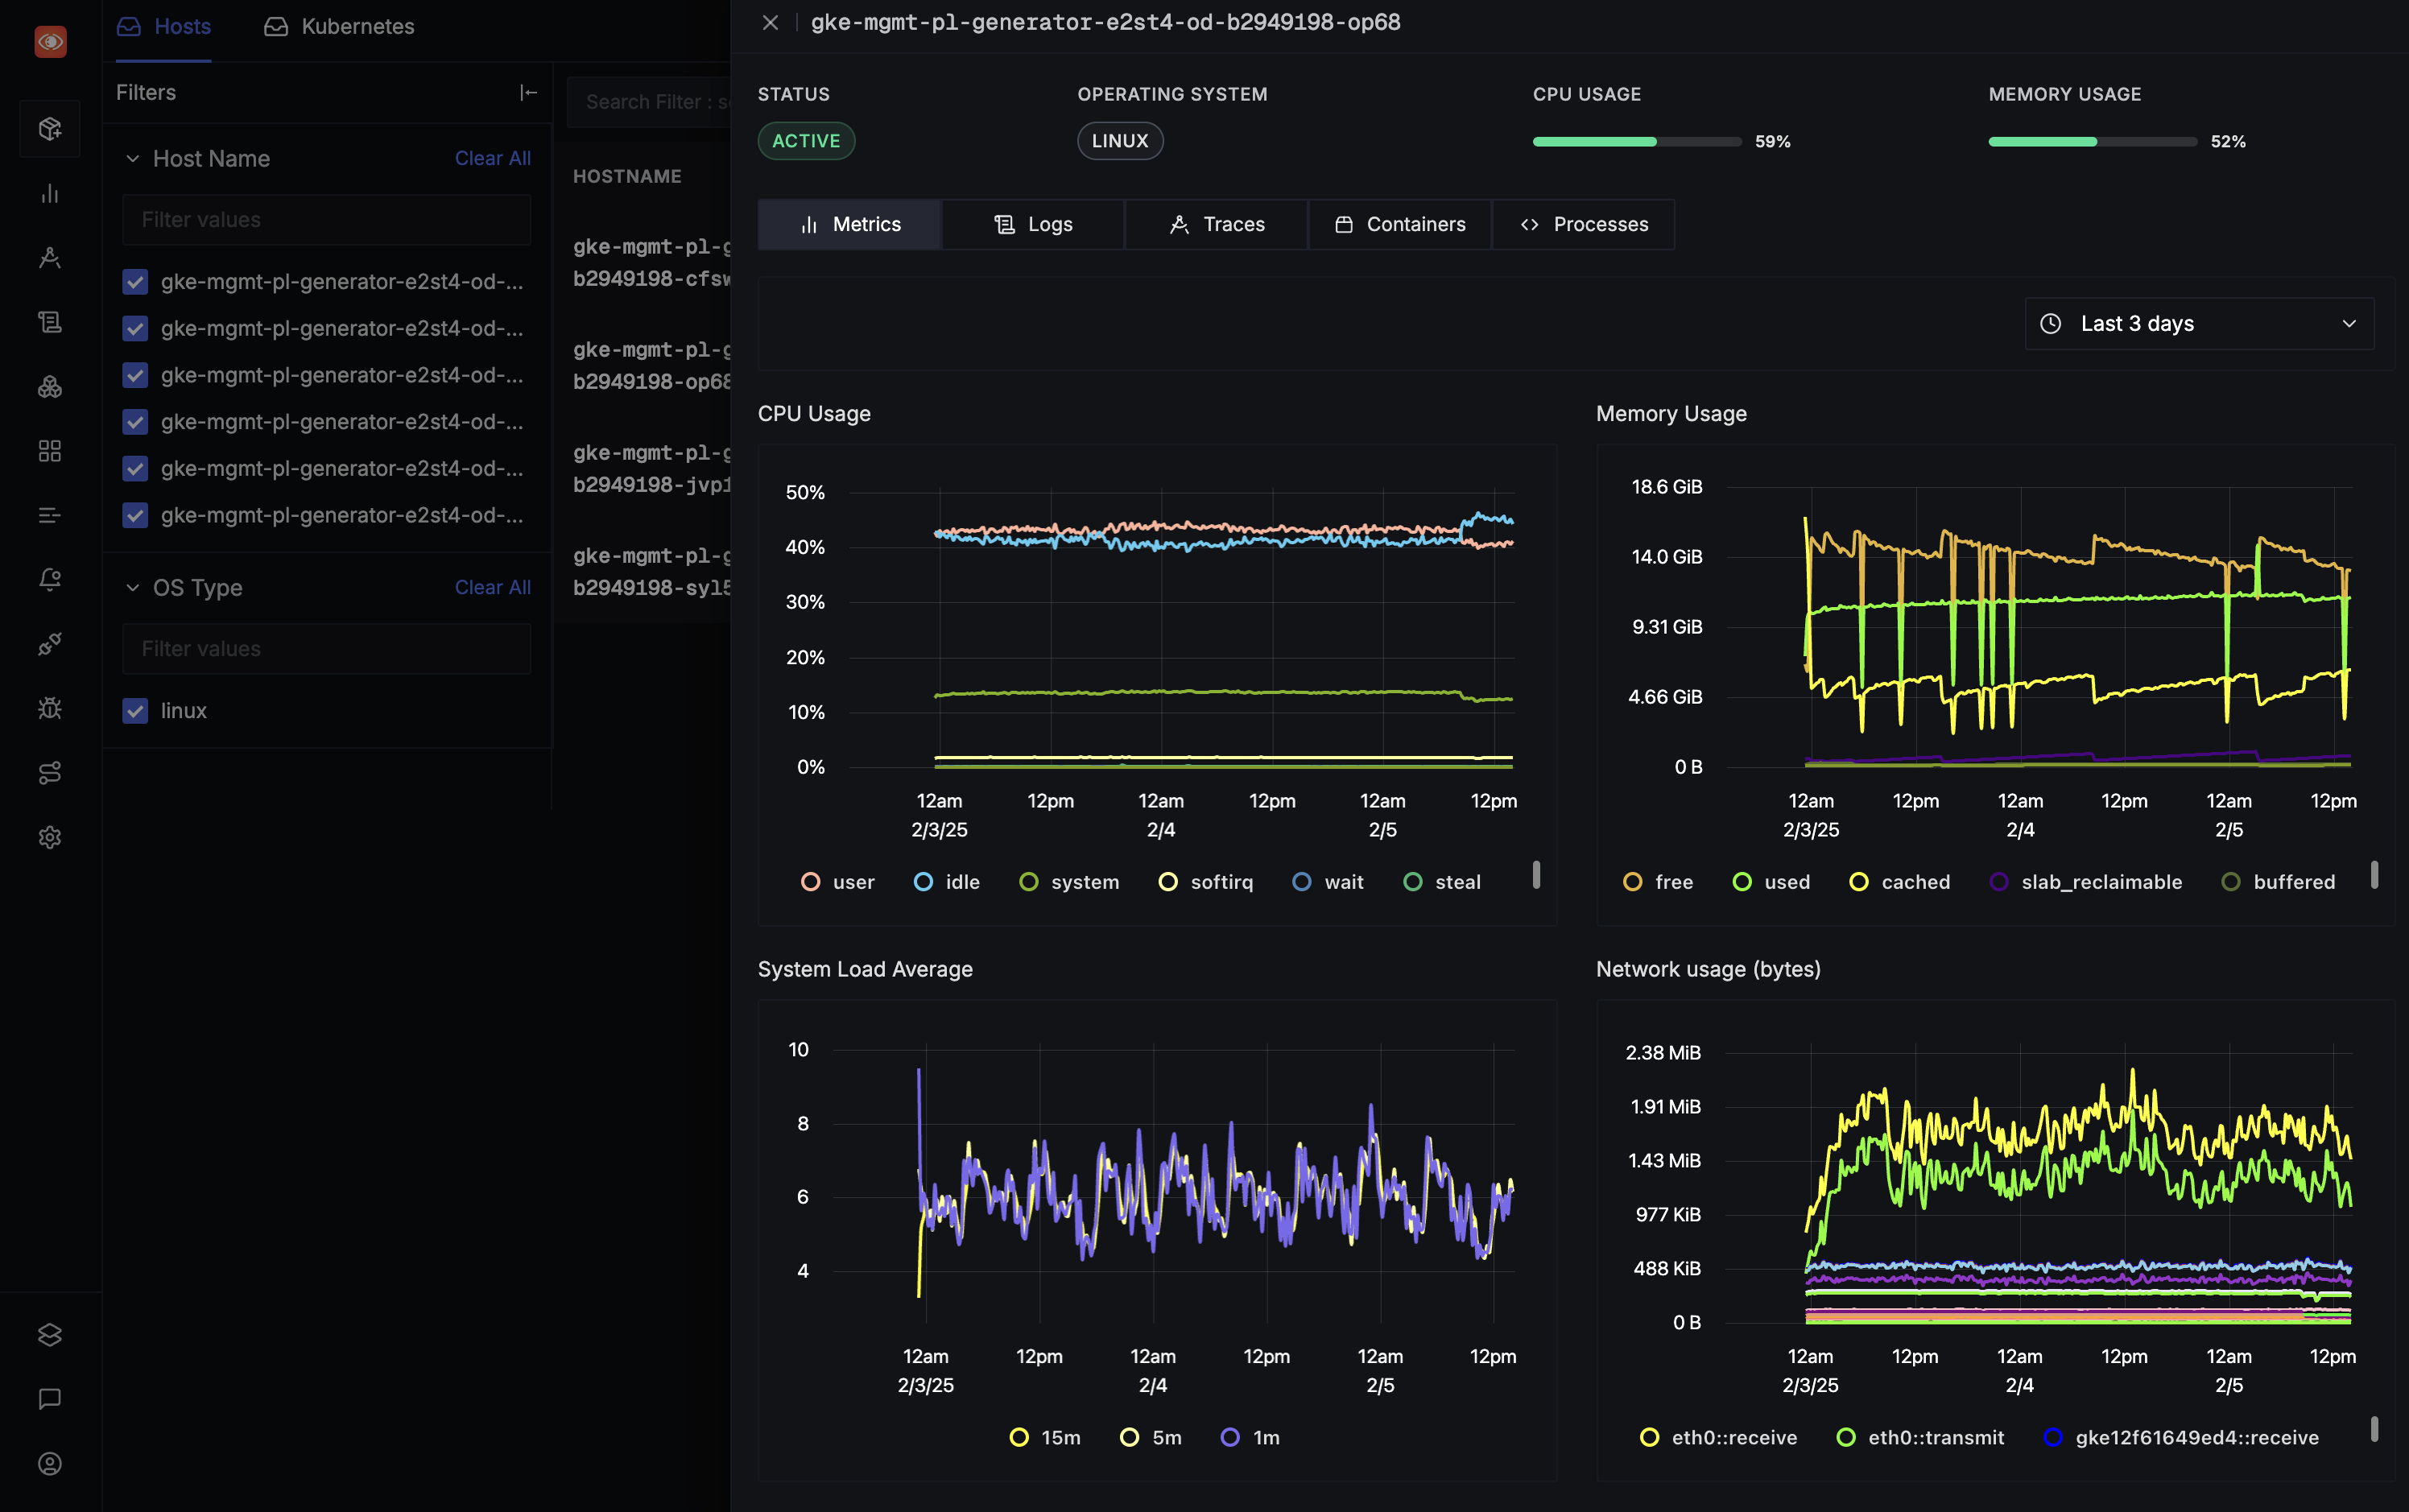
HostMetrics Dashboard Scalable Architecture: SigNoz supports both self-hosted and managed (SigNoz Cloud) deployments, making it suitable for large enterprise systems. It can scale to ingest and process large volumes of telemetry data reliably when configured appropriately.
SigNoz Cloud is the easiest way to run SigNoz. Sign up for a free account and get 30 days of unlimited access to all features.
You can also install and self-host SigNoz yourself since it is open-source. With 24,000+ GitHub stars, open-source SigNoz is loved by developers. Find the instructions to self-host SigNoz.
To unlock the full potential of SigNoz and explore its comprehensive observability capabilities, check out these articles:
SigNoz Cloud vs. Open-Source
SigNoz offers both a cloud-hosted and a self-hosted open-source version, catering to different operational needs.
- SigNoz Cloud:
- SigNoz Cloud offers a fully managed service, removing the complexity of infrastructure management.
- The cloud version is perfect for enterprises that want to focus on application performance and observability without worrying about server maintenance, scaling, or updates.
- It also comes with a simplified setup and minimal configuration, making it ideal for teams looking to quickly deploy and scale their observability infrastructure with minimal overhead.
- Open-Source Deployment:
- SigNoz’s open-source deployment offers complete autonomy over your observability stack. You maintain full control over data storage, compliance, and security, which is particularly important for organizations with stringent regulatory requirements.
- This option is highly customizable, allowing you to fine-tune configurations according to your specific needs, such as scaling with Kubernetes or integrating with your existing systems.
- Open-source deployment also provides cost-effective flexibility, particularly for organizations that already have an internal DevOps team capable of handling infrastructure setup and maintenance.
Overcoming Common Enterprise Observability Challenges
Enterprise observability is vital for modern organizations, but implementing it effectively can be fraught with challenges. By understanding these obstacles and employing strategic solutions, organizations can ensure their observability practices deliver maximum value.
- Data Overload & Alert Fatigue: In enterprise environments, telemetry data is generated in vast quantities. Without proper management, teams can become overwhelmed by an avalanche of alerts, many of which may be irrelevant or low-priority. This phenomenon, known as alert fatigue, can lead to critical issues being missed and response times increasing.
- The Challenge: Differentiating critical alerts from noise while maintaining team focus.
- Solutions:
- Implement smart sampling to capture only the most relevant data points, ensuring storage and analysis focus on actionable information.
- Leverage AI-driven anomaly detection systems that can identify unusual patterns or deviations without human intervention.
- Regularly revisit and refine alert thresholds to ensure they are aligned with SLOs and business priorities.
- Data Privacy & Compliance: As organizations collect and analyze telemetry data, safeguarding sensitive information and ensuring compliance with regulations like GDPR, CCPA, or HIPAA becomes paramount.
- The Challenge: Preventing the exposure of sensitive data while adhering to diverse regional and industry-specific compliance requirements.
- Solutions:
- Mask or redact sensitive fields during data ingestion, ensuring that Personally Identifiable Information (PII) or confidential details are not stored or processed unnecessarily.
- Establish region-specific data storage policies to comply with local regulations regarding data residency and sovereignty.
- Conduct regular compliance audits to identify and mitigate potential vulnerabilities in your observability pipeline.
- Balancing Costs & Coverage: Observability can become a financial burden if organizations attempt to collect and store all possible telemetry data without considering its relevance or utility. Striking a balance between comprehensive coverage and cost efficiency is essential.
- The Challenge: Managing the high costs of storing and analyzing vast amounts of data while ensuring critical systems are monitored in detail.
- Solutions:
- Use tiered storage strategies, such as retaining real-time metrics in high-performance databases while archiving older data in cost-efficient cold storage options like Amazon S3 Glacier.
- Adjust data resolution and collection frequencies based on the system’s criticality. For example:
- High-resolution metrics for production systems that directly impact users.
- Lower-resolution metrics for non-critical staging or development environments.
- Regularly audit data retention policies to remove obsolete or redundant data, optimizing storage costs.
- Skills Gaps & Training: Effective observability requires technical expertise in areas such as instrumentation, query languages, and dashboard design. Teams lacking these skills may struggle to unlock the full potential of their observability tools.
- The Challenge: Bridging the skills gap for teams unfamiliar with modern observability platforms and practices.
- Solutions:
- Offer onboarding and training programs tailored to new tools, covering everything from querying languages (e.g., PromQL) to visualization design.
- Create a self-service knowledge base with detailed documentation, tutorials, and FAQs to enable continuous learning.
- Foster a culture of collaboration through internal workshops and knowledge-sharing sessions, encouraging cross-team expertise.
Key Takeaways
- Enterprise observability provides critical visibility into complex distributed systems like microservices, containers, and multi-cloud environments, ensuring real-time insights through logs, metrics, and traces.
- It reduces downtime by improving MTTD and MTTR, minimizing financial and reputational risks.
- Actionable insights from observability align IT performance with business goals, enabling better decision-making and seamless user experiences.
- Defining clear SLOs ensures measurable benchmarks for system reliability and effective prioritization of issues.
- High-quality telemetry data and comprehensive instrumentation using open standards like OpenTelemetry are essential for meaningful analysis and system performance improvements.
- Observability fosters cross-team collaboration, breaking down silos between Dev, Ops, and Security teams through shared dashboards and unified data.
- Open-source observability platforms like SigNoz provide scalability, flexibility, and cost-efficiency, helping organizations avoid vendor lock-in while driving innovation and ROI.
Frequently Asked Questions
Q: What's the difference between monitoring and observability?
A: Monitoring focuses on tracking predefined metrics (e.g., CPU usage, memory) and triggering alerts when thresholds are breached. It answers the "what is wrong?" question for known issues. Observability, on the other hand, provides a deeper understanding of system behavior by collecting and analyzing logs, metrics, and traces. It allows teams to answer "why is this happening?" for unknown issues, offering insights into the internal state of systems.
Q: How does enterprise observability improve DevOps practices?
A: Enterprise observability bridges the gap between development and operations by offering a shared view of system performance. Unified dashboards and centralized data reduce the silos between teams, enabling faster troubleshooting and incident resolution. It supports DevOps principles like collaboration and ownership, fostering a "you build it, you run it" mindset and reducing inefficiencies caused by blame-shifting.
Q: What are the key considerations when selecting an observability platform?
A: Look for a platform that is scalable to handle growing data volumes, integrates well with your existing tools, and is easy to adopt without steep learning curves. Evaluate cost efficiency and ensure the platform aligns with open standards like OpenTelemetry to prevent vendor lock-in. Additionally, prioritize platforms that support AI/ML capabilities for advanced insights and automation.
Q: How can organizations measure the ROI of their observability initiatives?
A: Measure ROI by tracking operational improvements such as reduced MTTD and MTTR. Calculate infrastructure cost savings through optimized resource usage. Assess team productivity gains by evaluating the time saved in diagnosing issues. Finally, link observability outcomes to business metrics, such as increased customer satisfaction, improved retention rates, and higher revenue due to reduced downtime and enhanced user experiences.
