Top 11 Observability Tools for Modern DevOps Teams
In microservices architecture, observability tools enable you to create central dashboards to gauge the health of your distributed systems. New age observability tools have shifted to providing quick workflows to debug application issues. In this post we will explore top 11 observability tools that you can consider to use for your software systems.
Logs, metrics, traces, and alerts — one OpenTelemetry-native platform. 50+ integrations, set up in minutes.
Get Started - FreeWhat is Observability and Why It Matters for DevOps
Observability in software systems refers to the ability to understand the internal state of a system based on its external outputs. It extends beyond traditional monitoring by providing deeper insights into system behavior, allowing teams to ask questions they didn't anticipate when designing the system.
For DevOps teams, observability is crucial for several reasons:
- Rapid problem resolution: Observability tools help identify and diagnose issues quickly, reducing downtime and improving user experience.
- Proactive maintenance: By analyzing trends and patterns, teams can predict and prevent potential problems before they impact users.
- Continuous improvement: Insights from observability data drive informed decisions for system optimization and feature development.
- Enhanced collaboration: Shared visibility into system performance fosters better communication between development and operations teams.
The key components of observability include:
- Logs: Detailed records of events within the system
- Metrics: Quantitative measurements of system performance and behavior
- Traces: End-to-end tracking of requests as they flow through distributed systems
Implementing observability in DevOps workflows leads to faster deployments, improved system reliability, and more efficient resource utilization.
Understanding Observability Tools vs. Observability Platforms
Before diving into specific tools, it's important to distinguish between observability tools and platforms:
Observability Tools: These are specialized solutions focusing on specific aspects of observability, such as log analysis, metrics collection, or tracing. They often excel in their niche but may require integration with other tools for comprehensive coverage.
Observability Platforms: These offer integrated solutions combining multiple observability components (logs, metrics, and traces) in a single platform. They provide a unified view of system performance and often include advanced features like AI-driven insights and automated root cause analysis.
Advantages of standalone tools:
- Flexibility to choose best-in-class solutions for specific needs
- Often more cost-effective for smaller teams or specific use cases
- Can be easier to adopt incrementally
Benefits of integrated platforms:
- Unified data model and consistent user interface
- Simplified correlation between different observability signals
- Reduced overhead in tool management and integration
When choosing between tools and platforms, consider factors such as:
- Your team's technical expertise and resources
- The complexity of your infrastructure
- Budget constraints
- Scalability requirements
- Existing tooling and integration needs
List of Latest Top 11 observability tools in 2024:
- SigNoz (open-source)
- Dynatrace
- Grafana Labs
- Honeycomb
- New Relic
- Datadog
- Splunk
- Instana
- Appdynamics
- Elastic APM
- Zipkin (open-source)
Top 11 Observability Tools in 2024
Now let's explore the top observability tools in 2024.
SigNoz (Open-Source)

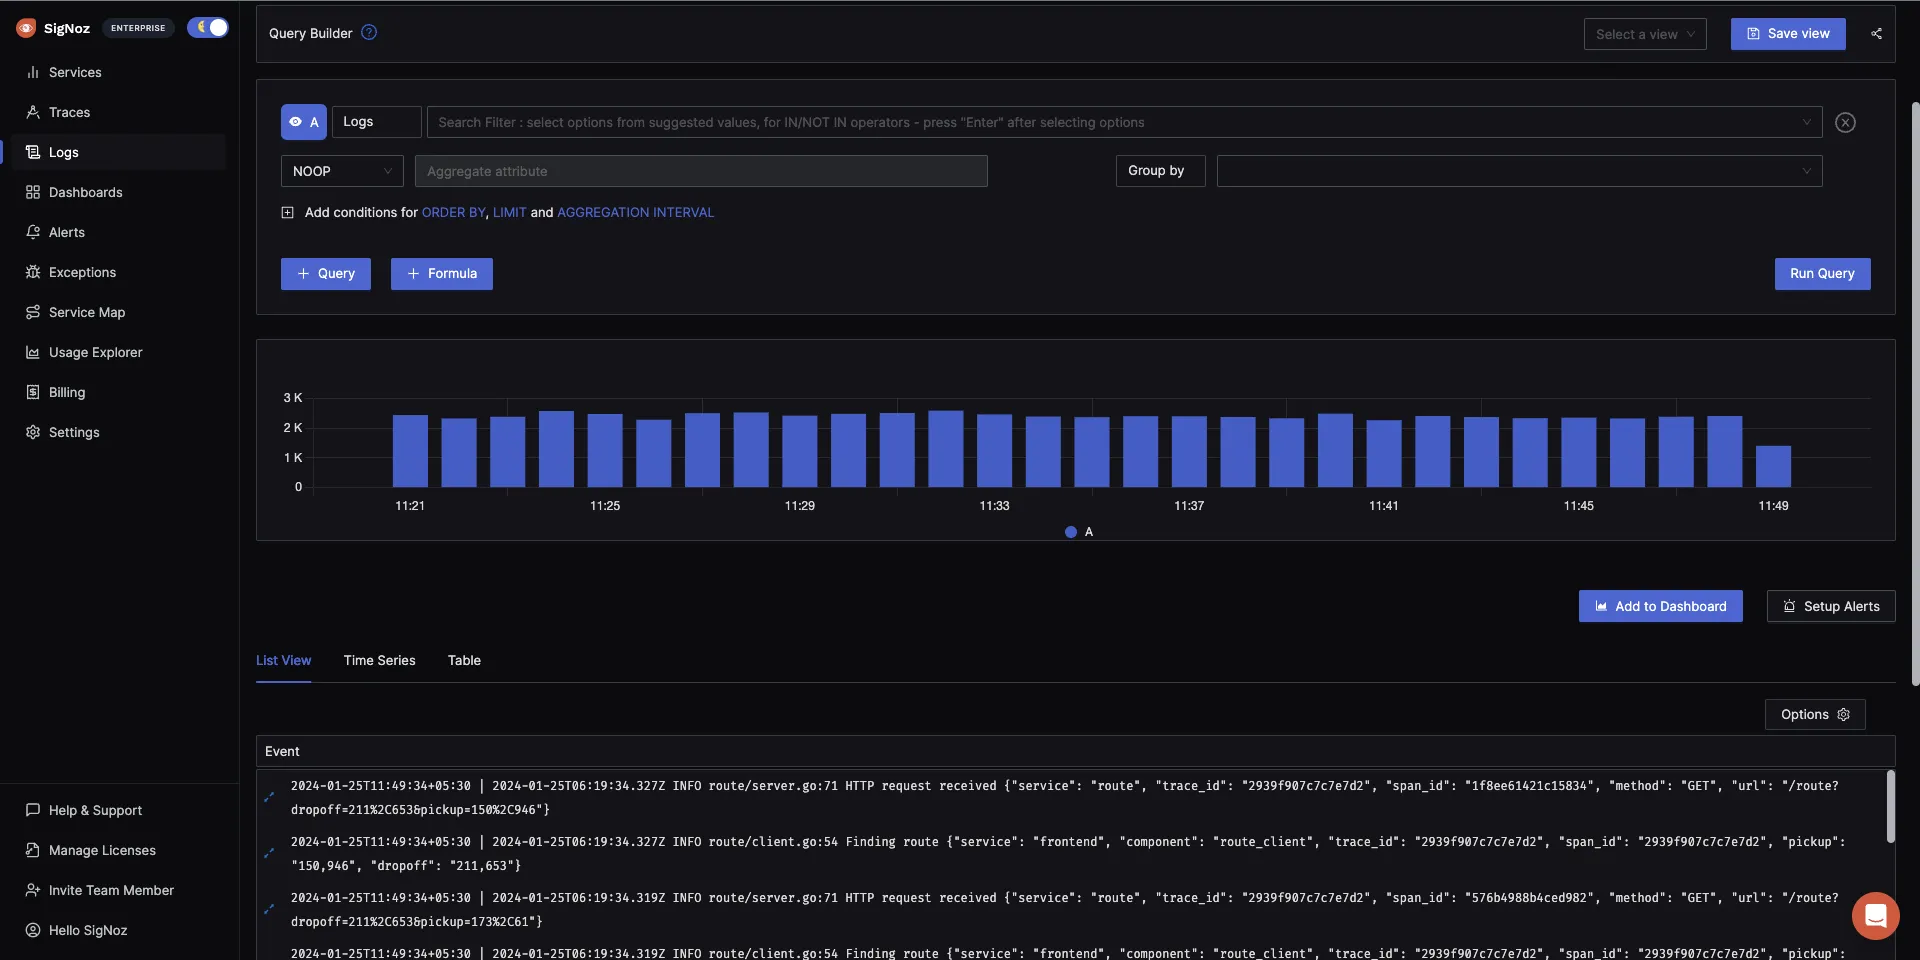
SigNoz is a great observability tool that is open-source and provides three signals in a single pane of glass. You can monitor logs, metrics, and traces and correlate signals for better insights into application performance.
With SigNoz, you can do the following:
- Visualise Traces, Metrics, and Logs in a single pane of glass
- Monitor application metrics like p99 latency, error rates for your services, external API calls, and individual endpoints.
- Find the root cause of the problem by going to the exact traces which are causing the problem and see detailed flamegraphs of individual request traces.
- Run aggregates on trace data to get business-relevant metrics
- Filter and query logs, build dashboards and alerts based on attributes in logs
- Monitor infrastructure metrics such as CPU utilization or memory usage
- Record exceptions automatically in Python, Java, Ruby, and Javascript
- Easy to set alerts with DIY query builder
Detailed flamegraph & Gantt charts to find the exact cause of the issue and which underlying requests are causing the problem.

SigNoz provides Logs management with advanced log query builder. You can also monitor your logs in real-time using live tailing.
SigNoz is also very cost-efficient and provides a great value for your money. SigNoz cloud is the easiest way to run SigNoz. Sign up for a free account and get 30 days of unlimited access to all features.
Dynatrace
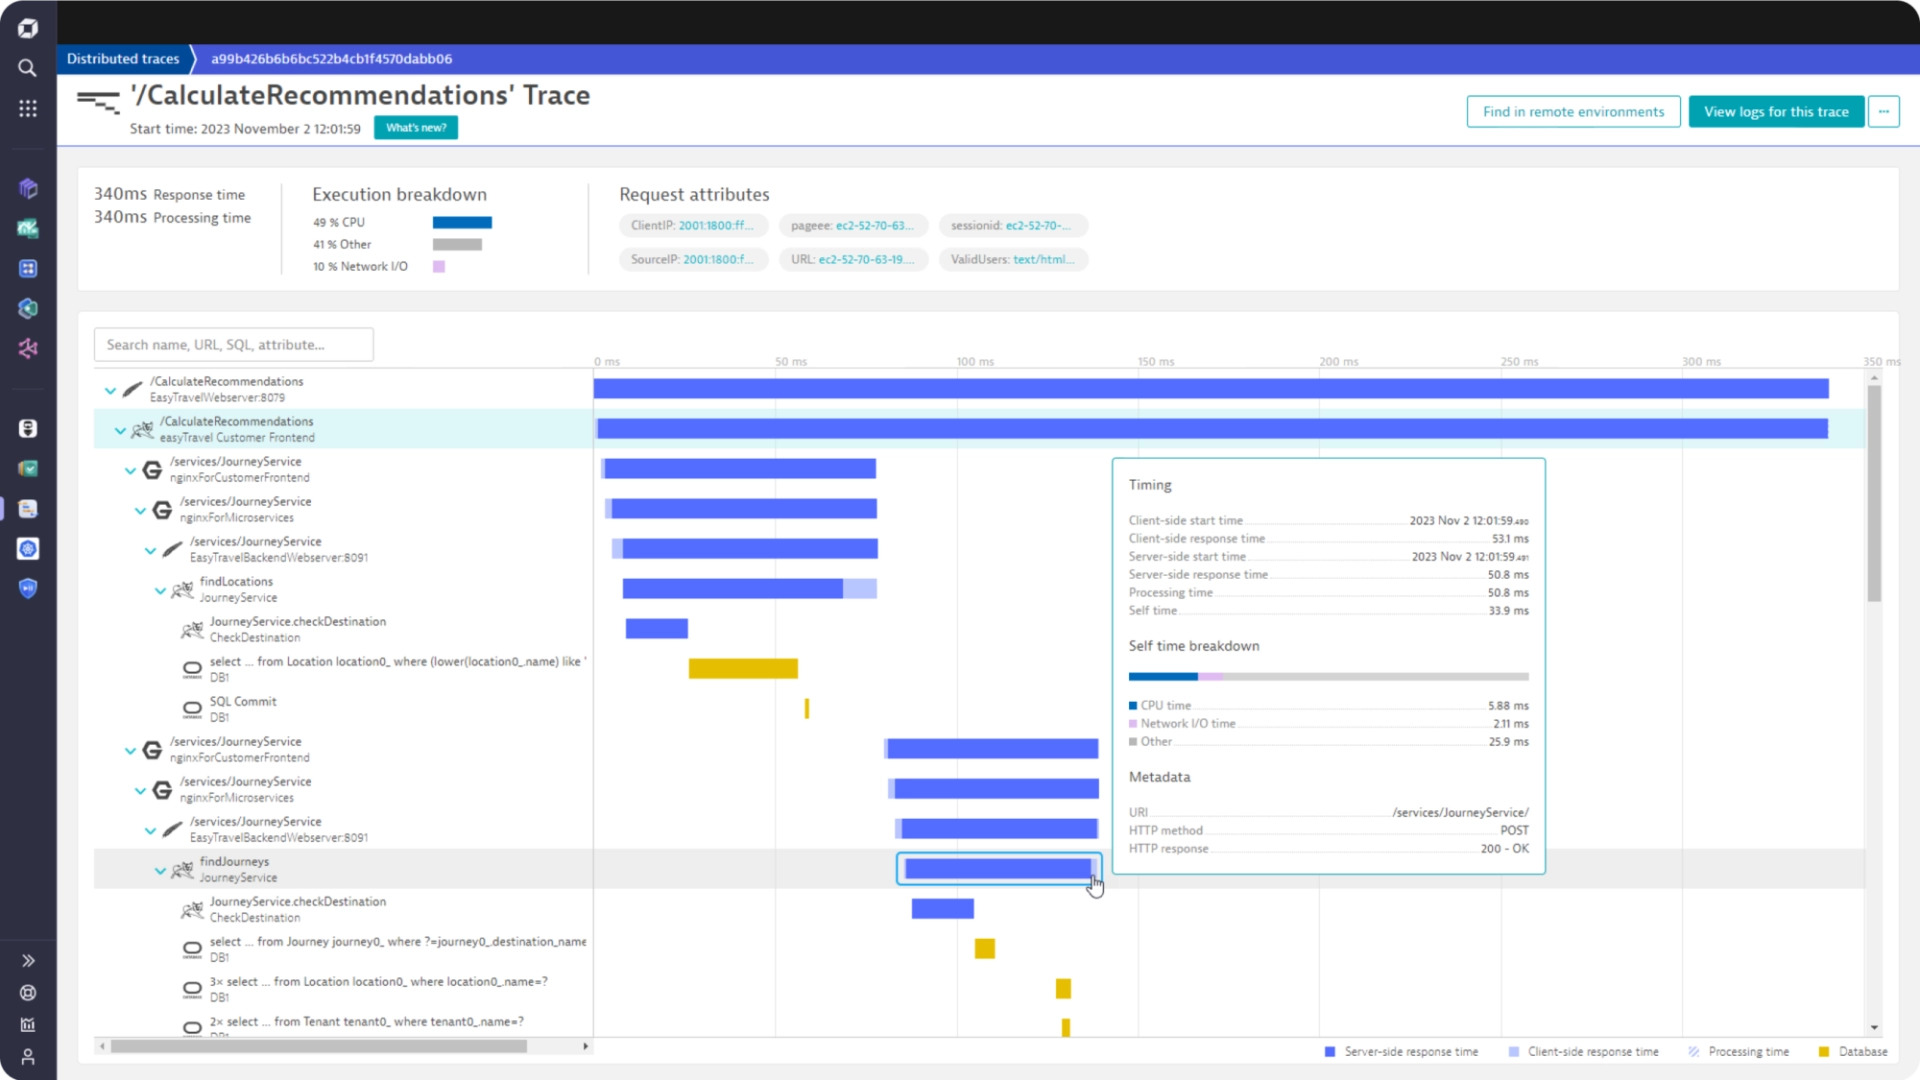
Dynatrace is an extensive SaaS enterprise tool designed for comprehensive monitoring across large-scale IT environments. It provides deep visibility into your entire application, infrastructure, and digital experience through its powerful AI engine for troubleshooting.
Dynatrace offers a comprehensive suite of monitoring solutions designed to cater to various aspects of IT operations and digital experiences such as infrastructure monitoring, application security, and cloud automation, among others. The pricing for each solution varies.
Some of the key features of Dynatrace are:
- Automatic injection and collection of data.
- Automation of root cause analysis and anomaly detection.
- Code-level visibility across all application tiers for web and mobile apps together.
- Always-on code profiling and diagnostic tools for application analysis.
If you want to learn more about Dynatrace, check out our Dynatrace comparison guide with New Relic.
Grafana Labs
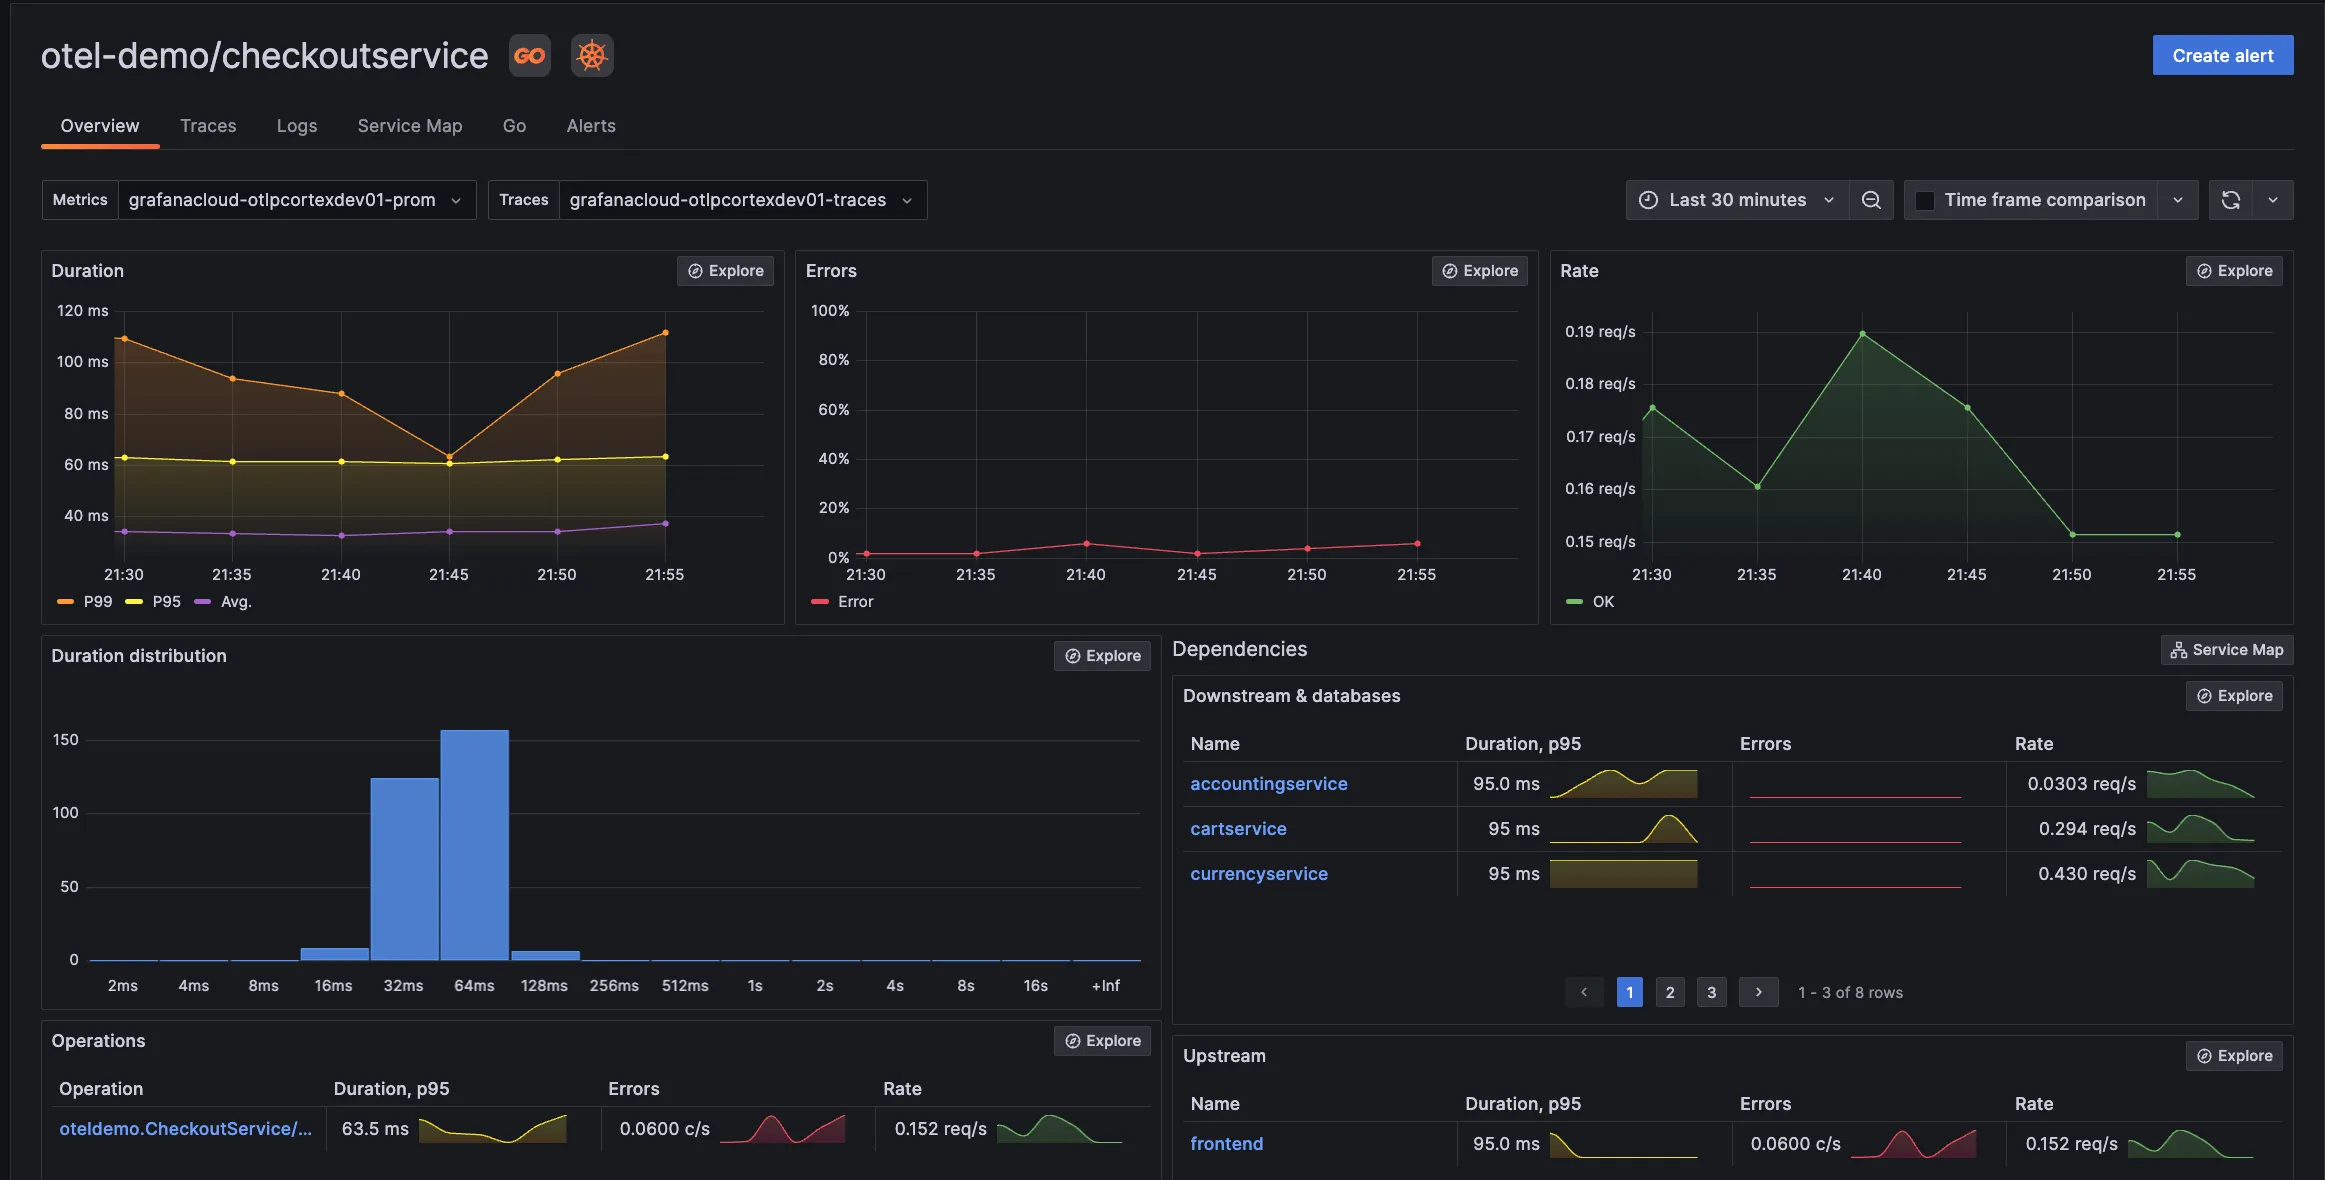
Grafana is a popular open-source analytics and interactive visualization web layer. It offers plugins, dashboards, alerts, and different user-level access for governance as an observability tool. In addition, it provides two versions of services:
- Grafana Cloud: You can send your data to Grafana Cloud dashboards. It provides solutions such as Grafana Cloud Logs, Grafana Cloud Metrics, and Grafana Cloud Traces.
- Grafana Enterprise stack: It provides support for metrics and logs with Grafana installed within your infrastructure. It also comes with expert support.
Some of the key features of Grafana are:
- Collection of data from multiple data sources.
- Rich visualization options like graphs (line, bar, heatmap), gauges, and single stats.
- Customization of dashboards and visualizations.
If you want to learn more about Grafana, check out our Grafana comparison guide with New Relic.
Honeycomb
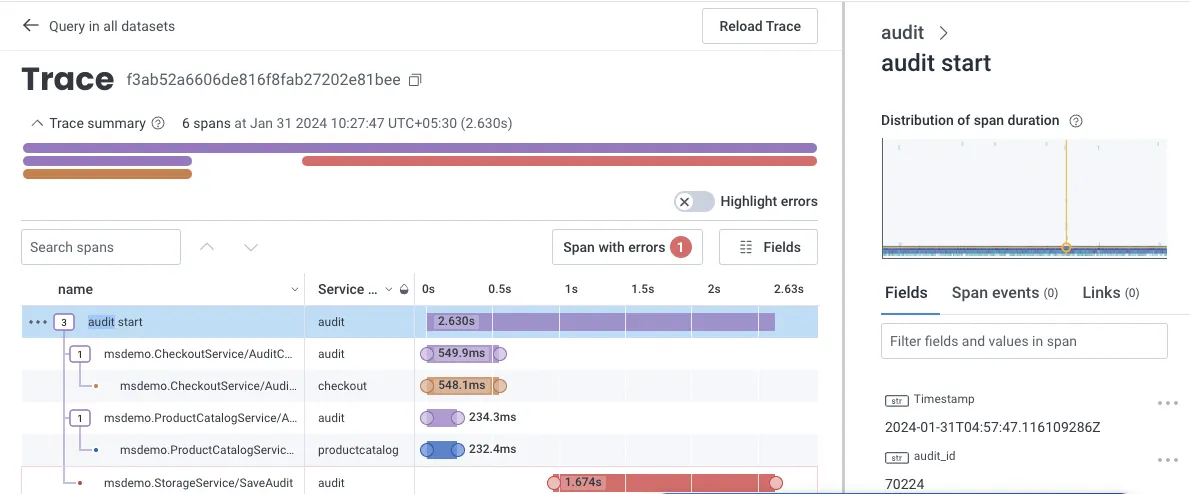
Honeycomb is a full-stack, cloud-based observability tool that provides the visibility engineering teams need to troubleshoot problems in distributed systems.
If your code is not instrumented, Honeycomb has an automatic instrumentation agent called "Honeycomb Beelines" to take care of that for you. It also supports OpenTelemetry for generating instrumentation data.
Honeycomb offers a free-tier version, and its pro version starts at $130. The pricing is based on the amount of data retained and the volume of events captured.
Some of the key features of Honeycomb are:
- Quick diagnosis of bottlenecks and performance optimization.
- Advanced querying capabilities and visualization tools.
- Full-text search over trace spans and toggles to collapse and expand sections of trace waterfalls.
New Relic
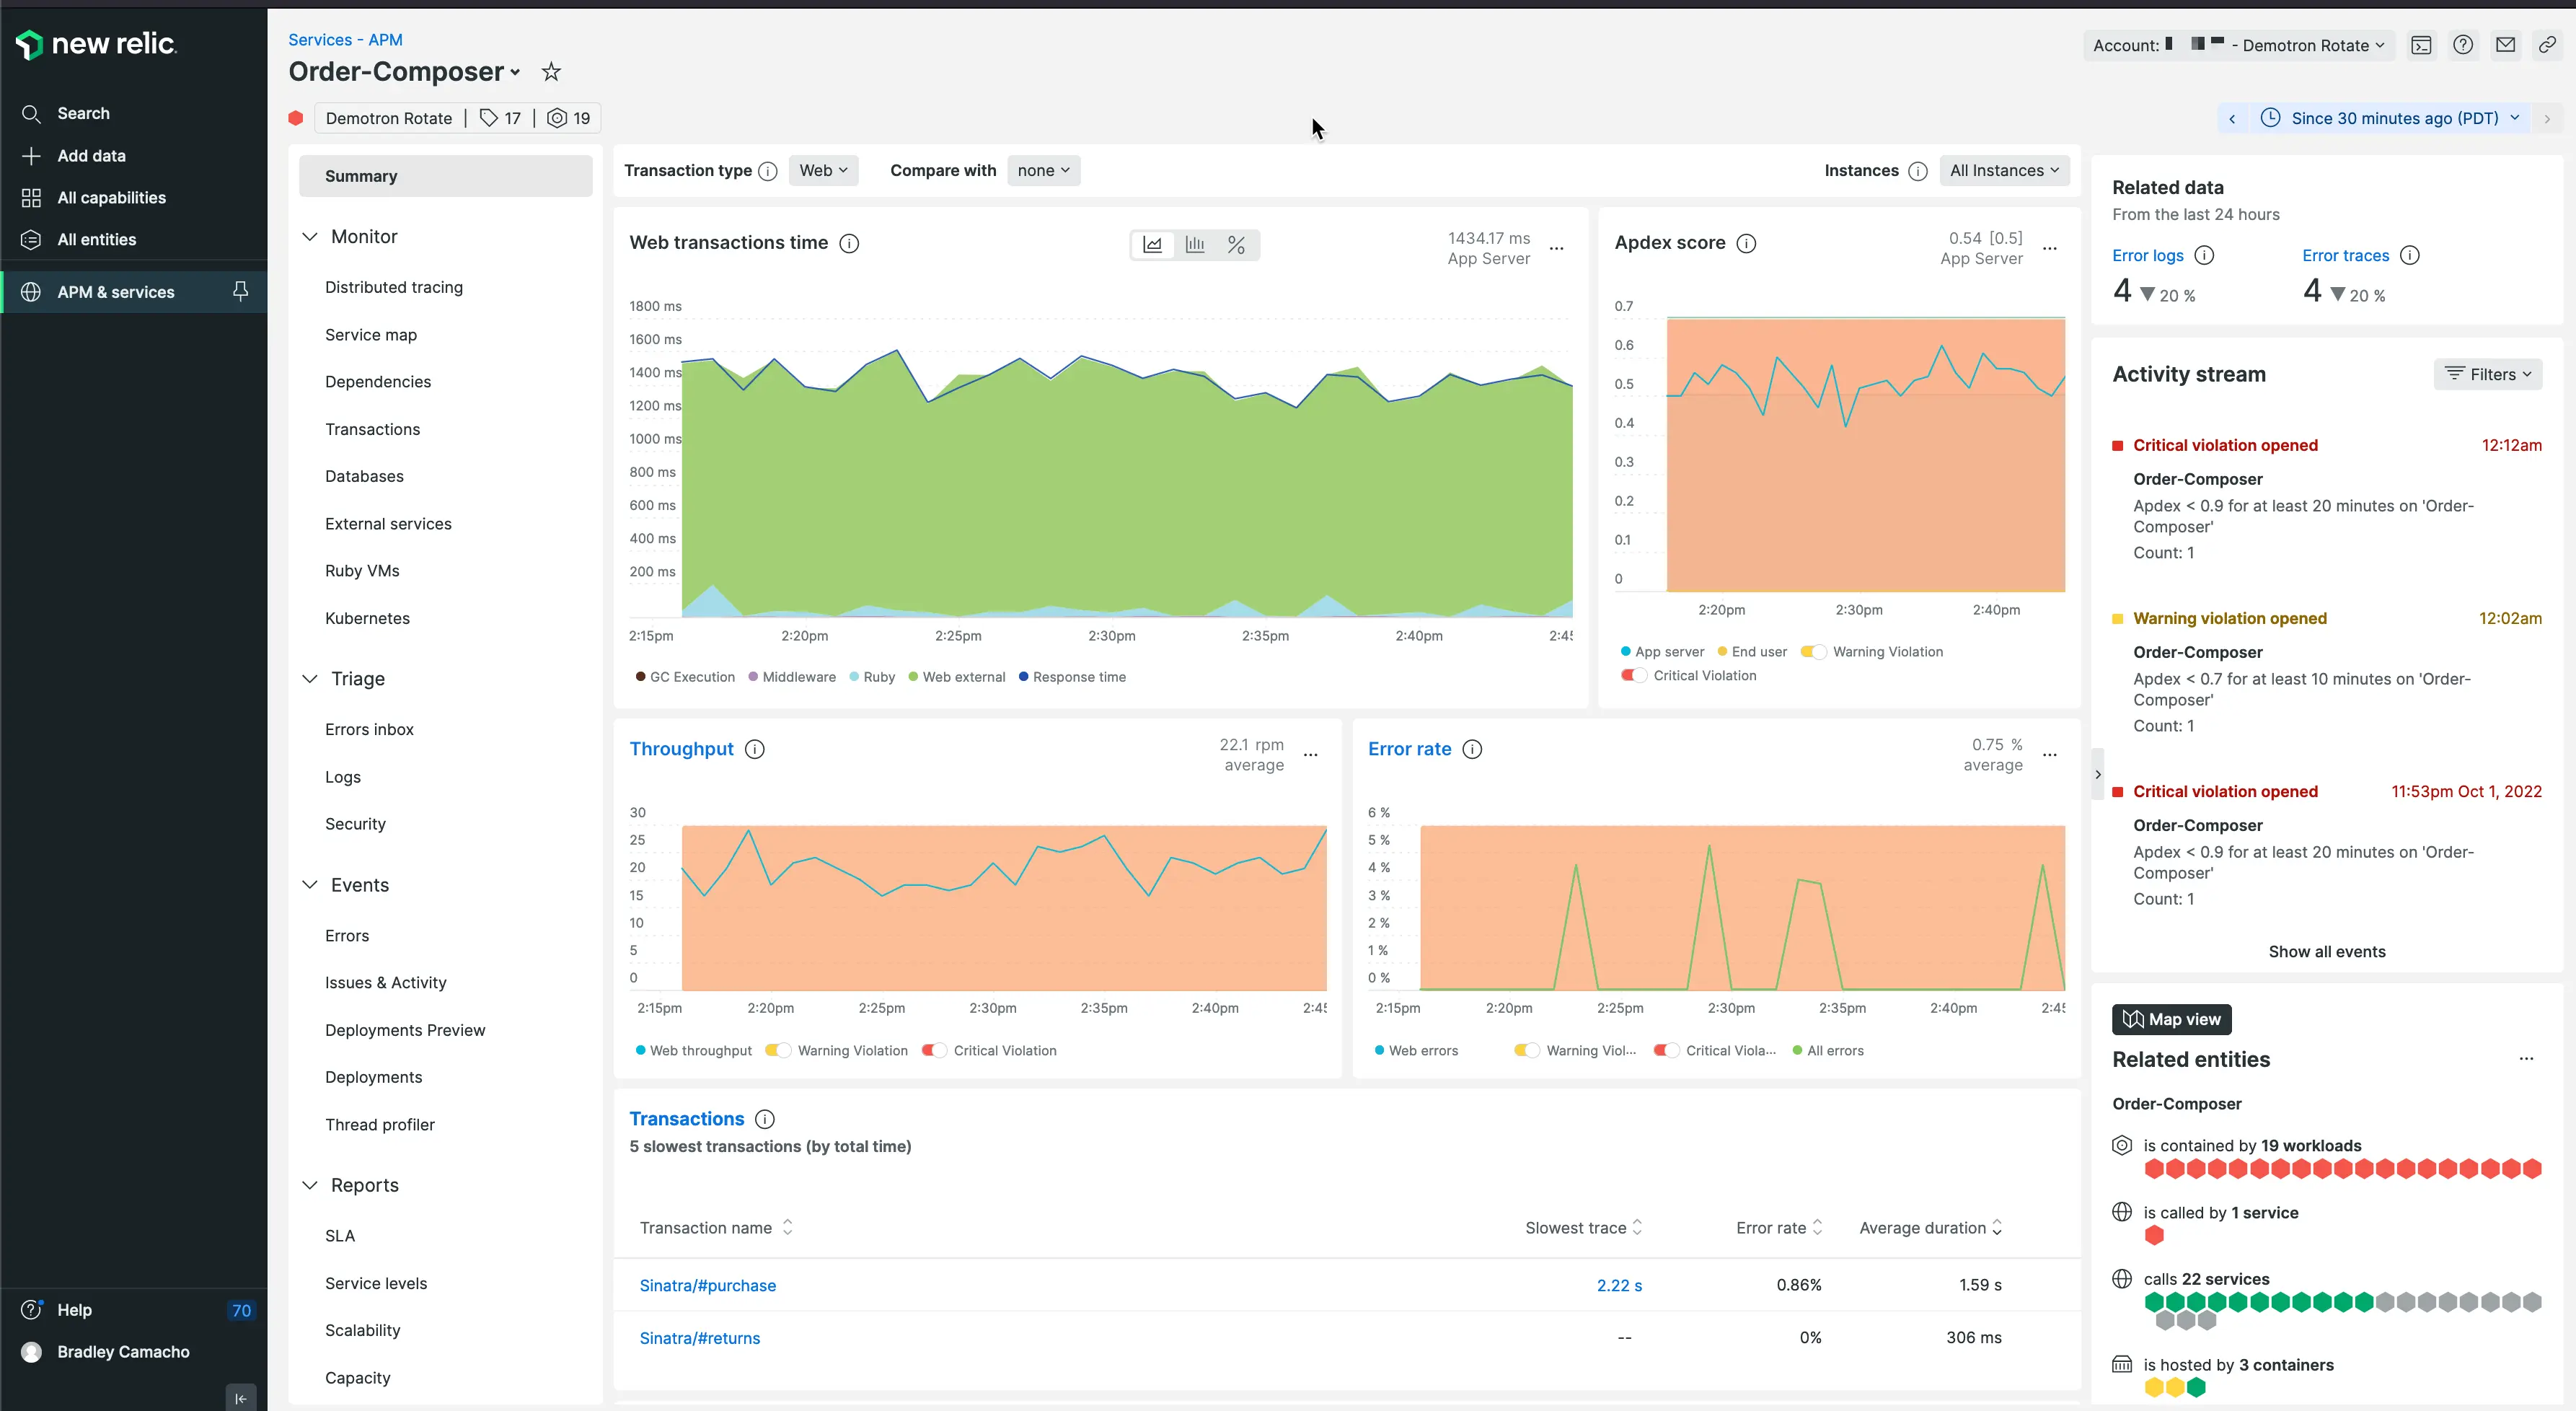
New Relic is one of the oldest companies in the observability domain. It is an observability tool enables you to visualize, analyze, and troubleshoot your software stack in a single platform. It also supports auto-instrumentation for eight popular programming languages.
New Relic provides a free forever version with 100 GB of free data ingest per month and $0.30 per extra GB. The pricing model is based on the amount of data ingested and the user seat.
Some of the key features of New Relic are:
- Connects application performance with infrastructure health for quick troubleshooting.
- Support for open-source tracing tools and standards like OpenTelemetry.
- Management of log data.
- Application security.
If you want to learn more about New Relic’s capabilities, check out our New Relic comparison guide with Splunk.
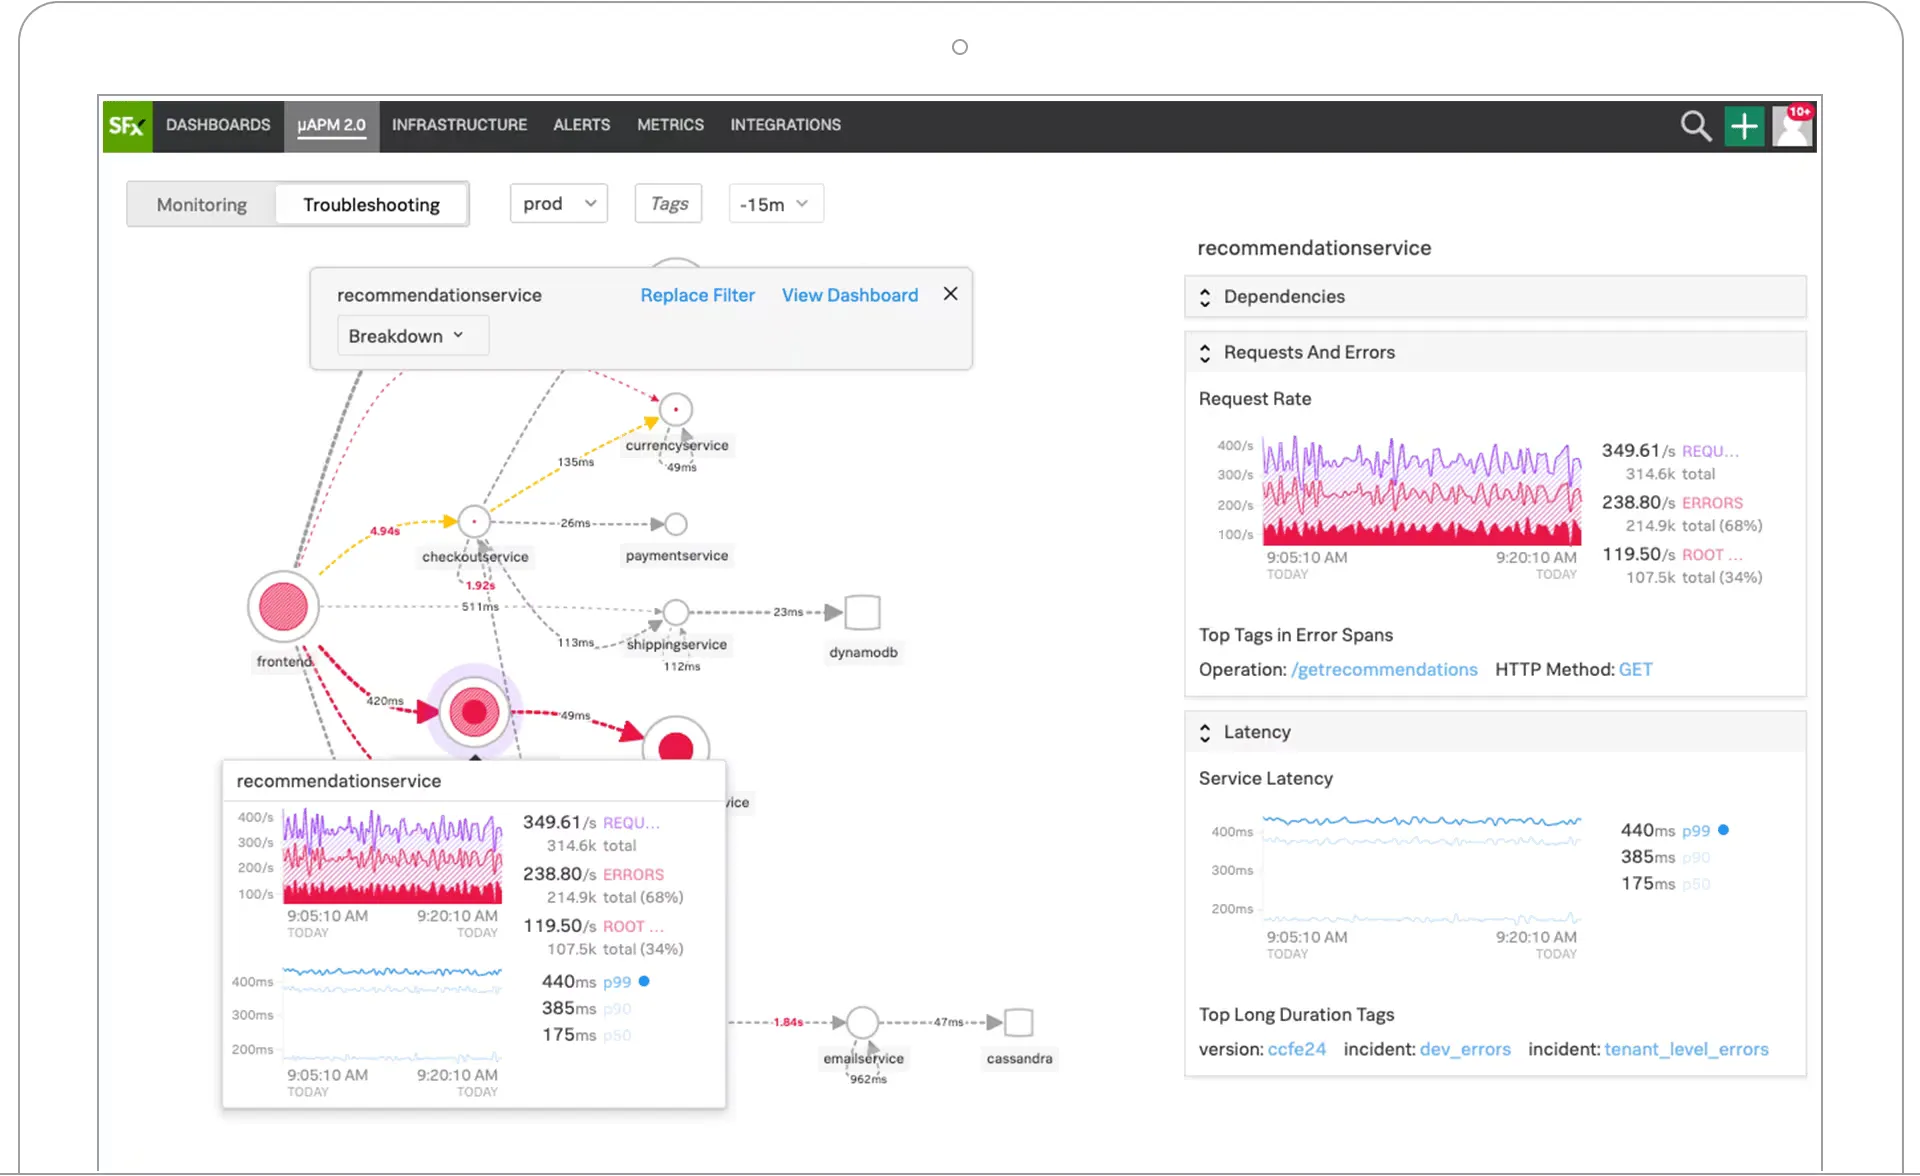
DataDog
DataDog is a comprehensive monitoring and observability platform that gives insights into the performance of IT infrastructure, applications, and services.
Datadog provides a suite of products for application performance monitoring, such as infrastructure monitoring, log management, application performance monitoring, and security monitoring. The pricing depends on the product you opt for. For example, the APM solution provides end-to-end distributed tracing, starting at $31 per host per month if billed annually.
Some key features of Datadog are:
- Seamless correlation between logs, metrics, and traces.
- End-to-end application performance monitoring.
- Collection of all your traces.
- Code-level visibility for root-cause analysis.
If you want to learn more about Datadog’s capabilities, check out our Datadog comparison guide with Splunk.
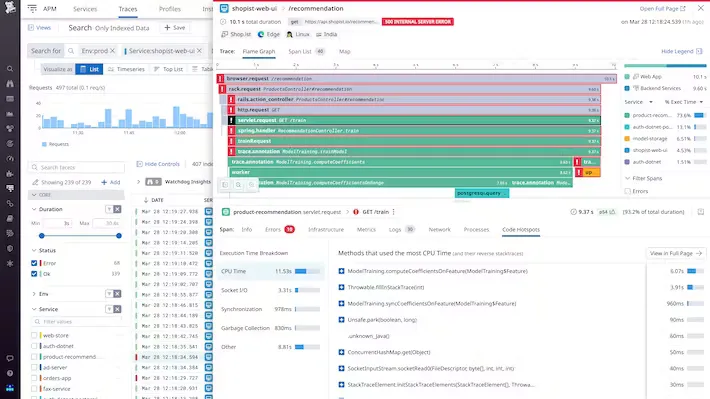
Splunk
Splunk is a comprehensive observability tool that offers multiple products, including infrastructure monitoring, application performance monitoring, logs observer, real user monitoring, synthetic monitoring, and incident response management.
Splunk allows you to collect all traces instead of a sample set. It also provides service maps to offer DevOps teams visibility into interactions between different services, dependencies, and performance.
Pricing varies based on each product. For example, the Splunk APM solution starts at $55 per host per month if billed annually.
Some of the key features of Splunk are:
- Full-stack observability of applications and systems.
- Powerful search, analysis, and visualization capability.
- Correlation of logs with real-time metrics and traces
- AI-driven analytics.
If you want to learn more about Splunk’s capabilities, check out our Splunk comparison guide with Dynatrace.
IBM Instana
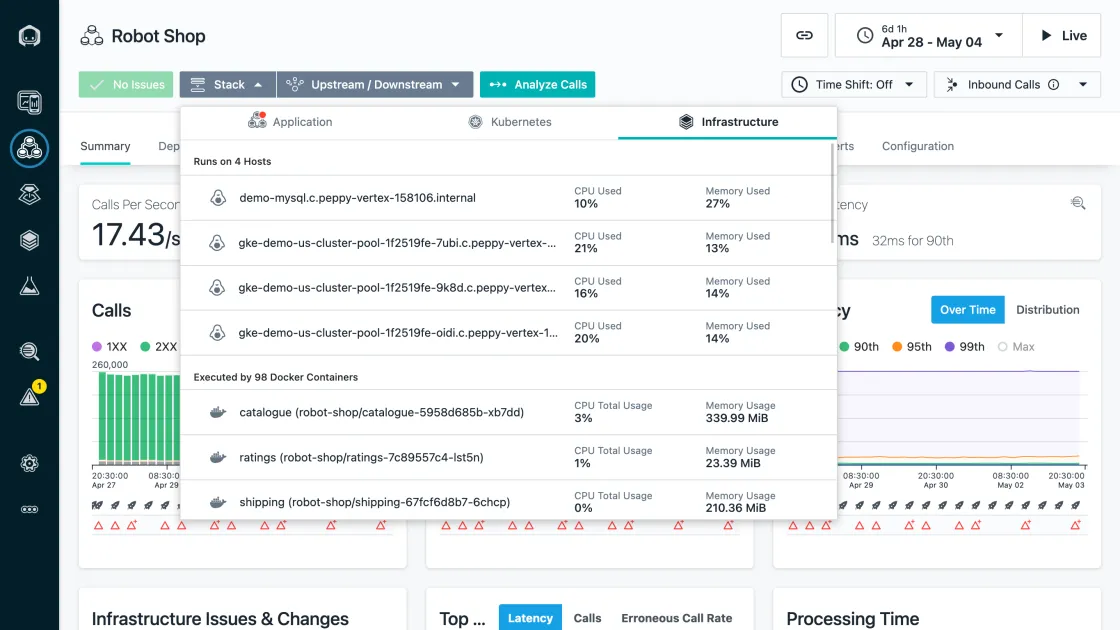
Instana is an enterprise observability and automated application monitoring tool. It uses an agent to discover and monitor components, and this agent needs to be installed on every host that is to be monitored. The agents deploy sensors crafted to capture data from different technologies. Sensors automatically collect configuration, changes, metrics, and events.
Instana charges $75 per host per month if billed annually. It also supports open standards like Prometheus, StatsD, OpenTracing, and OpenCensus.
Some of the key features of IBM Instana are:
- Automatic application discovery.
- Rich integrations.
- Automatic identification of root cause of incidents.
AppDynamics
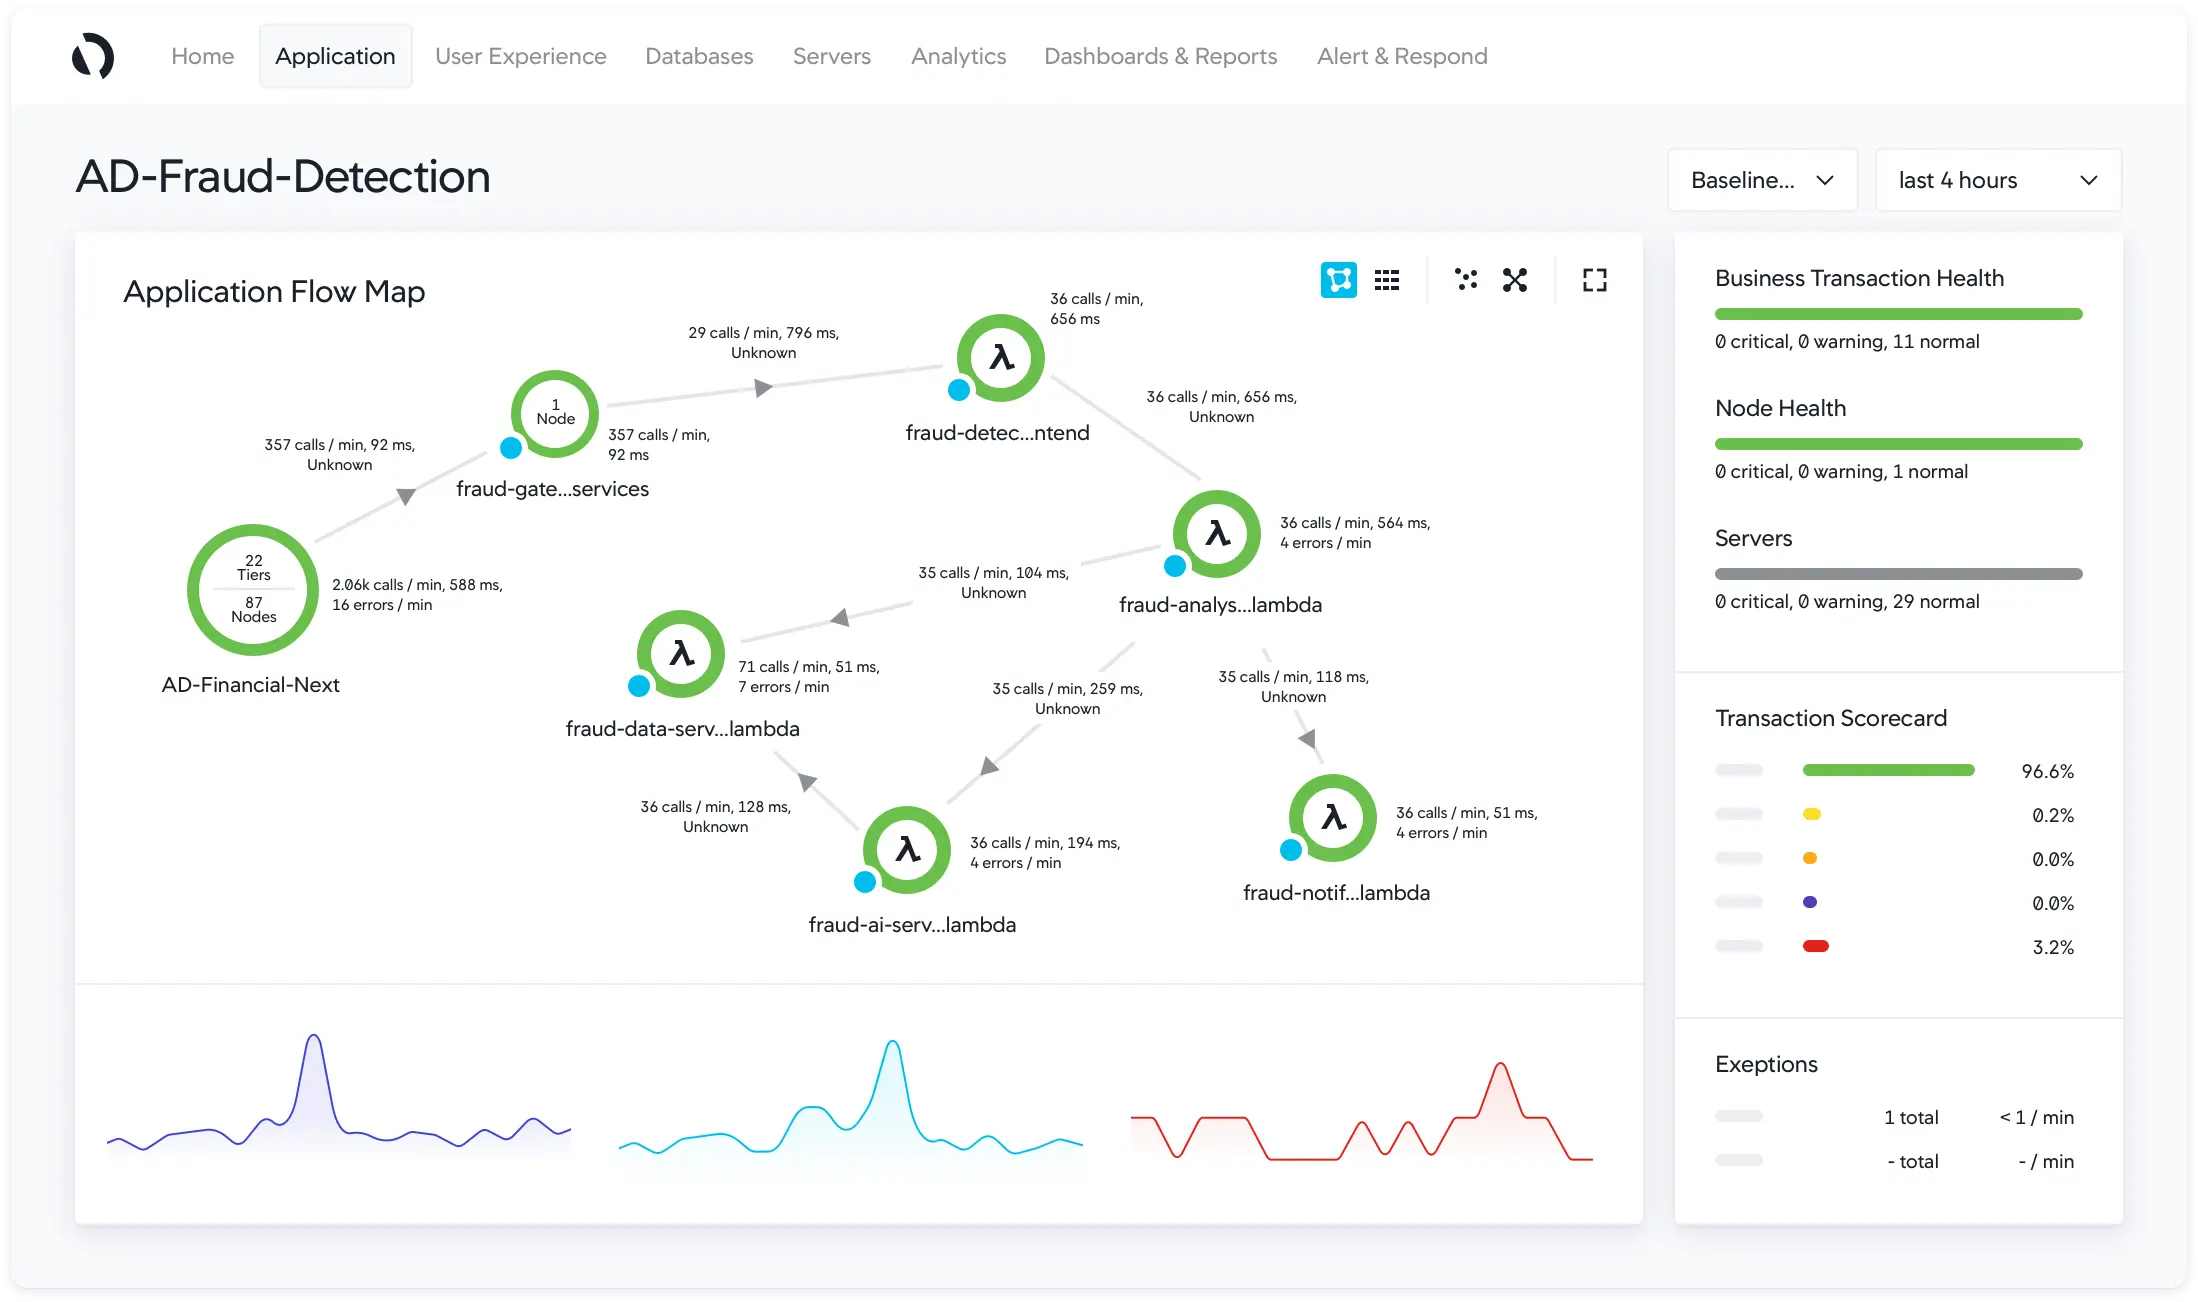
AppDynamics is an observability tool that can be used to monitor performance and analytics. It provides a detailed view of the performance and health of applications, cloud services, and IT infrastructure.
AppDynamics provides multi-cloud support, customizable dashboards for better understanding of user and application behavior, and offers visibility with context through AIOps-powered alerts that help organizations identify, prioritize, and resolve critical issues.
Some of the key features of AppDynamics are:
- Application Performance Management
- Business Transaction Monitoring
- Infrastructure monitoring
- Real-time alerting
- Root cause analysis
If you want to learn more about AppDynamics’s capabilities, check out our AppDynamics comparison guide with New Relic.
Elastic APM
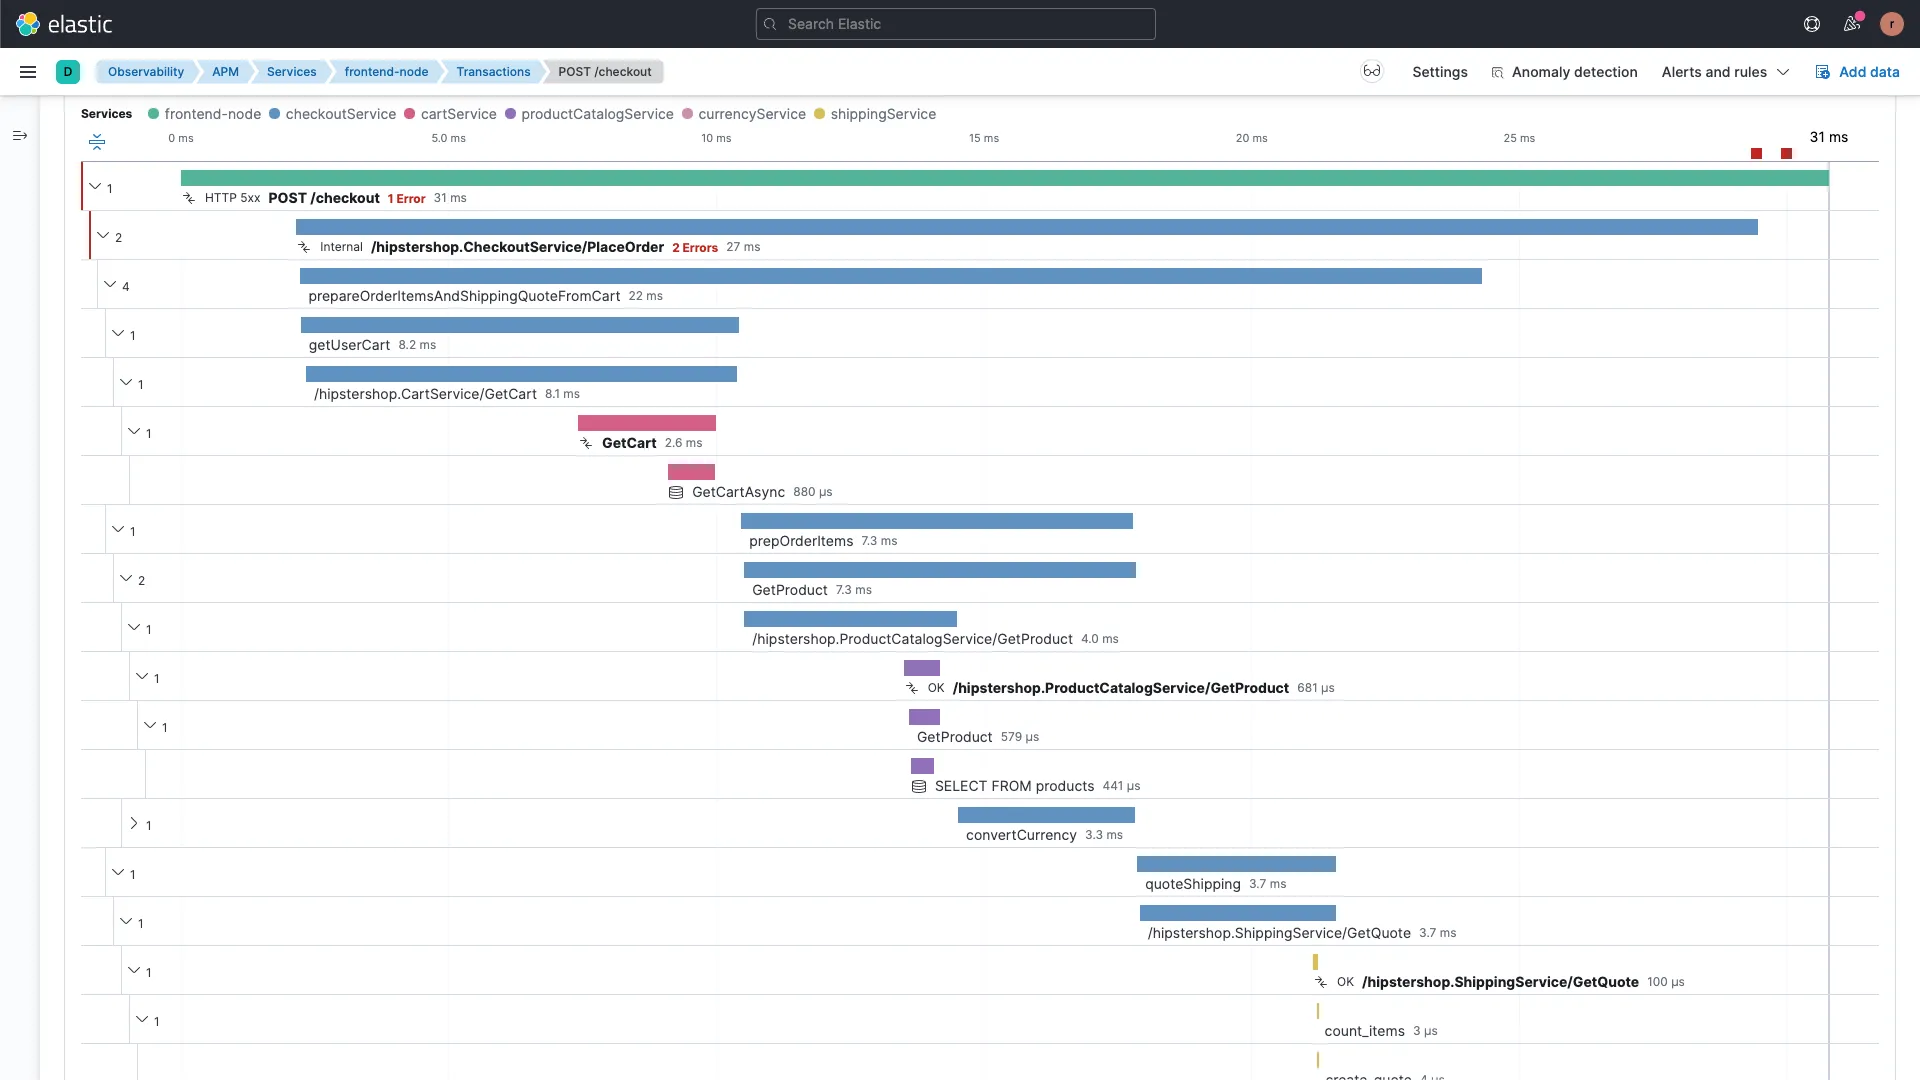
Elastic APM is an application performance monitoring system consisting of APM agents, APM servers, Elasticsearch, and Kibana, that enables you to gain deep visibility into your application's performance, identify bottlenecks, troubleshoot issues, and optimize performance over time.
The simplest way to utilize Elastic APM is by subscribing to the hosted Elasticsearch service on Elastic Cloud. Alternatively, you may choose to self-manage the Elastic stack, in which case you will need to determine how to run and configure the APM server.
Some of the key features of Elastic APM are:
- End-to-end distributed tracing.
- Real user monitoring.
- Error Tracking.
- Anomaly Detection with Machine Learning.
- Root cause analysis.
Zipkin
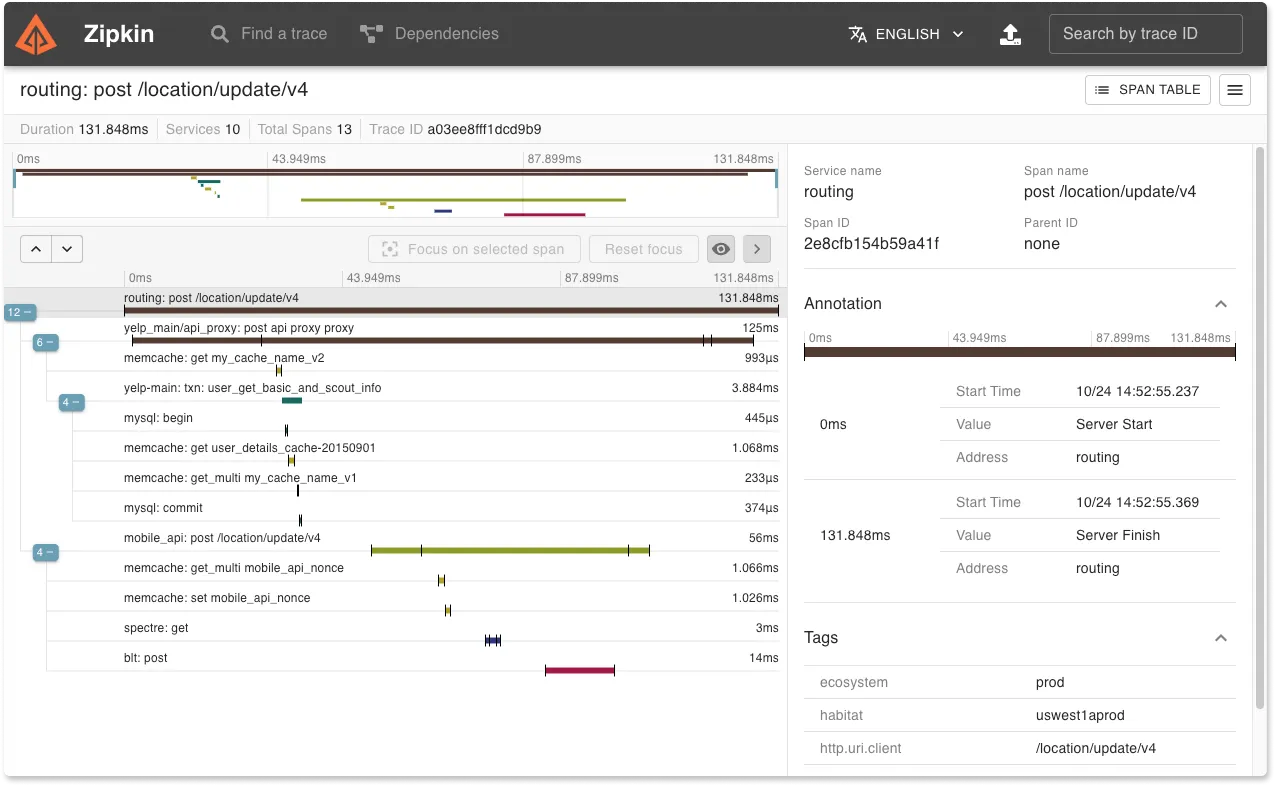
Zipkin is an open-source Application Performance Monitoring (APM) tool designed for distributed tracing. It captures detailed timing data across multiple services in a microservices architecture, providing insights into how requests flow through the system. This data is crucial for diagnosing latency issues and understanding the performance characteristics of web applications. Zipkin has a limited built-in UI and is best used with Grafana or Kibana from the ELK stack for better analytics and visualizations.
Some of the key features of Zipkin are:
- Distributed tracing across services.
- Error detection.
- Latency analysis.
How to choose the right observability tool?
For applications with microservices architecture, observability tools have become critical to meet operational challenges at scale. Without observability, it is almost impossible for your engineering teams to troubleshoot bugs and assess the performance of your applications. Hence choosing the right observability tool for your application is important. A few questions to ask yourself before selecting an observability tool are as follows:
- Are there any privacy laws that you need to take care of while sharing user's data with a third-party tool?
- Does the pricing suit your budget?
- How easy is it to get started with things like instrumentation?
- How much data do you want to retain?
- Does the tool provide seamless integration between metrics, logs, and traces?
An open-source tool like SigNoz, can be your best option in today's privacy-driven digital economy. Moreover, SigNoz uses open-source standards for instrumentation, and its code can be assessed for quality from its GitHub repo. Finally, as the tool is open-sourced, you get the support of the community while having access to out-of-box features like a SaaS vendor.
Implementing SigNoz: A Comprehensive Open-Source Observability Solution
SigNoz offers a compelling open-source alternative for teams looking for a cost-effective, customizable observability solution. Here's how to get started:
- Choose your deployment option: SigNoz can be self-hosted or used as a managed cloud service.
- Set up SigNoz Cloud:
- Sign up for a SigNoz Cloud account
- Follow the guided setup process to connect your applications
- Configure data sources and start ingesting telemetry data
- For self-hosted deployment:
- Use Docker Compose or Kubernetes to deploy SigNoz
- Configure your applications to send data to SigNoz
- Set up dashboards and alerts according to your needs
- Integrate with your DevOps workflow:
- Configure alerts to notify your incident management tools
- Use SigNoz APIs to incorporate observability data into your CI/CD pipelines
- Train your team on using SigNoz for troubleshooting and performance analysis
- Optimize and scale:
- Regularly review and refine your dashboards and alerts
- Scale your SigNoz deployment as your data volume grows
- Contribute to the open-source project to help shape its future development
SigNoz Cloud is the easiest way to run SigNoz. Sign up for a free account and get 30 days of unlimited access to all features.

You can also install and self-host SigNoz yourself since it is open-source. With 24,000+ GitHub stars, open-source SigNoz is loved by developers. Find the instructions to self-host SigNoz.

To maximize the benefits of observability tools in your DevOps practices:
- Define clear observability goals: Establish specific, measurable objectives for your observability implementation.
- Implement observability as code: Version control your observability configurations to ensure consistency and enable easy rollbacks.
- Foster a culture of observability: Encourage all team members to leverage observability data in their daily work.
- Automate where possible: Use your observability tool's APIs to automate routine tasks and integrate with your CI/CD pipeline.
- Continuously refine your approach: Regularly review and update your observability strategies based on changing needs and new insights.
- Balance automation and human expertise: While AI-driven insights are valuable, maintain human oversight for complex problem-solving.
- Prioritize security and compliance: Ensure your observability practices align with data protection regulations and security best practices.
Future Trends in Observability Tools for DevOps
As technology evolves, observability tools are adapting to meet new challenges:
- AI-driven observability: Expect more advanced machine learning capabilities for anomaly detection, predictive analytics, and automated root cause analysis.
- Observability-driven development: Observability will increasingly influence software design, with developers considering observability from the outset.
- Edge computing observability: Tools will adapt to provide visibility into edge computing environments and IoT devices.
- Unified observability platforms: There will be a continued trend towards platforms that integrate logs, metrics, and traces with business intelligence.
- Increased focus on security observability: Observability tools will incorporate more security-focused features to support DevSecOps practices.
- Open standards and interoperability: Expect greater adoption of open standards like OpenTelemetry to improve tool interoperability.
By staying informed about these trends, DevOps teams can ensure they're well-positioned to leverage the latest advancements in observability technology.
Key Takeaways
- Observability is crucial for modern DevOps practices, providing insights into complex, distributed systems.
- The choice between observability tools and platforms depends on your specific needs, infrastructure, and resources.
- Top observability tools offer a range of features from basic monitoring to advanced AI-driven analytics.
- Open-source solutions like SigNoz provide cost-effective alternatives with growing community support.
- Implementing observability requires a strategic approach, considering factors like scalability, integration, and team expertise.
- Future trends in observability include AI-driven insights, edge computing support, and increased focus on security.
FAQs
What's the difference between monitoring and observability?
Monitoring focuses on tracking predefined sets of metrics and known issues, while observability provides a more comprehensive view of system behavior, allowing you to explore and diagnose unforeseen problems.
How do observability tools impact application performance?
Observability tools can have a minimal impact on performance when properly implemented. Most modern tools are designed to be lightweight and efficient. However, it's important to monitor the overhead of your observability solution and adjust as needed.
Can observability tools help with compliance and security?
Yes, many observability tools offer features that support compliance and security efforts. They can help track access patterns, detect anomalies, and provide audit trails — all crucial for maintaining a secure and compliant environment.
What role does AI play in modern observability tools?
AI enhances observability tools by providing advanced anomaly detection, predictive analytics, and automated root cause analysis. This helps teams quickly identify and resolve issues, often before they impact users.
Why are observability tools important for microservices architecture?
Observability tools are crucial for microservices architecture because they provide central dashboards to gauge the health of distributed systems. They enable teams to proactively solve availability and performance issues, which is critical for maintaining customer experience in complex, modern applications.
What are the three main signals monitored by observability tools?
The three main signals monitored by observability tools are metrics, traces, and logs. These signals provide comprehensive insights into application performance and behavior.
How do observability tools differ from traditional monitoring tools?
Observability tools go beyond traditional monitoring by enabling teams to get answers to any question that might arise while debugging application issues, even if those questions weren't anticipated when setting up the monitoring. They provide more in-depth insights and flexibility in analyzing system behavior.
What are some key features to look for in an observability tool?
Key features to look for in an observability tool include:
- Integration of metrics, logs, and traces in a single platform
- Ability to generate, sample, process, and emit telemetry data
- Efficient storage system for fast retrieval and long-term retention
- Robust visualization layer for easy consumption and action
- Support for distributed tracing
- Customizable dashboards and alerts
- Root cause analysis capabilities
How does pricing typically work for observability tools?
Pricing for observability tools varies widely. Some offer free tiers or open-source versions, while others have pricing based on factors such as the amount of data ingested, the number of hosts monitored, or the number of user seats. Enterprise versions often offer custom pricing based on specific needs and usage volumes.
Can observability tools help with compliance and security?
Yes, many observability tools offer features that can assist with compliance and security. They can help track access patterns, detect anomalies, and provide audit trails. Some tools also offer specific security monitoring features to help identify potential threats or vulnerabilities in your systems.
How do observability tools handle data privacy concerns?
Observability tools handle data privacy concerns in various ways. Some offer options for data masking or redaction to protect sensitive information. Open-source tools like SigNoz allow you to keep all data on-premises, which can be crucial for companies dealing with strict data privacy regulations. It's important to review each tool's data handling practices and ensure they align with your privacy requirements.
Related Content
