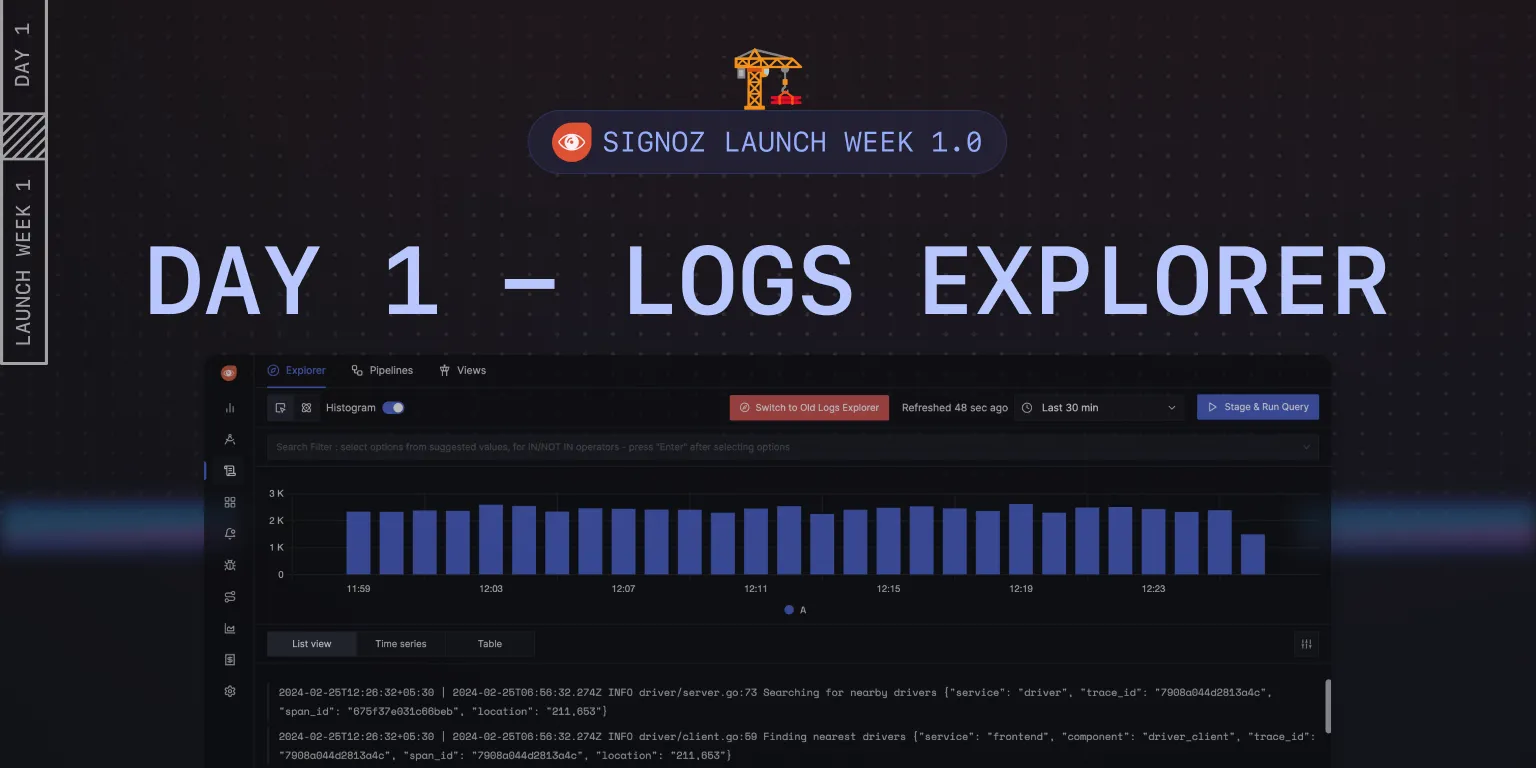
Feature in Spotlight: Logs Explorer [Day 1] 🪵

Maintainer, SigNoz
Welcome to SigNoz Launch Week 1.0!
This is our first launch week, and we’re excited to introduce you to some cool new features in SigNoz. We ship fast but often miss sharing the story behind these features with our community.
Launch week for us is an opportunity to share the behind-the-scenes of new features that we have built in the recent past. Our open-source maintainers will share the story on the whats, whys, and hows of new upgrades to SigNoz!
Every day of this week, we will be putting one feature in the spotlight and getting to know the story behind it.
For day 1, the feature in the spotlight is the Logs Explorer in SigNoz. Out of the three signals of observability (metrics, traces, and logs), logs are the easiest one to start with for developers. While developing applications, developers use logs as the first signal to capture important information.
No wonder that it is one of the highest-used features in SigNoz. We have shipped a complete design revamp of Logs Explorer to enhance developer productivity.
Builders - Nitya & Shuvam
Nitya has built logs in SigNoz from the ground up. He was fascinated with the idea of an open-source observability tool and joined SigNoz early. Now Nitya is deep into logging with OpenTelemetry and taking logs at SigNoz to the next level.
Shuvam leads design at SigNoz. He fell in love with software products at an early age, and with a background in Computer Science, he is passionate about solving developer problems with design.

Logs Explorer in SigNoz
Building a robust logs explorer has its own challenges.
Different formats of logs: Logs can be generated in any format, depending on the developer's preference or the system's requirements. This lack of standardization complicates the aggregation and analysis of logs.
Wide range of sources & deployment environments: Logs can be produced by a wide range of sources. Applications can also be deployed in different environments like Docker, Kubernetes, bare metal, etc. Each environment might have its own method of log generation and transmission.
To build a generic logs explorer, you will need a system that understands logs in different formats from different sources and provides users with a way to query their logs. The flexibility that logs provide makes it difficult to analyze them properly.
SigNoz logs explorer is meant to overcome these challenges and provide developers with an easy way to collect and analyze their logs.
Components of SigNoz Logs Explorer
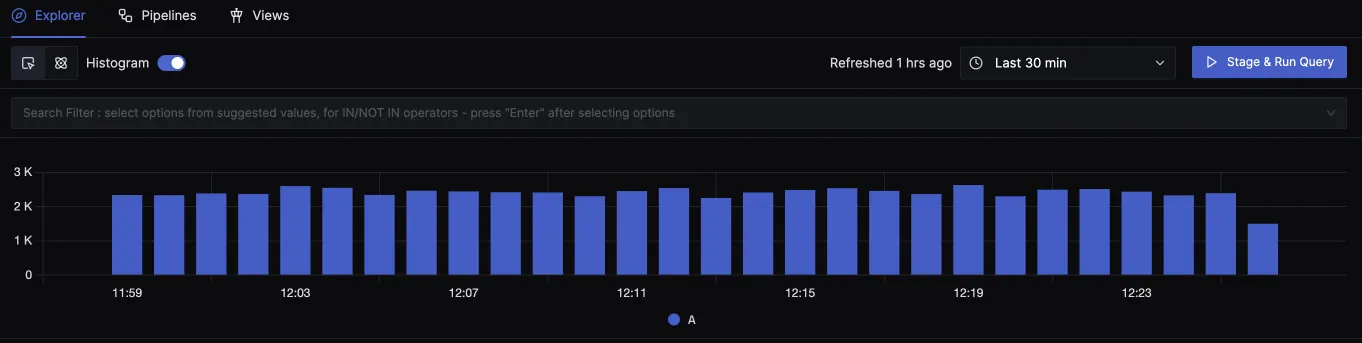
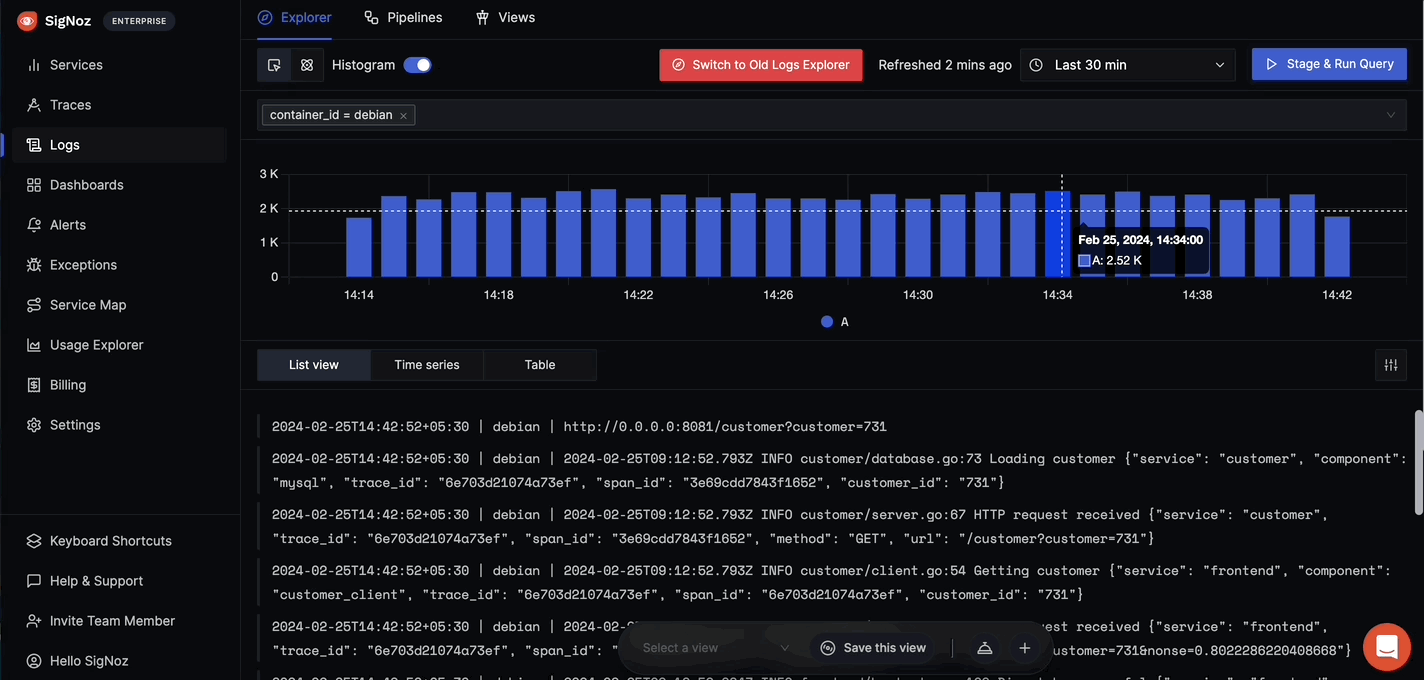
Histogram
Histogram shows the count of logs that were ingested in the specified time range. For example, in the below screenshot it shows the count of logs ingested in the last 30 minutes.
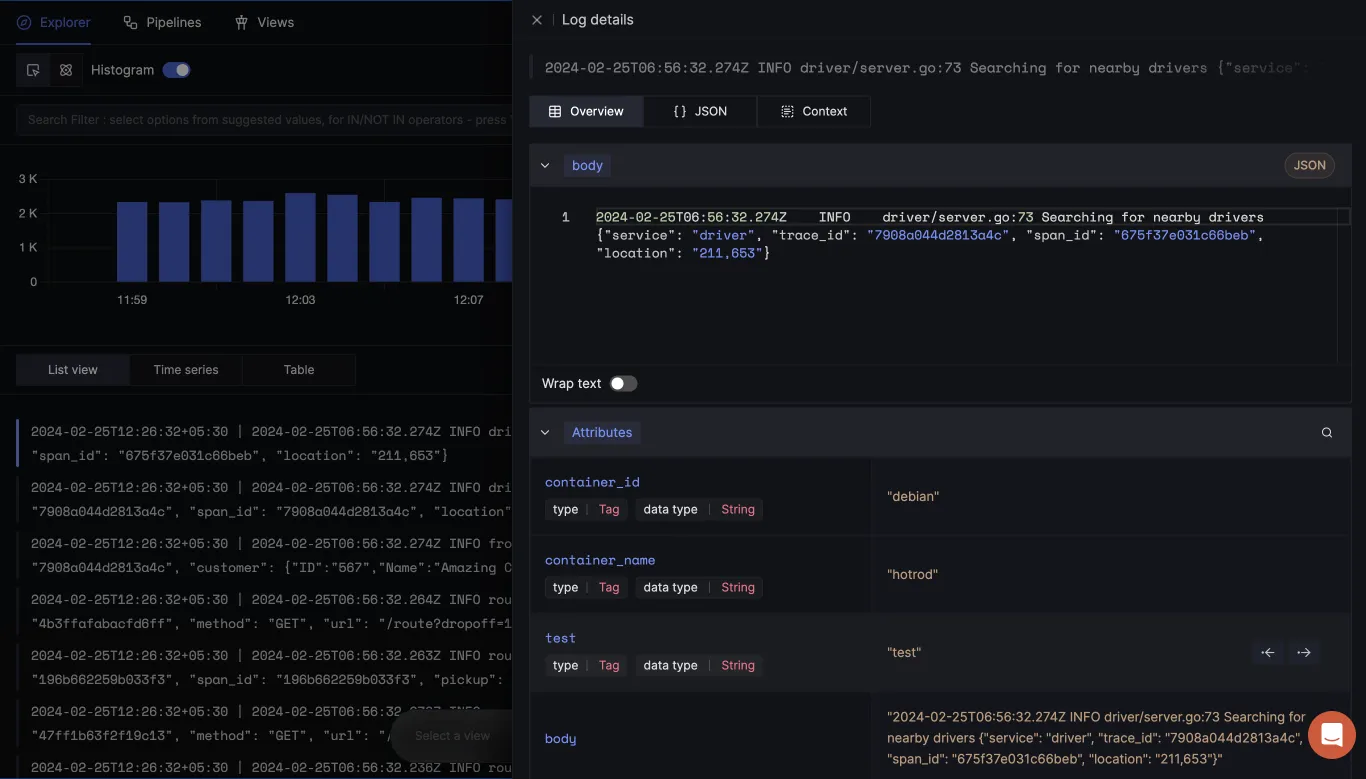
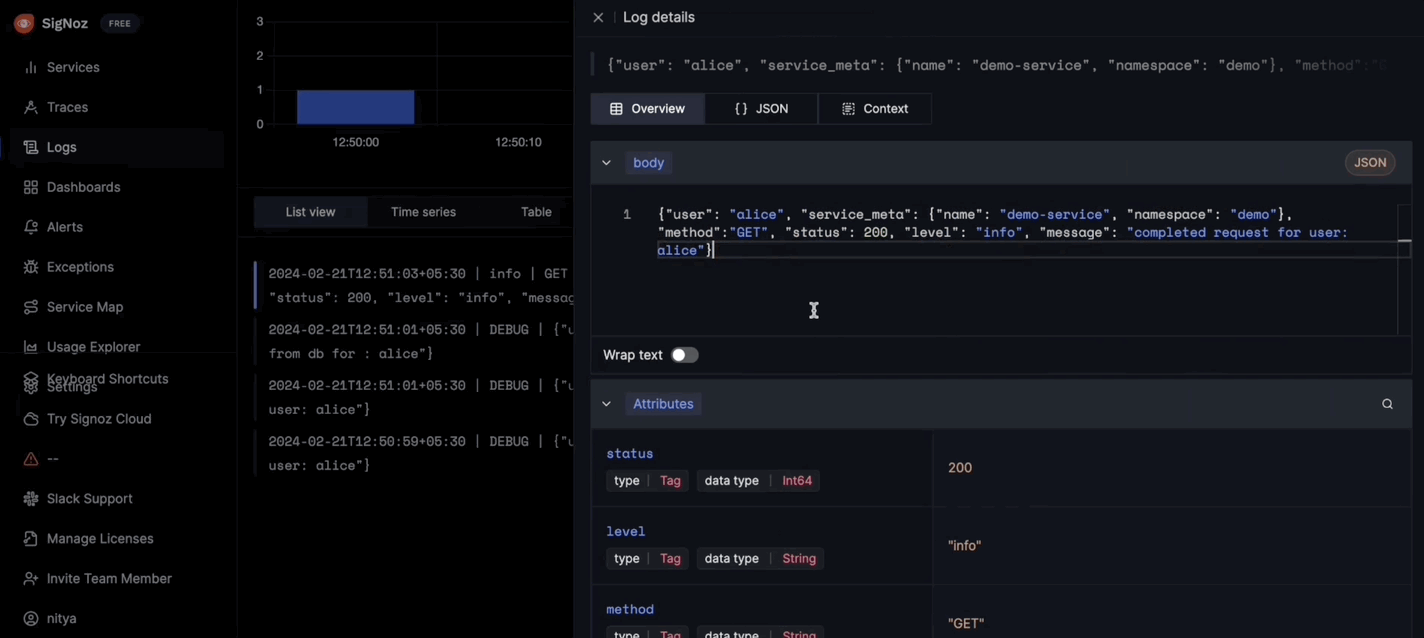
Expanded View of Logs
You can click on a log line to see the expanded view of the log. It shows the log body and all the attributes that are attached to it. The context view for a log shows other logs that were emitted before and after it by the same source. For example, the context view for a log emitted by a docker container will show it in context between the logs that were emitted before and after it by the same container. This can be useful for gaining more context while debugging issues.
Filtering Options
Searching through logs is the first thing a developer might want to do with logs. Our Logs Explorer has two ways to search and query your logs:
Search Filter:
The search filter helps you query logs based on different attributes extracted.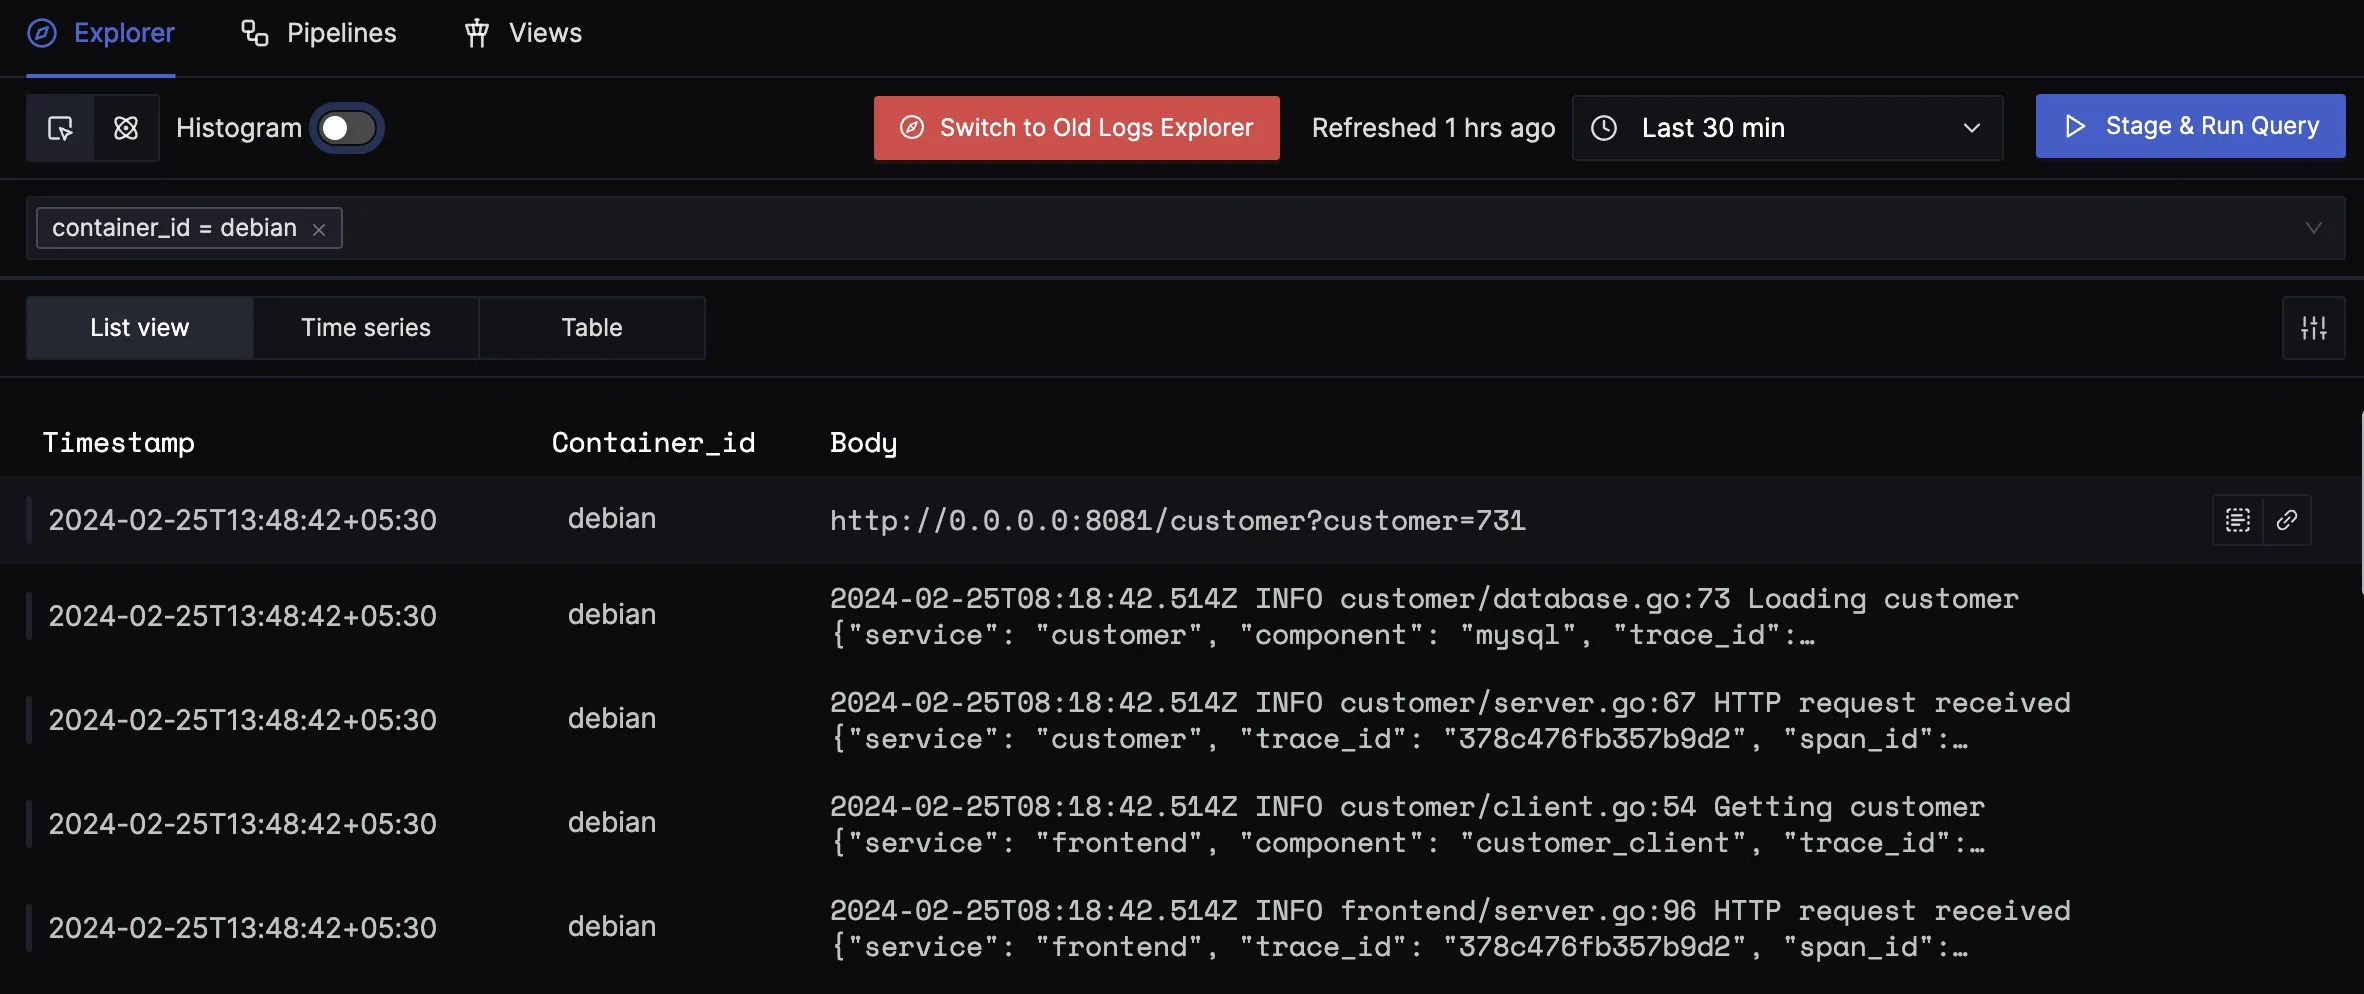
Search applied for container_id=debianAdvanced Query Builder:
The advanced query builder helps you query logs and perform aggregation on it.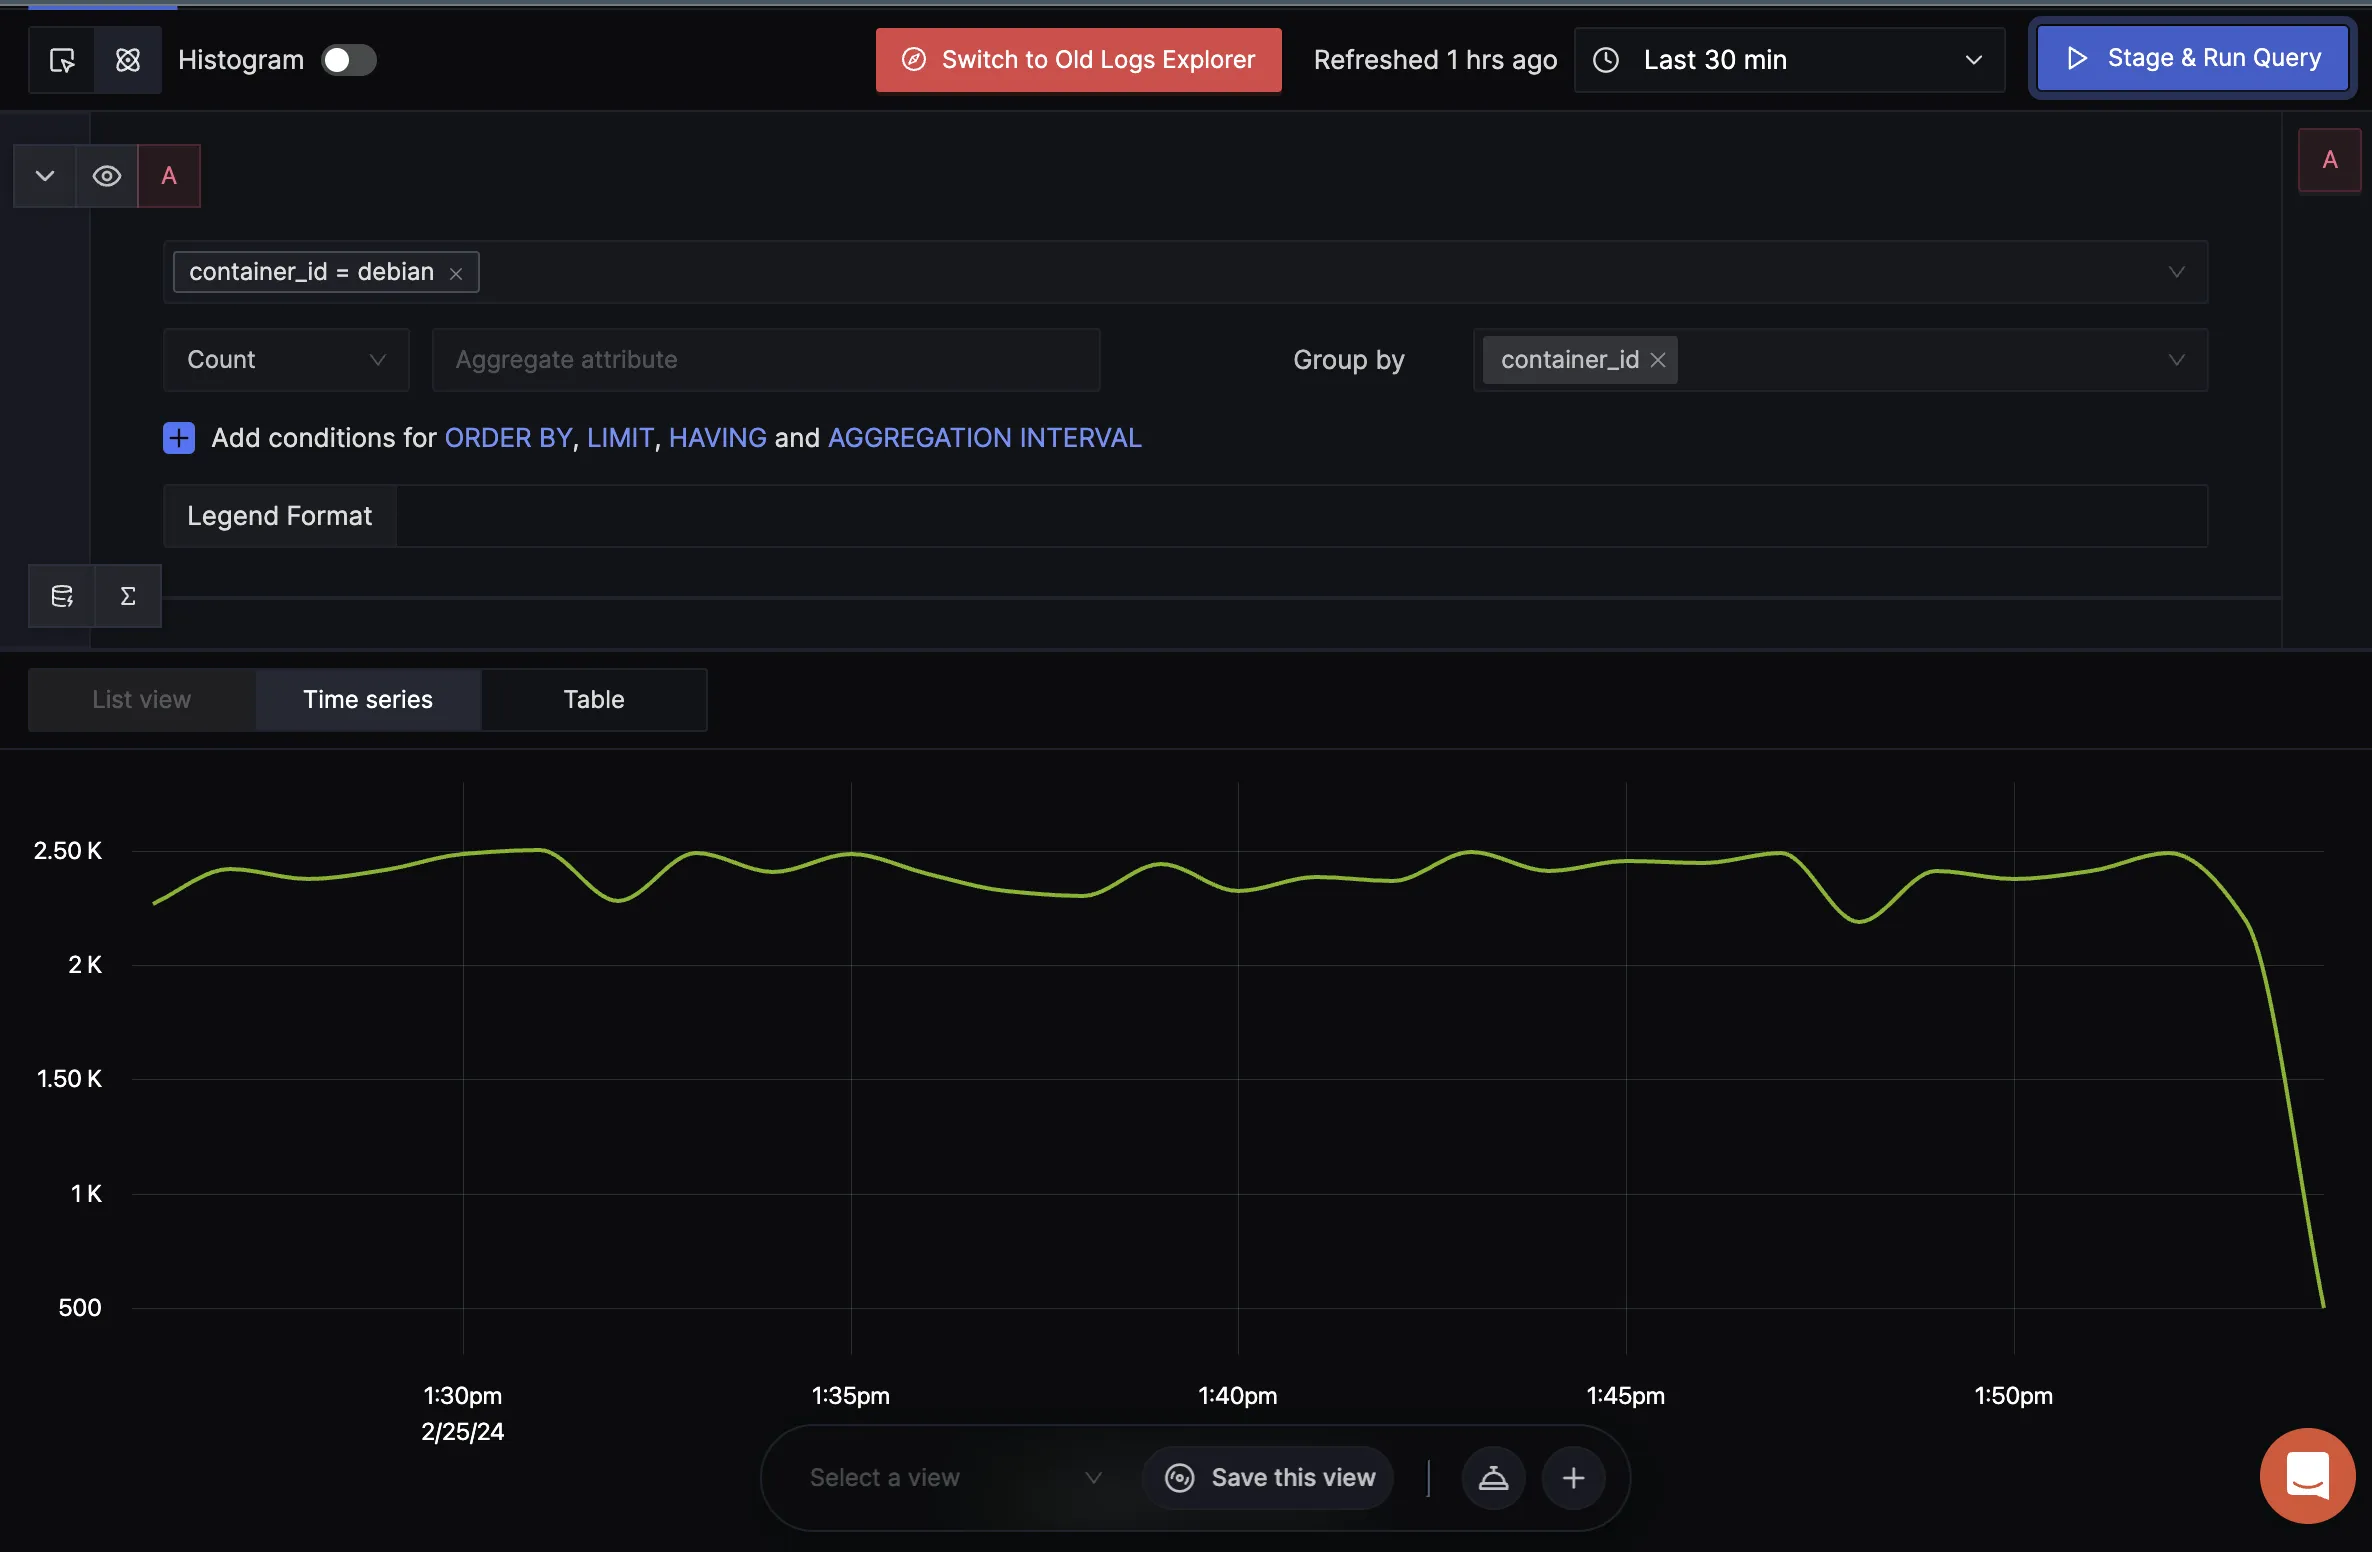
Applied countfunction on logs fromdebiancontainer id
Different Views in Logs Explorer
The logs explorer comes equipped with three different views:
List View: It shows all your logs in a list. You can also configure this view to see log data in three different formats: raw, default, and columns, which come in handy to skim through your logs quickly.
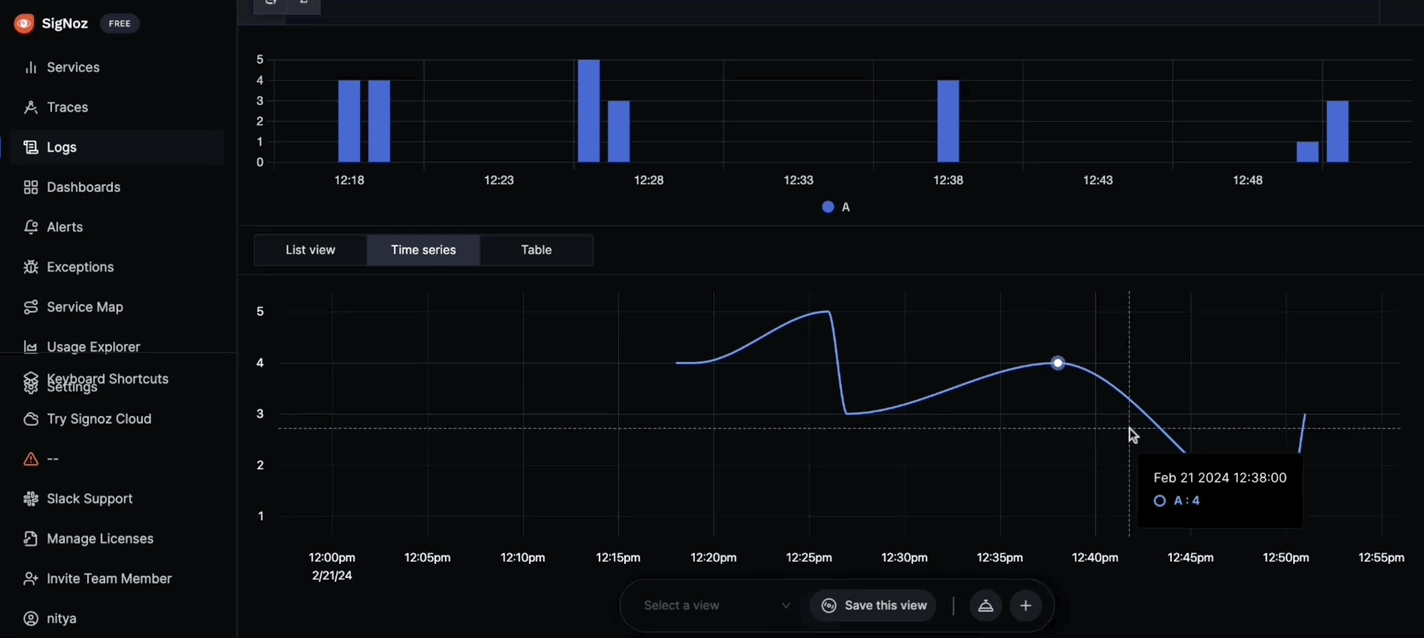
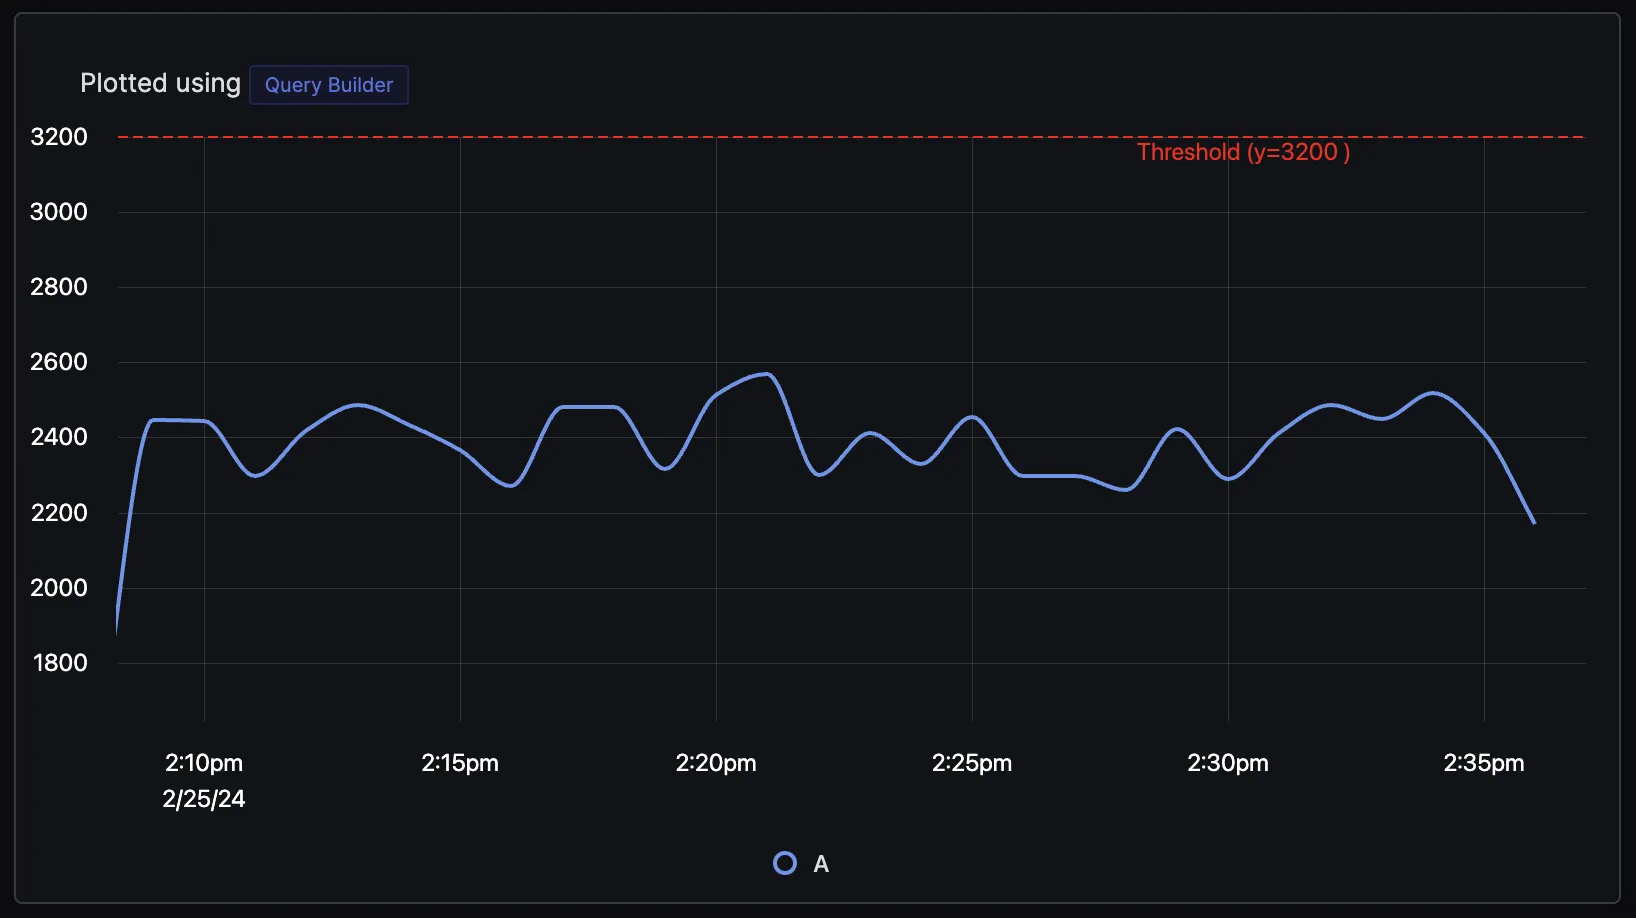
Time Series: The time-series view shows charts for any aggregations that you perform on your logs using the advanced query builder. You can also add these views as panels to any dashboard.
Table: It shows the aggregated value for the specified time range.
Features of SigNoz Logs Explorer
Correlation of Logs to Traces
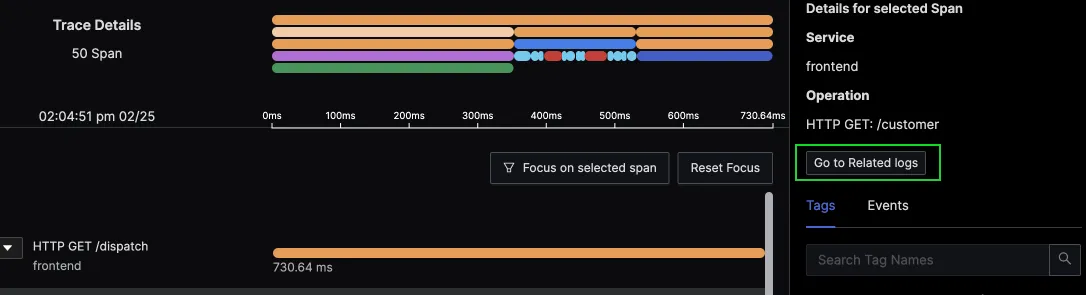
One of the greatest advantages of using SigNoz is the correlation of different signals. You can correlate your traces with logs that help in debugging performance issues quickly.
In the flame graph view of traces, you can click on a particular span to check out its related logs. You need to ensure that your logs contain trace identifiers while instrumenting your application to use this feature.
Filtering JSON logs directly
If the body of your logs is in JSON format, you can directly filter your logs based on any attribute present in the JSON logs. This makes it very easy to create search filters from json logs.
Create Dashboards & Alerts
You can add any time-series chart that you create using the logs query builder to dashboards. You can either add it to an existing dashboard or create a new dashboard. The Add to Dashboard button can be seen at the bottom of the screen. This makes it very easy to monitor your logs in SigNoz.
You will also get an option to Create Alerts directly from the logs explorer view. This makes it easy to create critical alerts from your logs data.
Saved Views
You might apply multiple filters or write advanced queries on your log data. If you want to access logs pertaining to the same query, then you can use Save this View feature. Saving a view with the filters applied will let you access it easily whenever you need it in the future.
OpenTelemetry’s Role in Logs Management
OpenTelemetry introduces a universal log model that defines a standard for log formats, including fields like timestamps, trace IDs, span IDs, resource attributes, and others. This standardization simplifies the process of collecting, processing, and analyzing logs from various sources and formats, making it easier for developers to implement and maintain observability practices.
You can also use the log model to map existing log formats to OpenTelemetry’s standard, which can help you standardize your log collection across your applications and hosts. Using OpenTelemetry, you can also correlate your logs with traces that can help developers troubleshoot issues more efficiently.
Solving Search at Scale with ClickHouse
At SigNoz, we use ClickHouse for storing logs. ClickHouse is a very fast columnar database. Below are a few features of ClickHouse that we are using for improving search at scale.
Materialized Views and Indexing: ClickHouse allows for the creation of materialized views and indexing of extracted log attributes. This feature speeds up queries by pre-aggregating data and providing faster access to indexed data, thus solving the first problem of quickly filtering and finding relevant log lines.
Handling High Cardinality Data: ClickHouse excels at managing high cardinality data, such as unique trace IDs, efficiently. High cardinality fields can pose challenges in databases by requiring extensive resources to index and search. ClickHouse's capability to effectively handle such data ensures that searches over logs, even with high cardinality attributes, are performed swiftly and efficiently.
Projections for Faster Searches(Upcoming): Projections in ClickHouse allows data to be rearranged to optimize for specific types of queries. By creating projections based on common query patterns, such as filtering by service name, ClickHouse can provide quicker search results, making the analysis of logs more efficient.
Design Considerations behind the New Logs Explorer
For a tool like SigNoz, which helps developers troubleshoot their applications, we optimize for developer productivity and not engagement. This is one of the key design philosophies behind revamping our Logs Explorer.
Some of the key things that we solved with the revamp are:
Make data filtering more intuitive
One of the key design goals was to make data filtering more intuitive. You will find the new design a lot more suited for querying your log data. For example, we have revamped the picker for time range selection to make it easier for users to filter logs over the required time range.
The new time picker lets you select your required time range easier with relative time section Increasing Data Density Without Sacrificing Usability
Recognizing the need for developers to view more log data at once, we aimed to make the interface more data-dense. However, we balanced this by ensuring that the added data did not overwhelm users or compromise the readability of logs.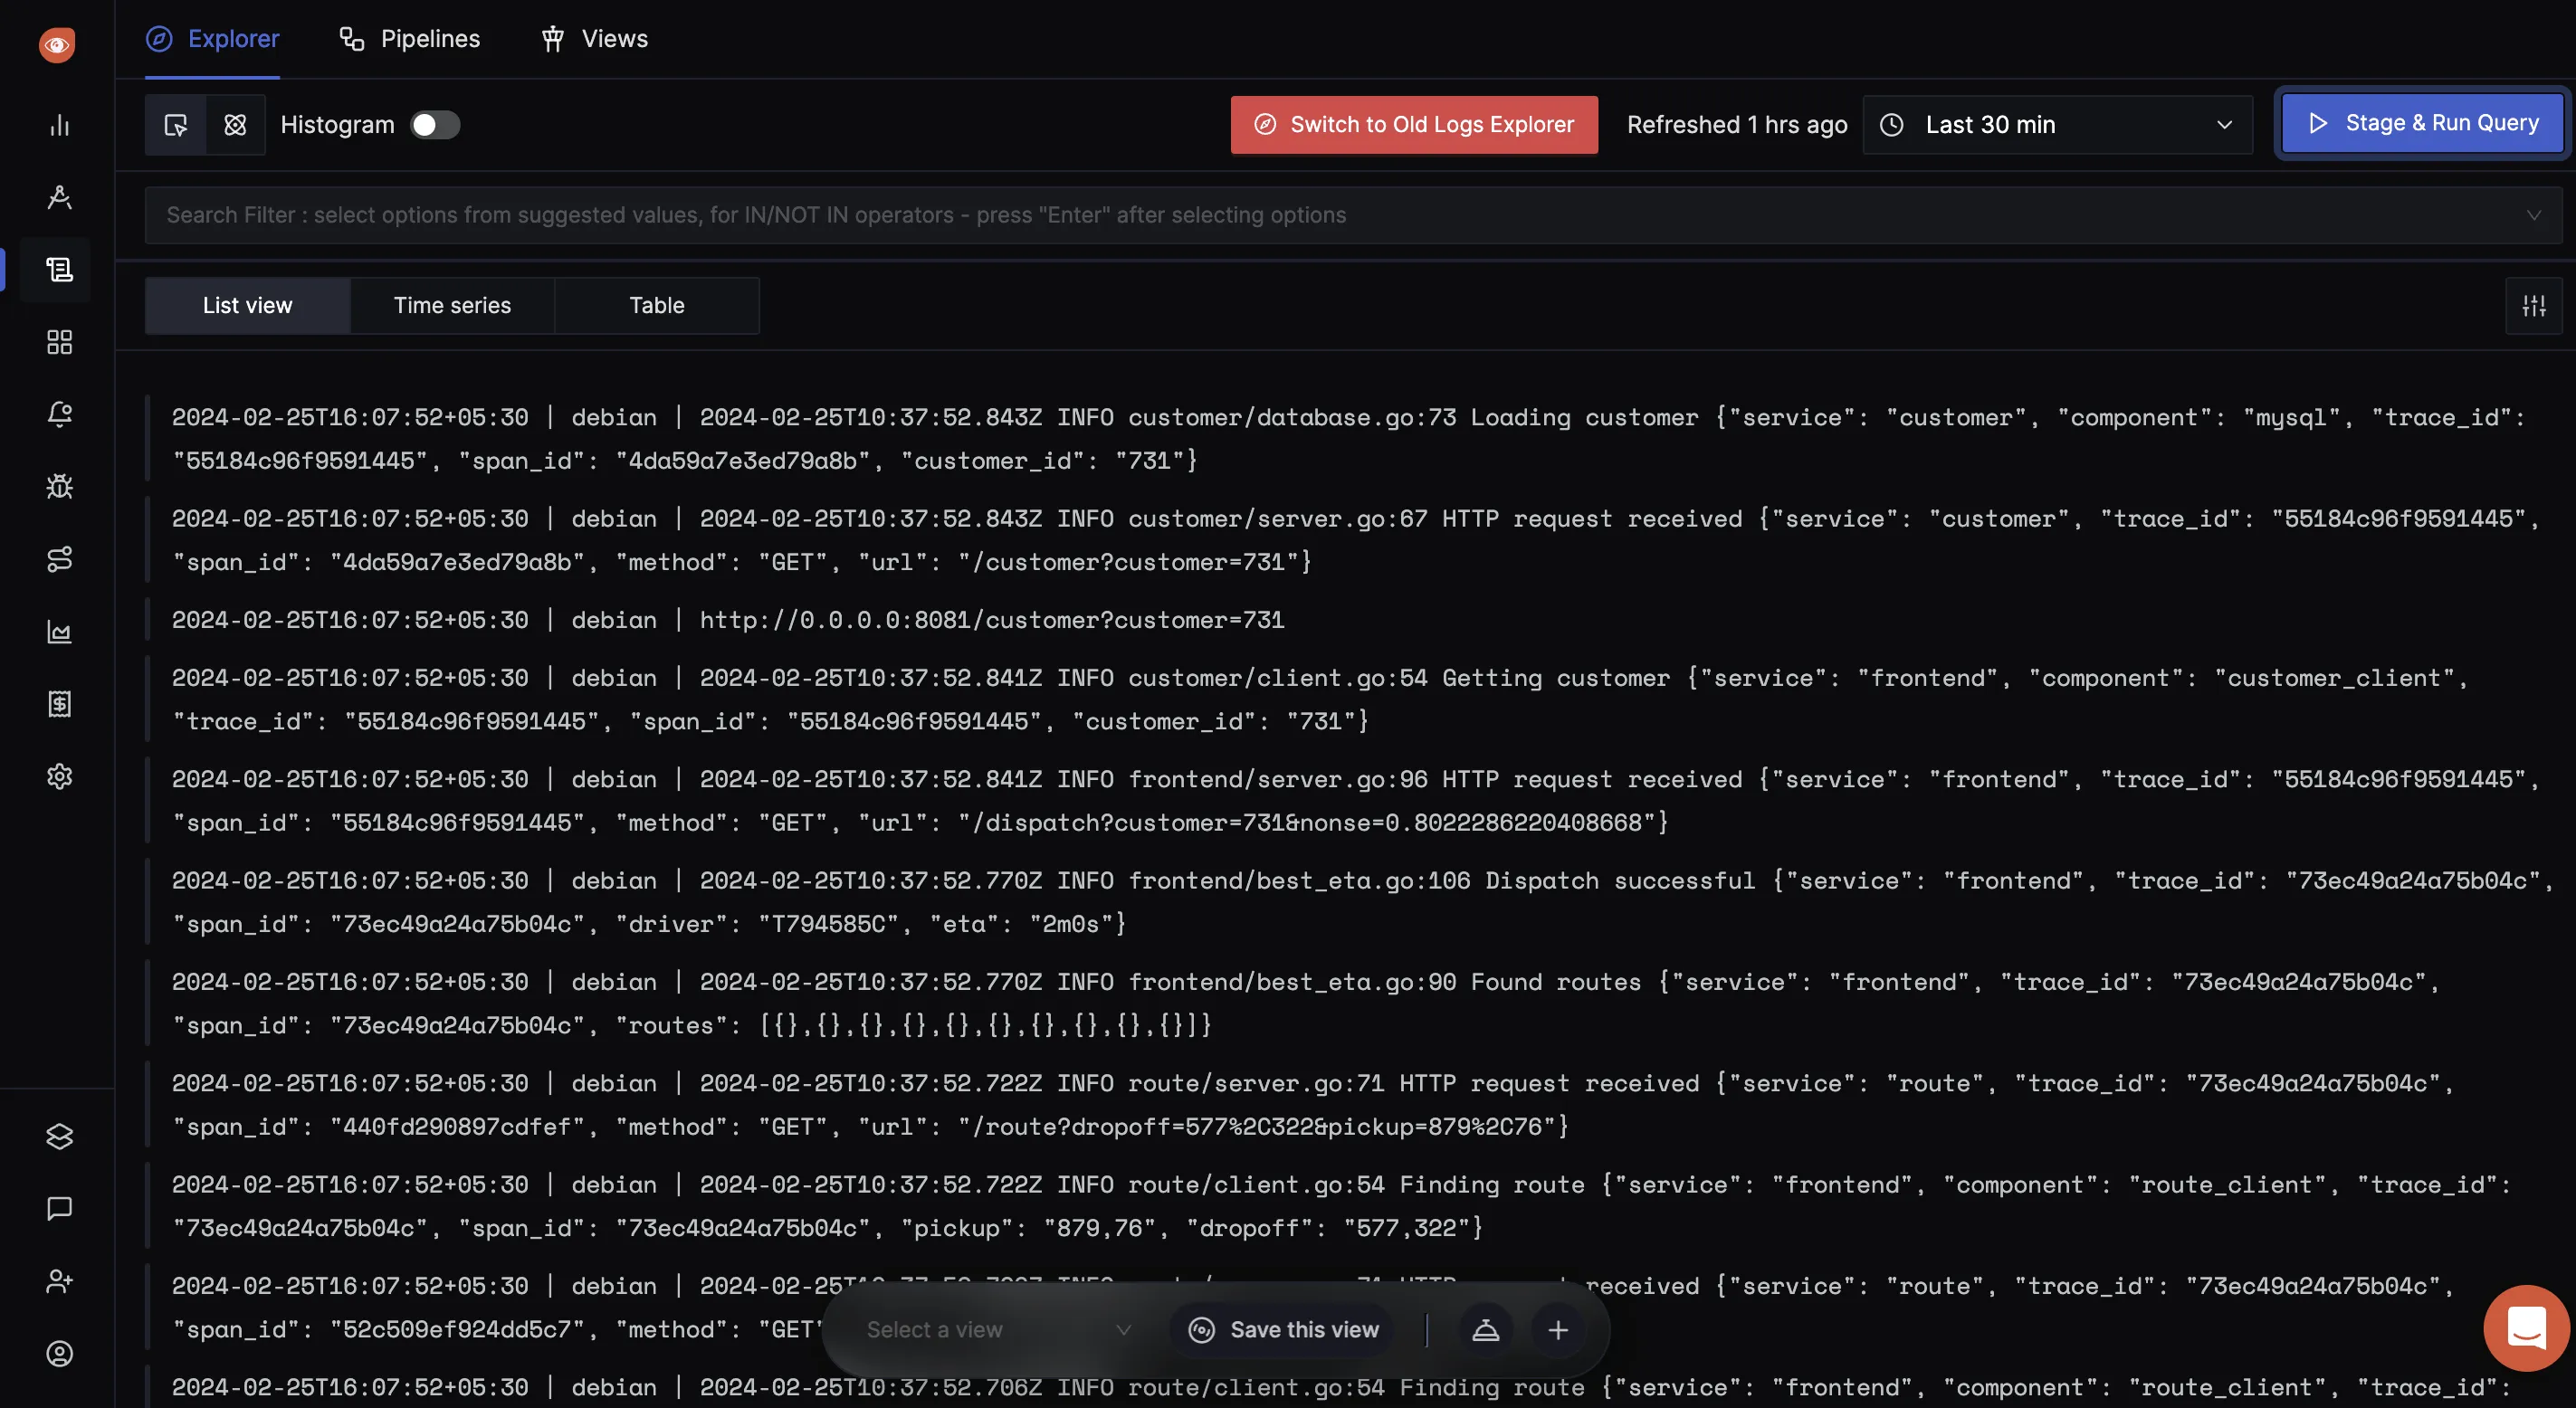
One of the design goals was to enable developers to see as much log data at once as possible Balancing Simplicity & Configurability
The user base of SigNoz is diverse. One area we focused on was balancing simplicity for new users with the need for advanced configurations for power users. This led to bifurcating the logs query builder into a simple search bar and an advanced query builder.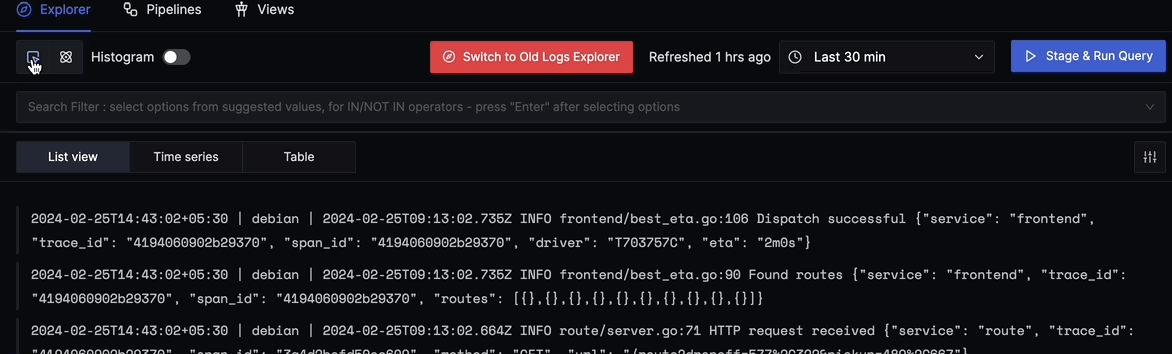
Simplifying Complex Information
There is a lot of detail associated with a single log line which developers need to consume quickly. Our new design includes a side panel for log details, which you can access by clicking on a single log line. The side panel provides enough space to include a lot of details about log lines while also segregating views for things like seeing logs in context.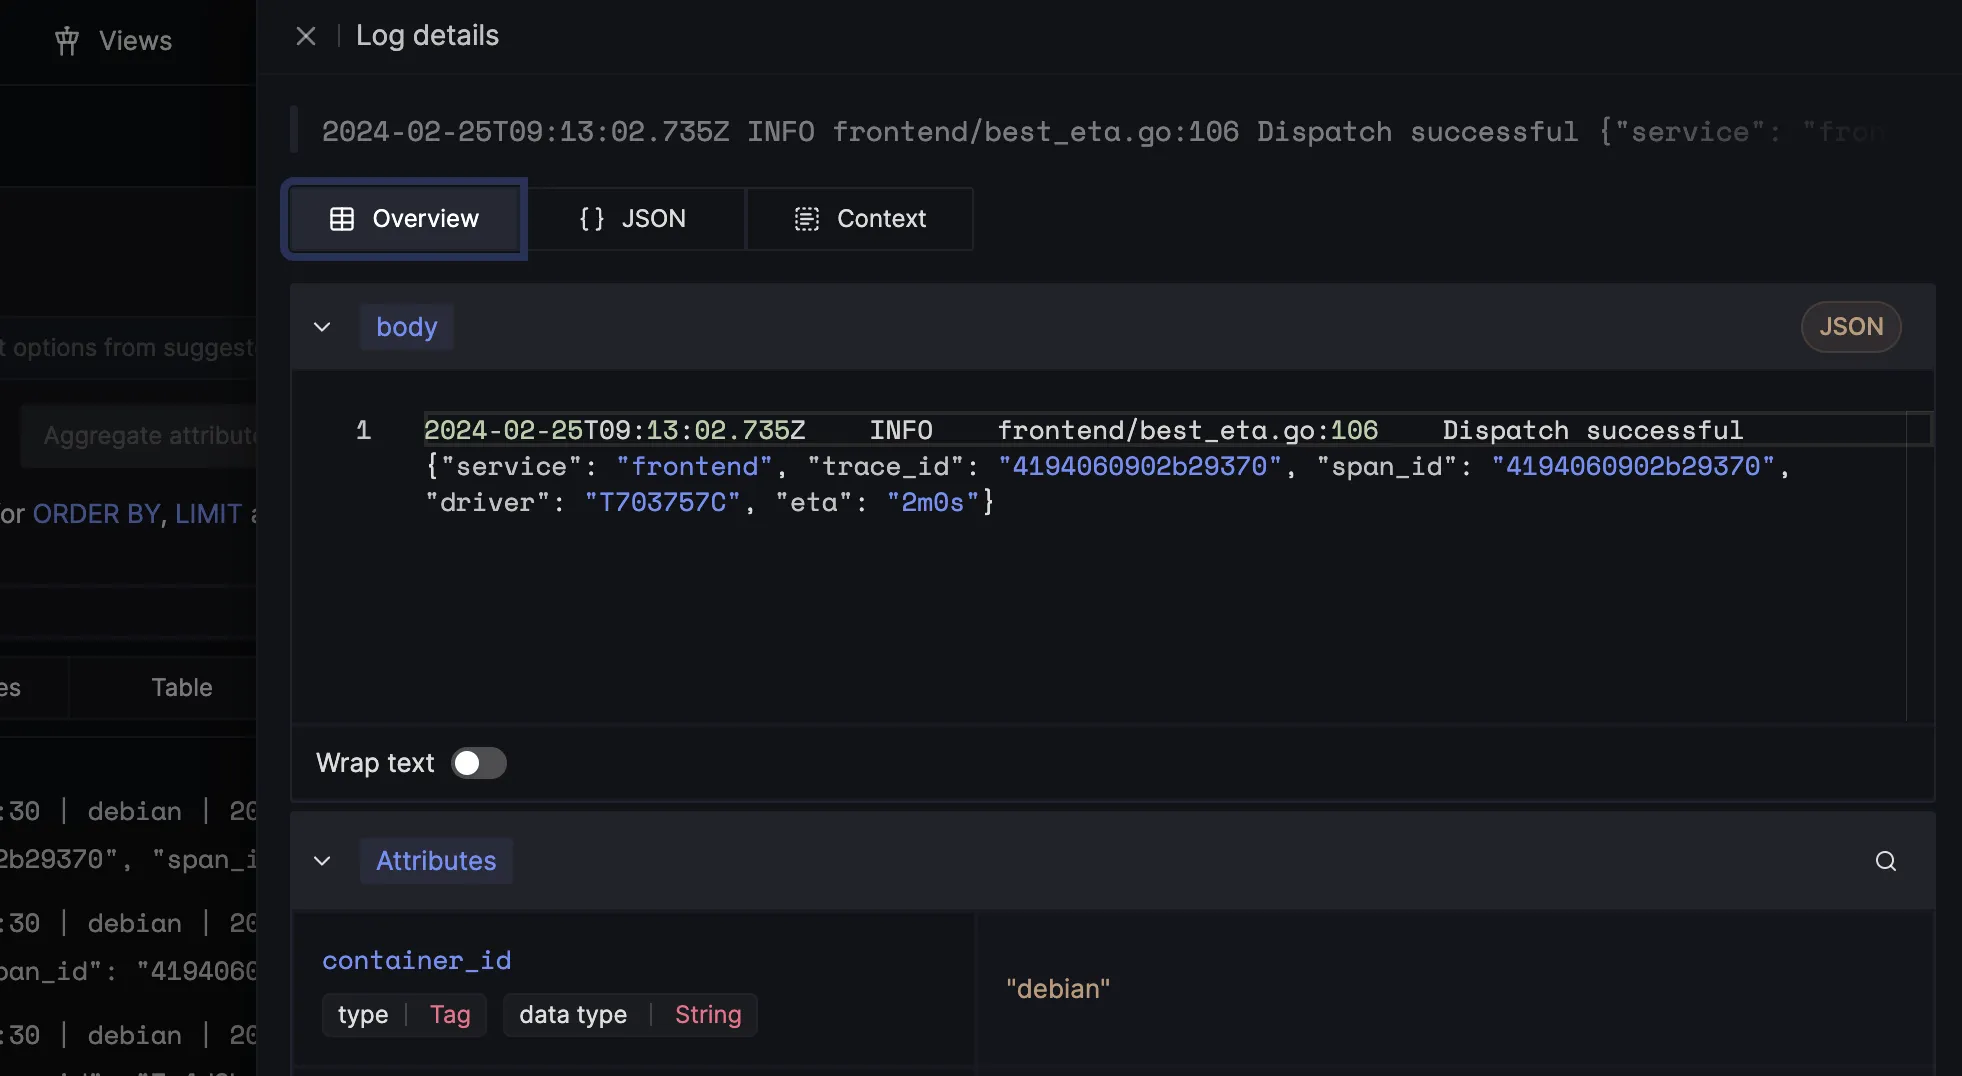
The side panel for logs creates enough space to show all details related to a single log line in a consumable format
Gathering Feedback for Design from Open-Source Community
One of the key advantages of SigNoz being an open-source project is that we can directly tap our open-source community for feedback. The first step for building any new feature is to go through issues opened by our open-source community.
We don’t have to reach out to users for feedback, and there is a lot of inbound feedback, which serves as a valuable guide for us when creating new designs.
What’s next?
On the design front, we will be working on revamping the way users interact with other signals in SigNoz, just like logs. A lot of design effort will also be on revamping the way users use dashboarding in SigNoz. Shuvam is working on pushing the boundaries of what shareable configurations can look like. We are also exploring ways to build on open standards for better compatibility with other tools.
Nitya will be working on further advancing searching through logs at scale. Log data can be humungous and one of our key focus is to enable quick log search at any scale. On that front, Nitya will be exploring projections in ClickHouse more deeply.


