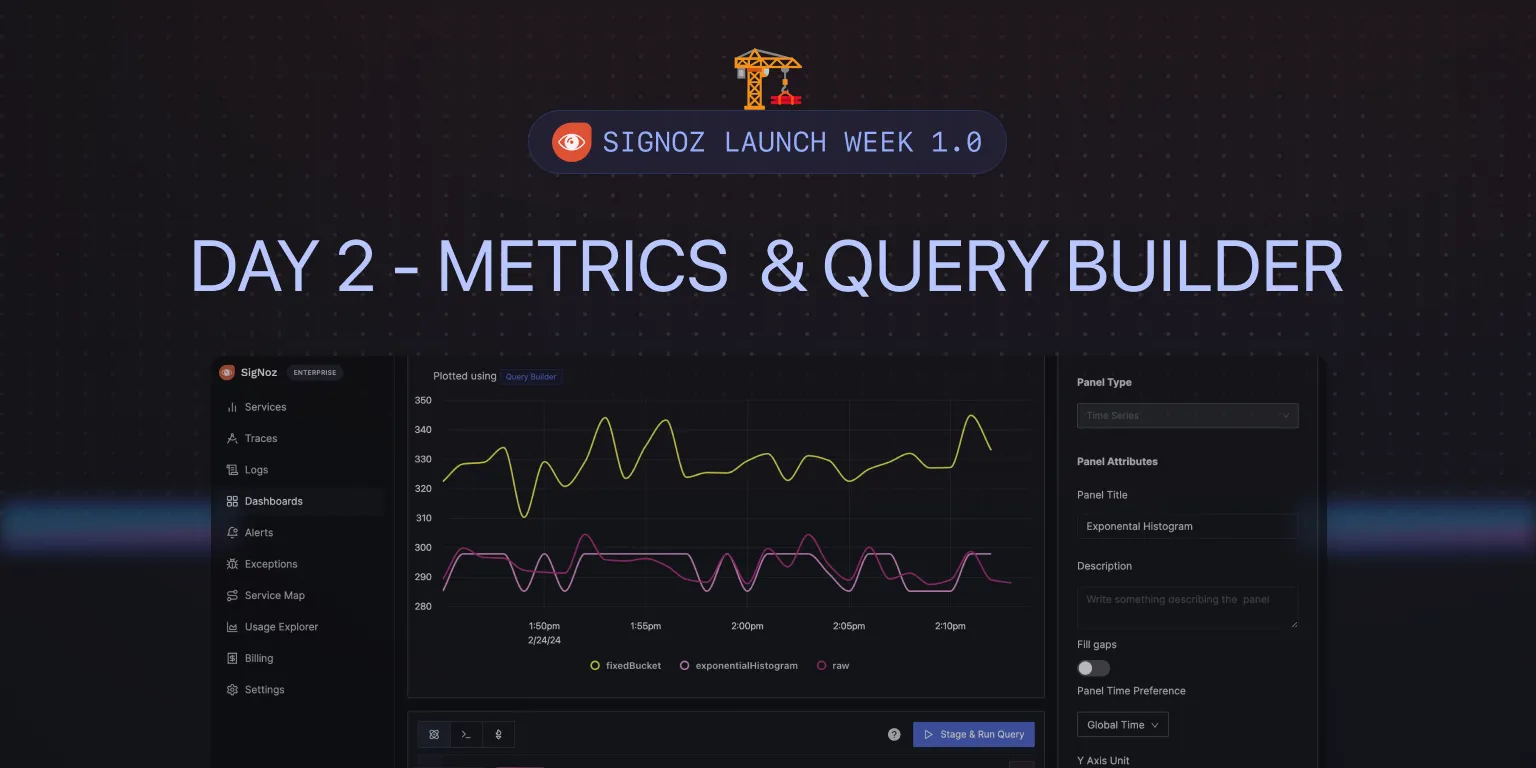
Feature in Spotlight: Metrics & Query Builder [Day 2] 📊

Maintainer, SigNoz
Welcome to SigNoz Launch Week Day 2!
Today’s feature in the spotlight is Metrics & Query Builder.
We have shipped some exciting features in our metrics & query builder to take metrics monitoring in SigNoz to the next level!
- Temporal and Spatial Aggregations
- Support for functions
- Exponential Histograms
- Support for Delta Metrics
The Builder - Srikanth Chekuri
Srikanth loves contributing to the open-source ecosystem. A core maintainer in various OpenTelemetry repos, he is currently leading the metrics signal at SigNoz.

Temporal and Spatial Aggregation
In SigNoz metrics query builder, we have introduced temporal and spatial aggregations for metrics data.
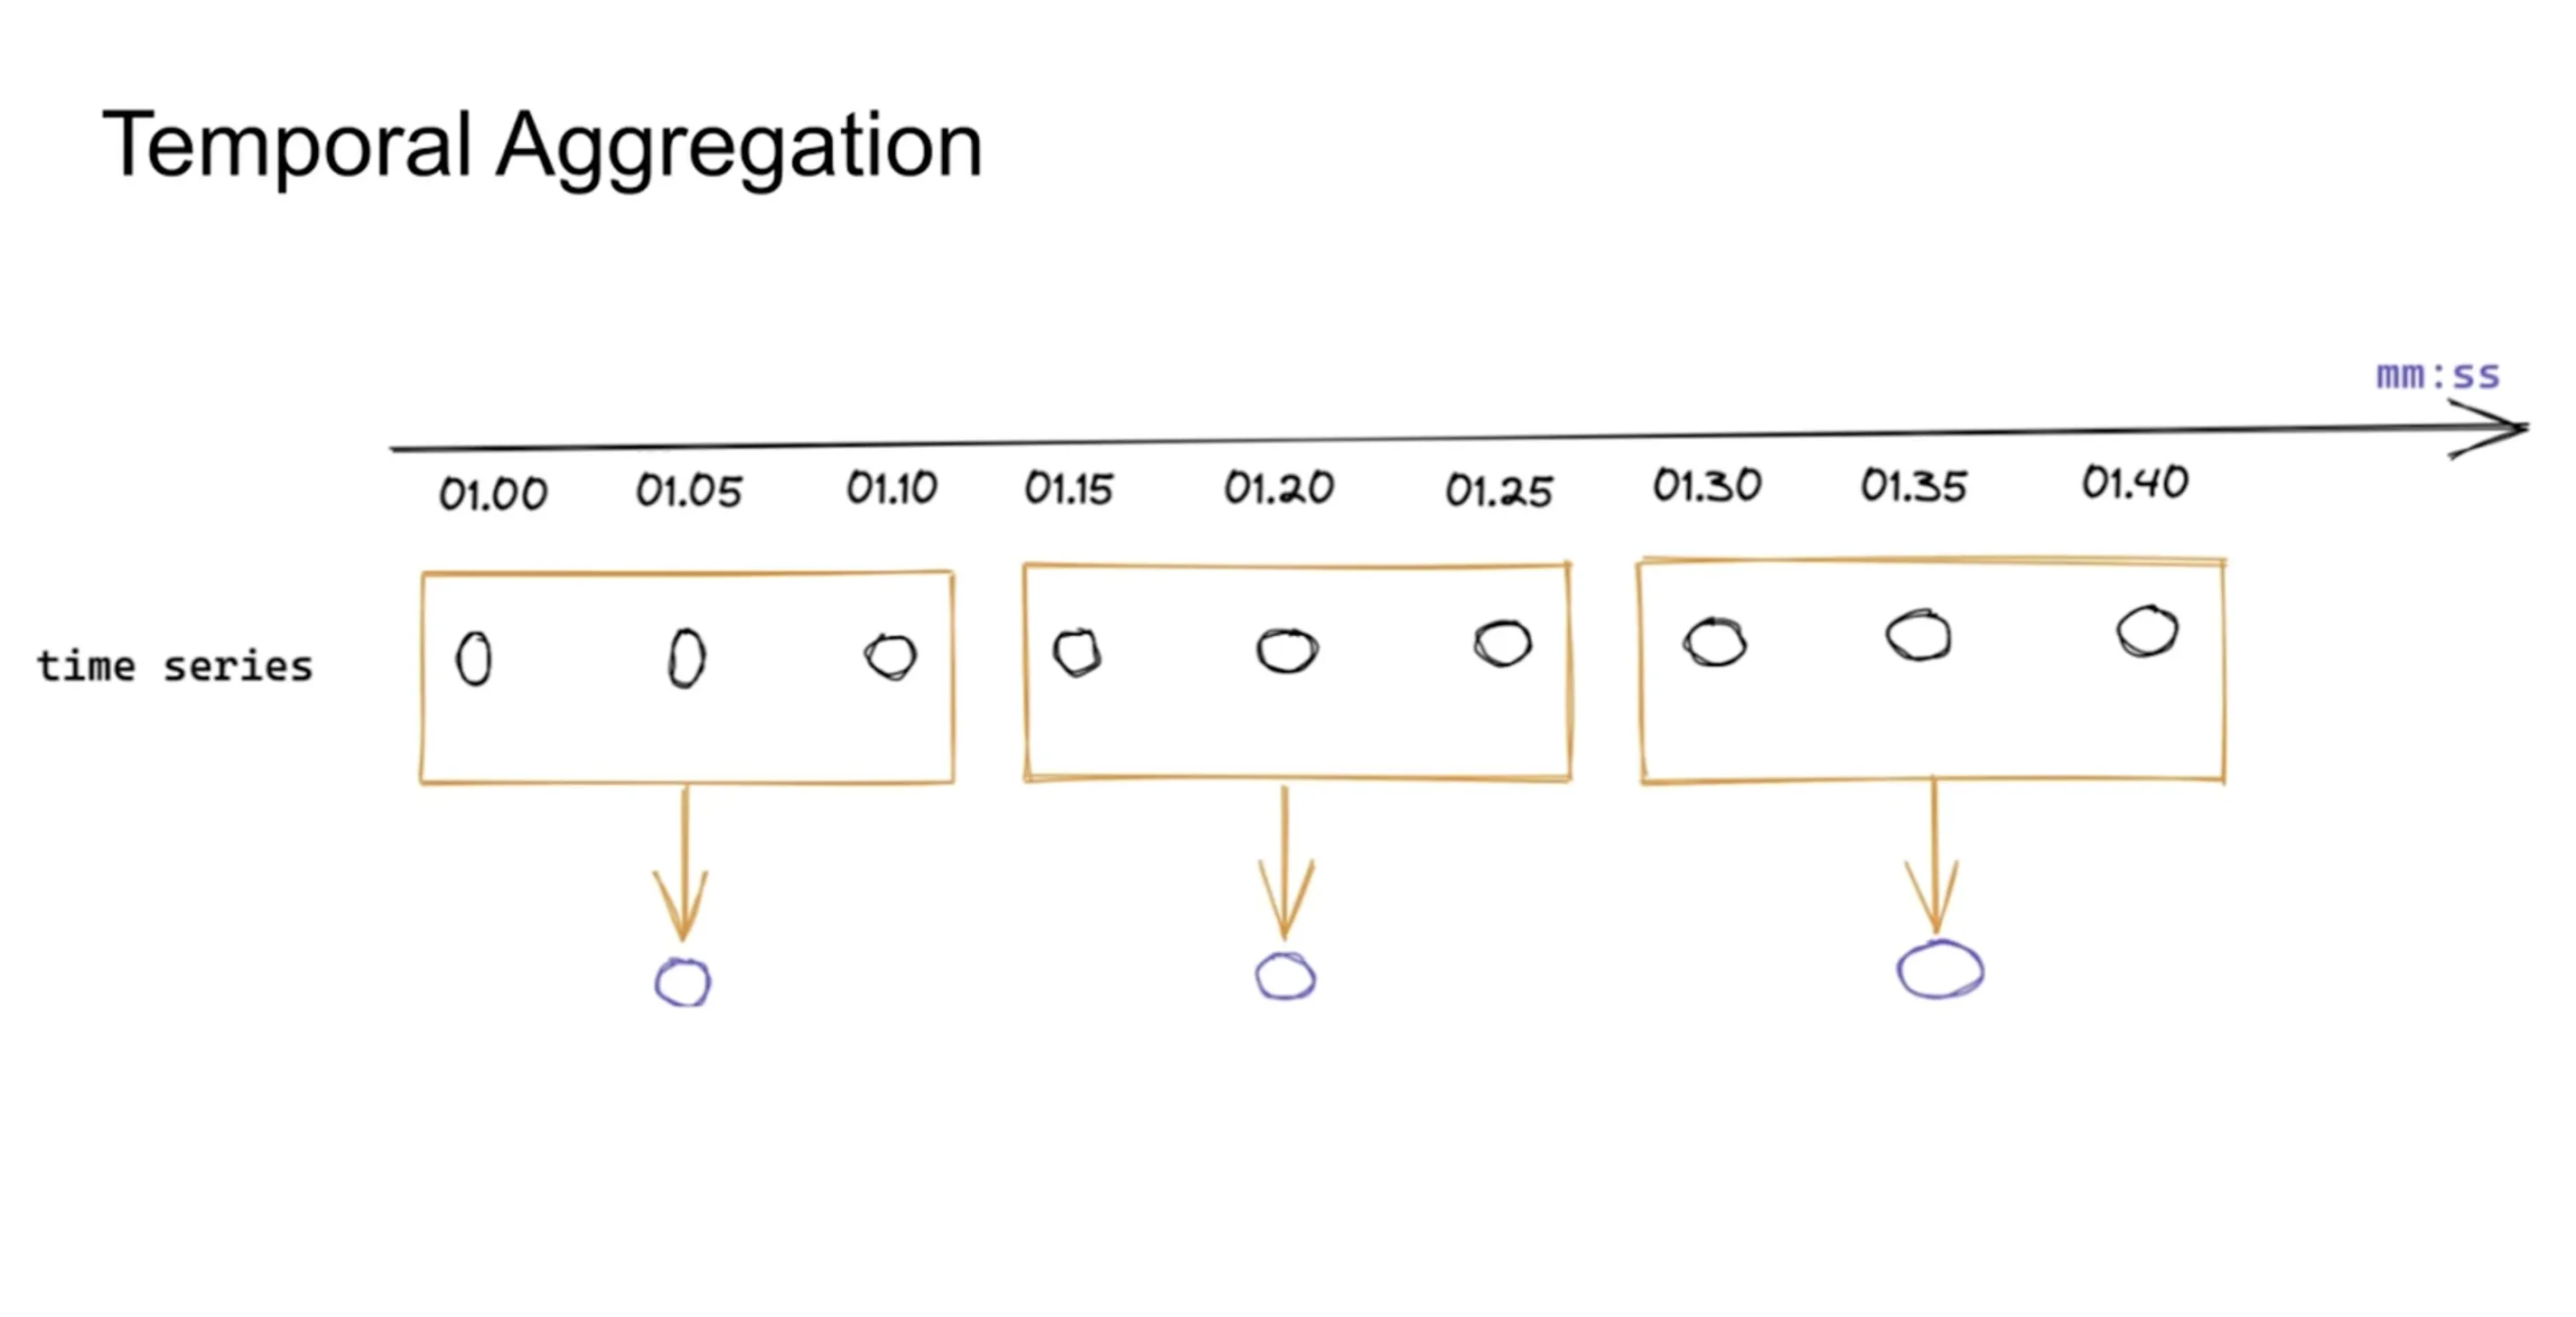
Temporal Aggregation
Temporal aggregation is a method of condensing metric data over time to streamline analysis and visualization. It's essential for managing data from applications that transmit metrics at regular intervals, helping to reduce the volume of data points into a more interpretable format. This aggregation is particularly crucial when dealing with long-term data visualization, where displaying each data point is neither practical nor informative due to limited screen space.
In the diagram below, you can see a time series that produces data at an interval of 5 seconds. It might not be possible to visualize the time series in a 5-second interval. With temporal aggregation, you can reduce the number of data points by taking an appropriate aggregation over the time axis. For example, if the below time series is about memory usage, you can take the average of values over 10s intervals rather than 5s.
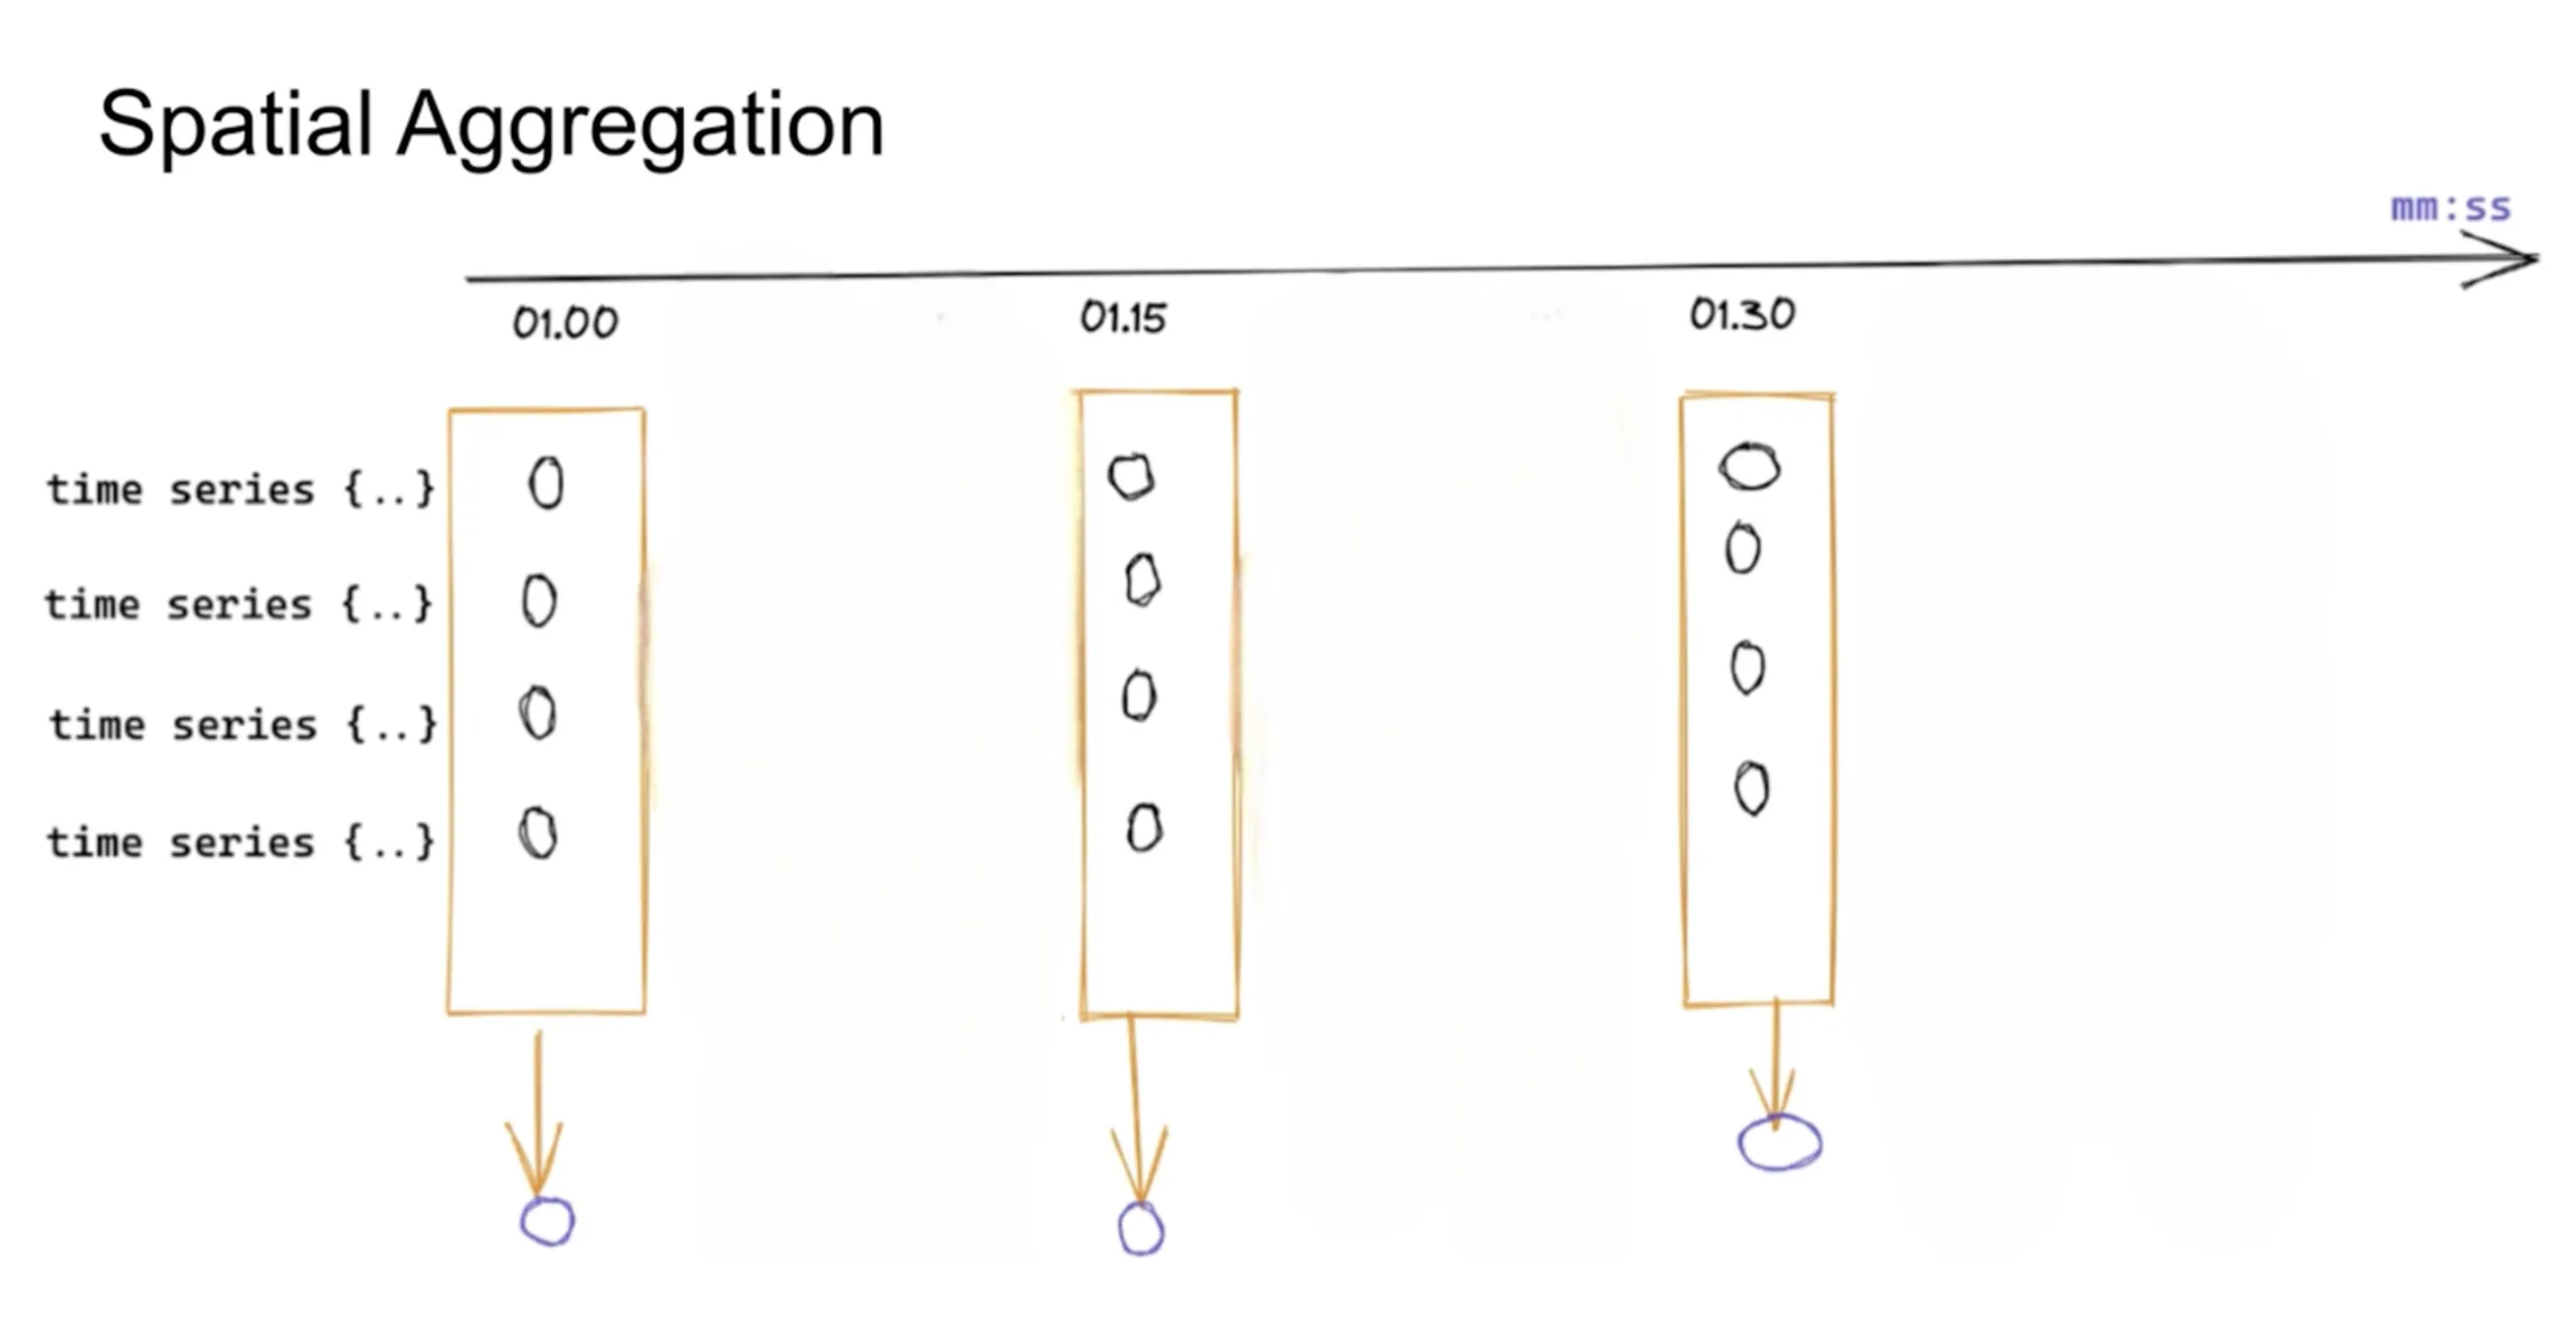
Spatial Aggregations
Modern applications are distributed, and there will be many time series across dimensions such as container names, service names, etc.
While temporal aggregations are meant for reducing data points across a single time axis, spatial aggregation refers to the technique of merging metric data across various dimensions or labels, such as container names, service names, or geographical regions.
In the below diagram, let’s suppose there are 4 time series representing request counts from 4 different hosts. With spatial aggregation, you can look at total request counts across all hosts.
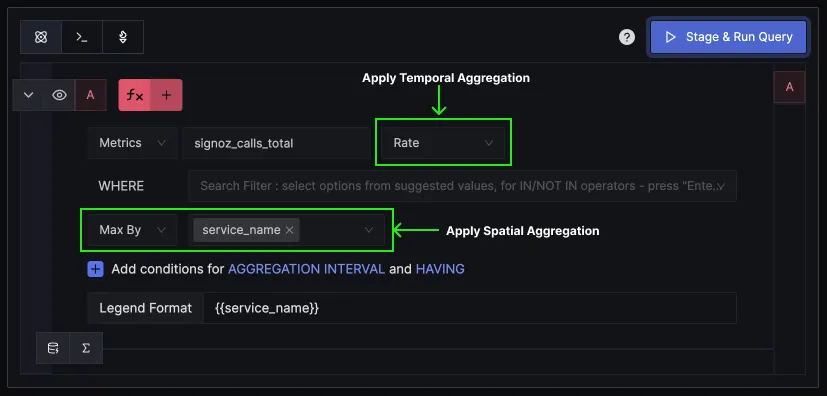
How Temporal and Spatial aggregation work in SigNoz?
We have enabled temporal and spatial aggregations in our metrics query builder. Based on the metric selected you can see options for different types of aggregations that can be applied to it.
For example, if you select a counter metric called signoz_calls_total, you can apply temporal aggregations like Rate and Increase on it. Similarly, you can apply spatial aggregations across many dimensions, such as service_name, operation, deployment_environment, etc.
Support for functions
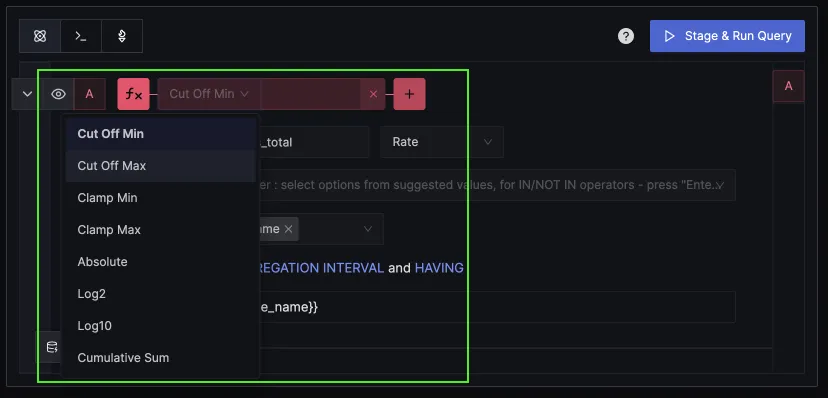
We have added support for four kinds of functions in the metrics query builder to extend its data analysis capabilities:
-
Exclusion Functions: These allow users to exclude data points based on certain conditions, such as values falling outside a specified range. This helps in focusing on the most relevant data.
-
Arithmetic Functions: Users can perform mathematical operations on data points, enabling the customization of metric calculations to suit specific analysis needs.
-
Smoothing Functions: To deal with volatile data, smoothing functions can be applied, such as moving averages, which help in identifying underlying trends by reducing noise.
-
Time Shift Functions: These functions enable comparisons of data across different time periods, useful for analyzing trends, changes, or anomalies over time. The input for this function is a time shift value in seconds. For example,
Time Shift 3600will shift the series by 1 hour.
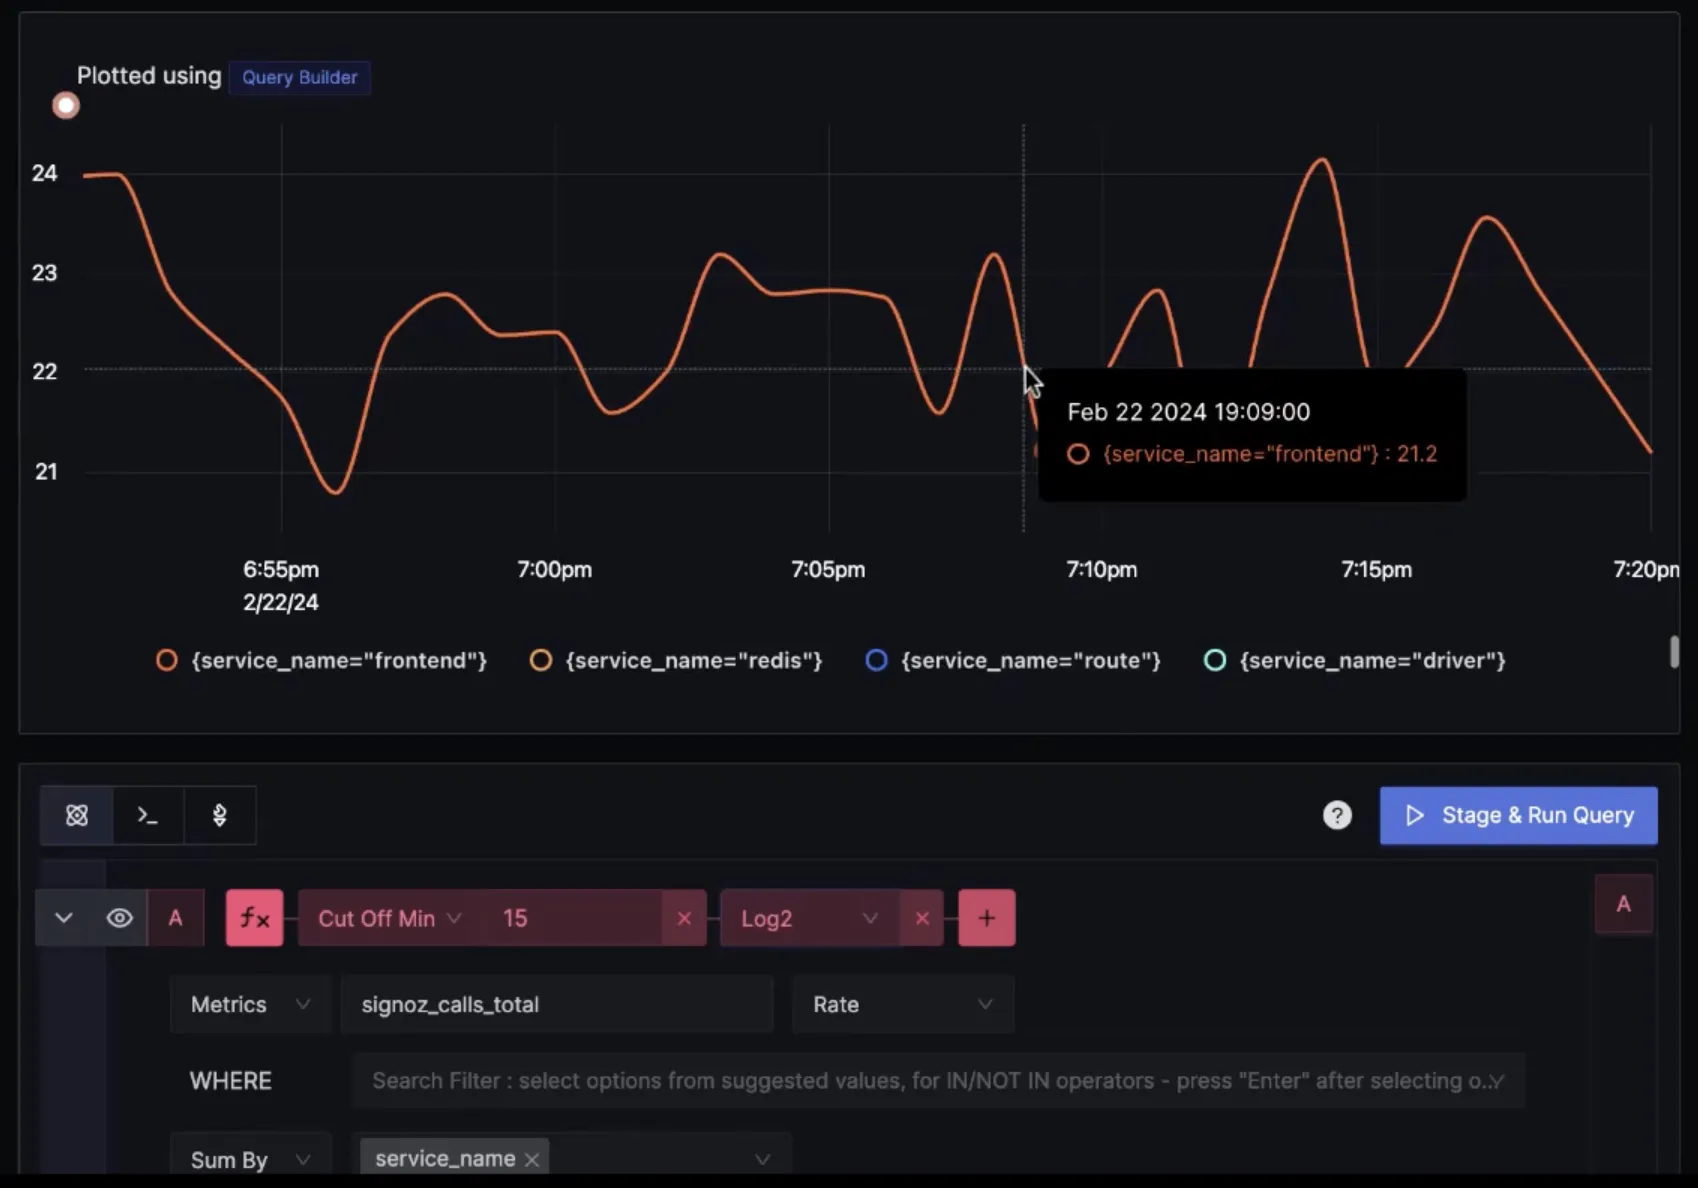
You can use functions for things like reducing visual noise.
You can also chain two functions together.
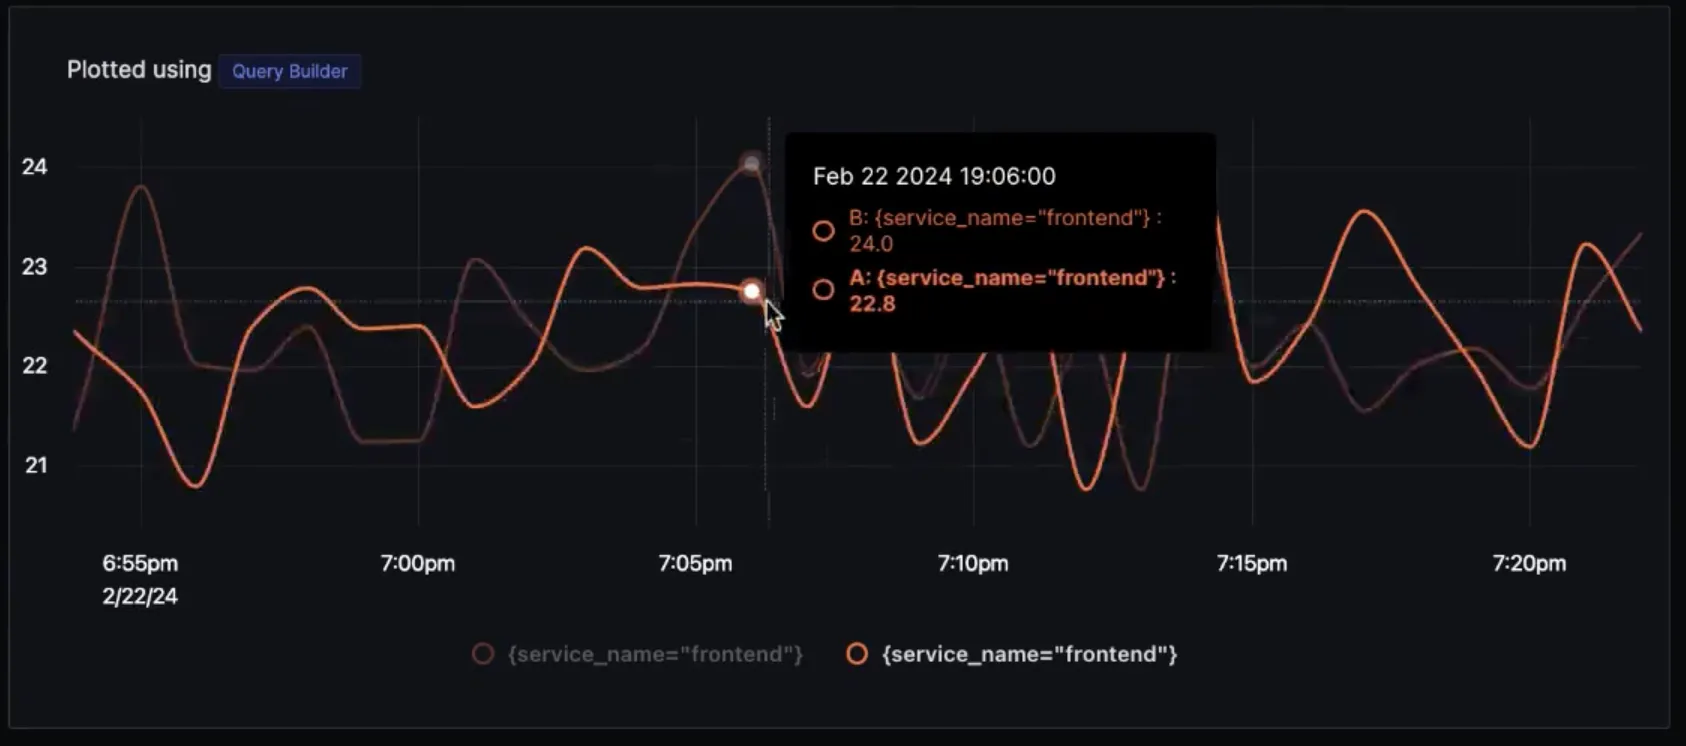
Below is an example of using the Time Shift function to compare total calls for frontend service in an interval of 1hr.
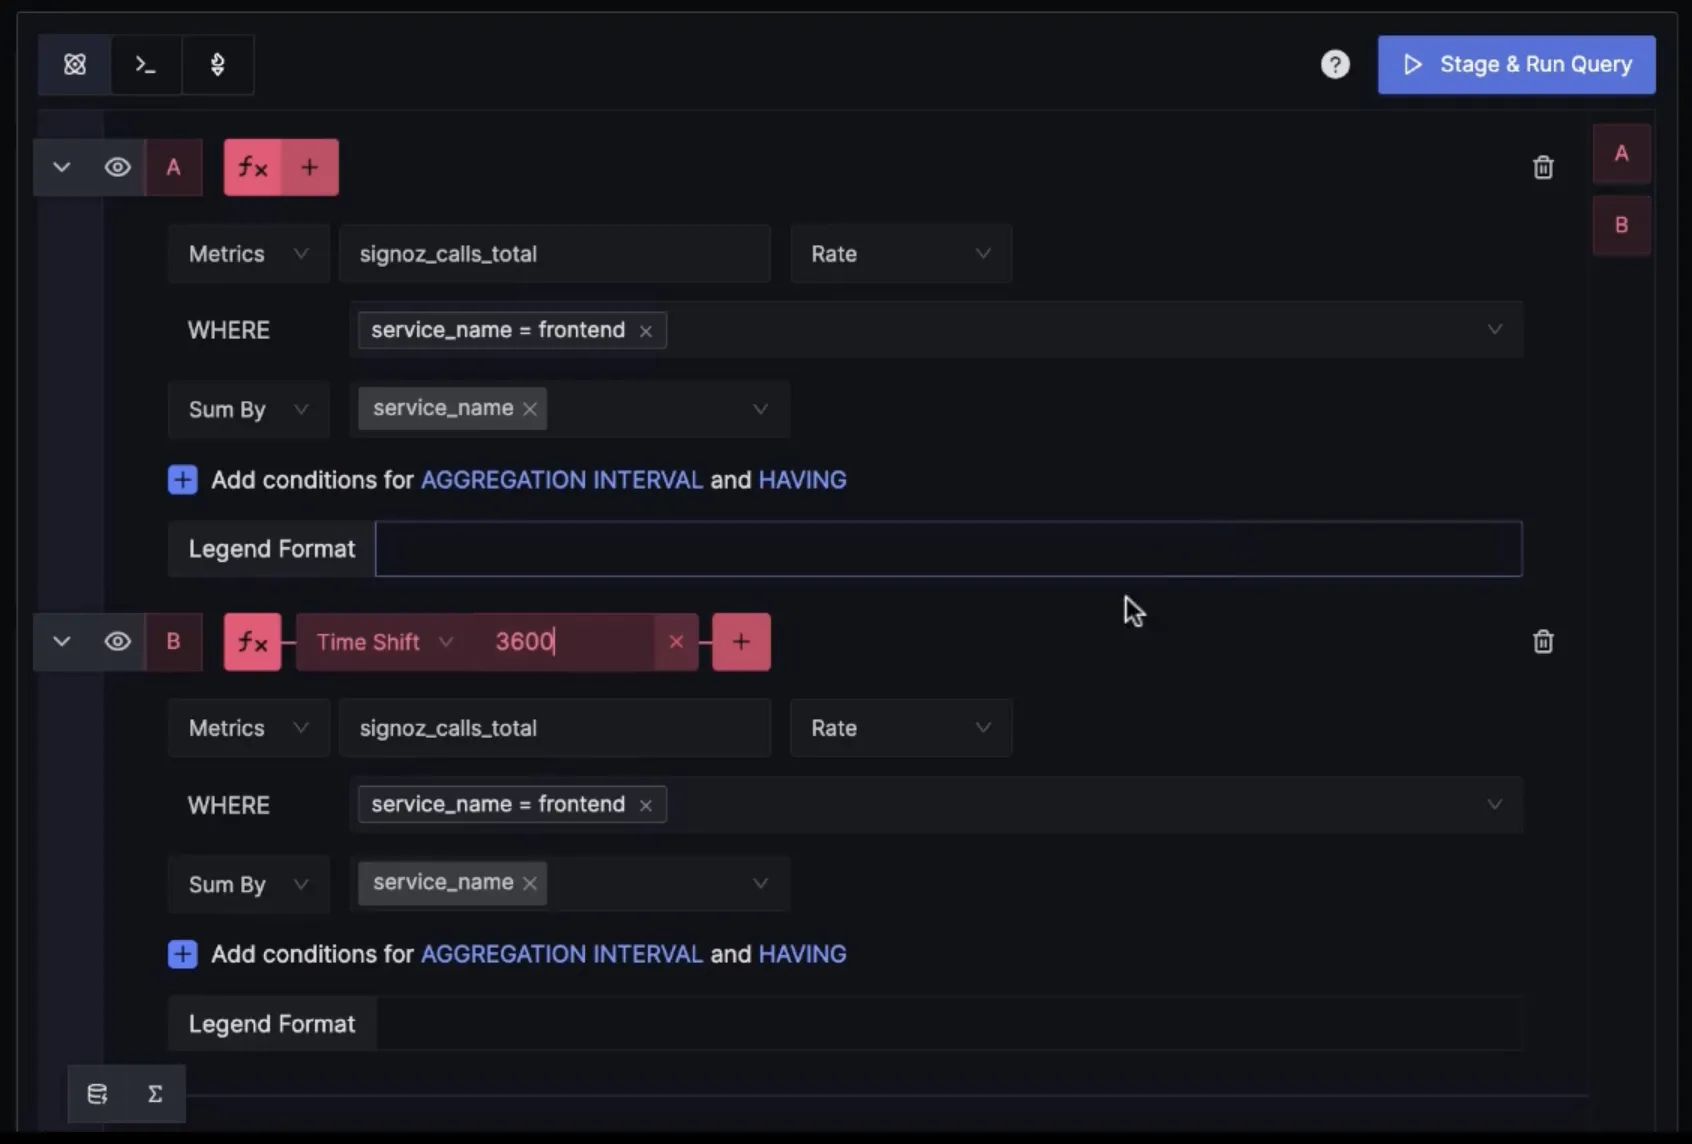
You can plot charts for the same service an hour apart.
Users can use the time shift function for very practical use cases, like comparing performance metrics before and after a deployment.
Exponential Histogram
Exponential histograms are a data structure used for efficiently summarizing distribution data, particularly useful in performance monitoring and analysis for capturing metrics like latencies or sizes. Unlike traditional histograms that use fixed-size buckets to group data points, exponential histograms employ buckets whose sizes grow exponentially. This allows for a more compact representation of data across a wide range of values with varying densities.
The key concept revolves around the "scale" factor, which determines the growth rate of bucket sizes. As you move to higher values, the bucket boundaries increase exponentially, allowing the histogram to maintain higher precision for lower values while still covering larger values without requiring an excessive number of buckets. This results in more efficient storage and faster queries, which is especially beneficial for capturing high-resolution data over large datasets.
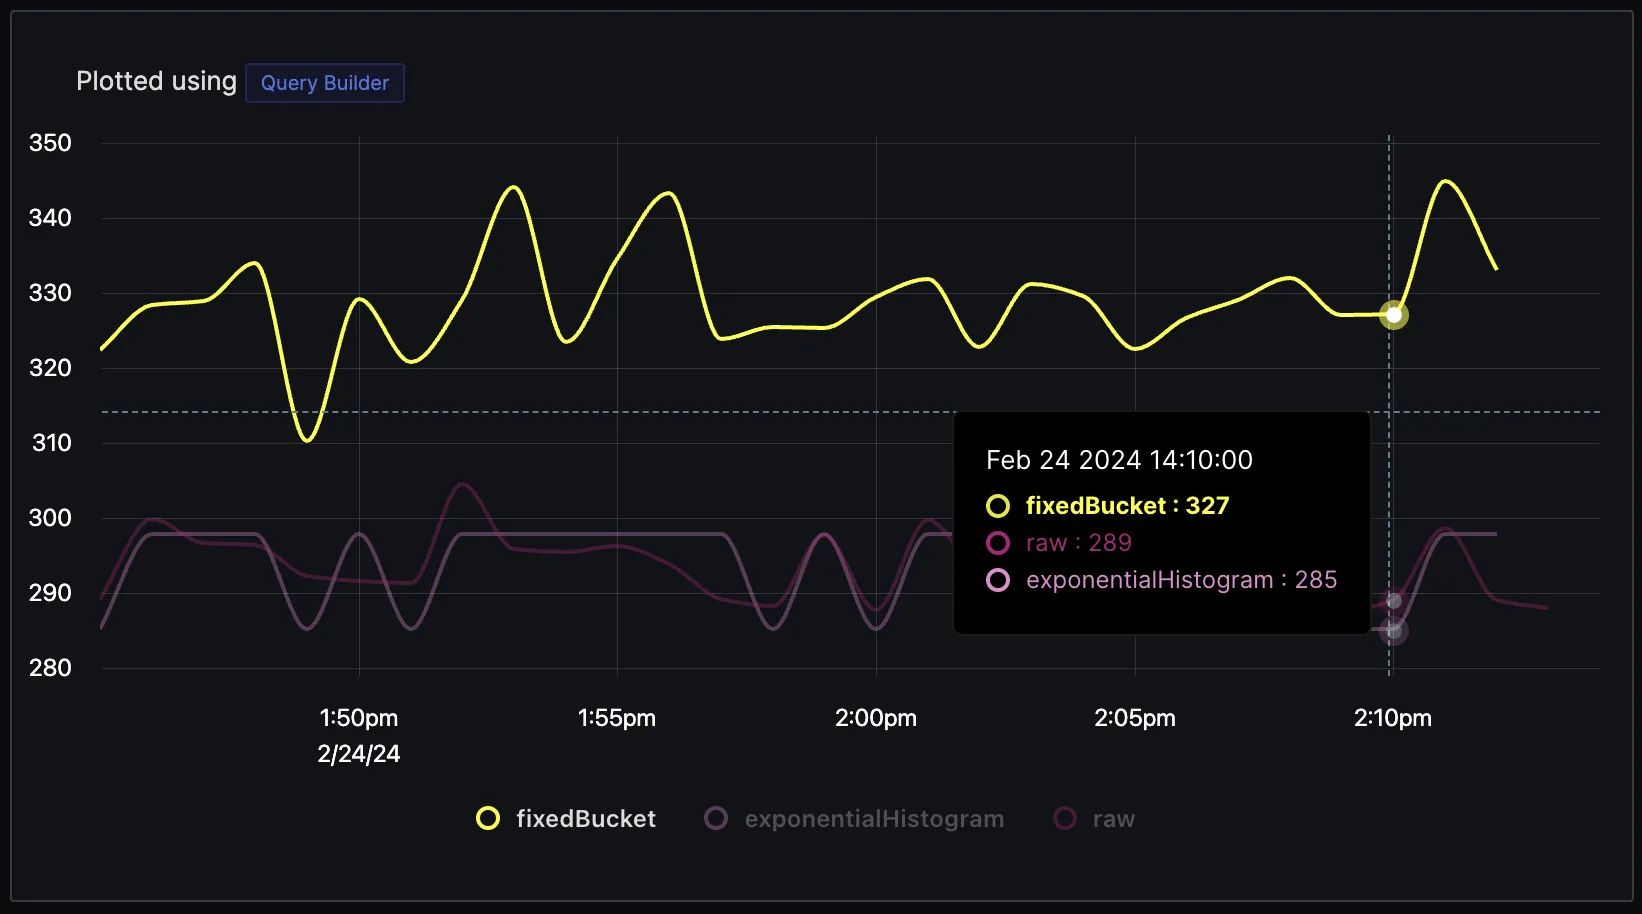
In SigNoz, we have enabled exponential histograms for metrics such as latency. Below is a graph plotted for latency using:
- Raw values (calculated from trace data),
- Fixed Buckets Histogram, and
- Exponential Histogram
As you can see, the values of the Exponential histogram have a much lesser delta(-4) from raw values compared to the delta of fixed bucket histograms(+38).
The major benefit of using an exponential histogram is that it maintains the accuracy of critical data points like latency. If you have SLA commitments around latency, you would want your delta from raw values to be a minimum. However, storing raw values for latency can be costly for users. Using an exponential histogram, you can have your values close to raw data while still saving on storage costs.
Support for Delta Metrics
SigNoz now supports delta metrics. You would need to enable it with a flag while running the query service.
Delta metrics, which report changes over specific intervals, offer a lower memory footprint and simpler aggregation compared to cumulative metrics, which track total counts over time. This makes delta metrics more efficient and straightforward for real-time monitoring and analysis, as they avoid the need for complex calculations to derive incremental changes.
Delta metrics have an advantage over cumulative metrics with regard to compute cost, too.
Imagine monitoring the number of visitors to a website. With cumulative metrics, you might record the total number of visitors from the launch of the website, which continuously increases. To find out how many visitors came in the last hour, you need to subtract the total count at the beginning of the hour from the total at the end of the hour.
With delta metrics, you only record the number of new visitors within each hour. There's no need for subtraction because each hour's metric directly represents the new visitors in that timeframe. For systems processing vast amounts of data, using delta metrics means less computational work and complexity.
A disadvantage of using delta metrics is their vulnerability to data loss. Since delta metrics represent data changes within specific intervals, any missed collection or transmission of these metrics (due to network issues, system downtime, etc.) can result in permanent loss of information for those periods. This contrasts with cumulative metrics, where a single current value can still provide insight into the total count up to that point, allowing for some degree of error recovery or estimation of lost data through interpolation.
What’s next?
The next big thing in metrics is enabling integrations for getting metrics data quickly from a wide variety of sources. We want to enable our users to get data from various sources easily, and integrations will streamline the process of collecting, analyzing, and visualizing data from different applications, databases, and infrastructure components.
Features in Spotlight:


Was this page helpful?
Your response helps us improve this page.
