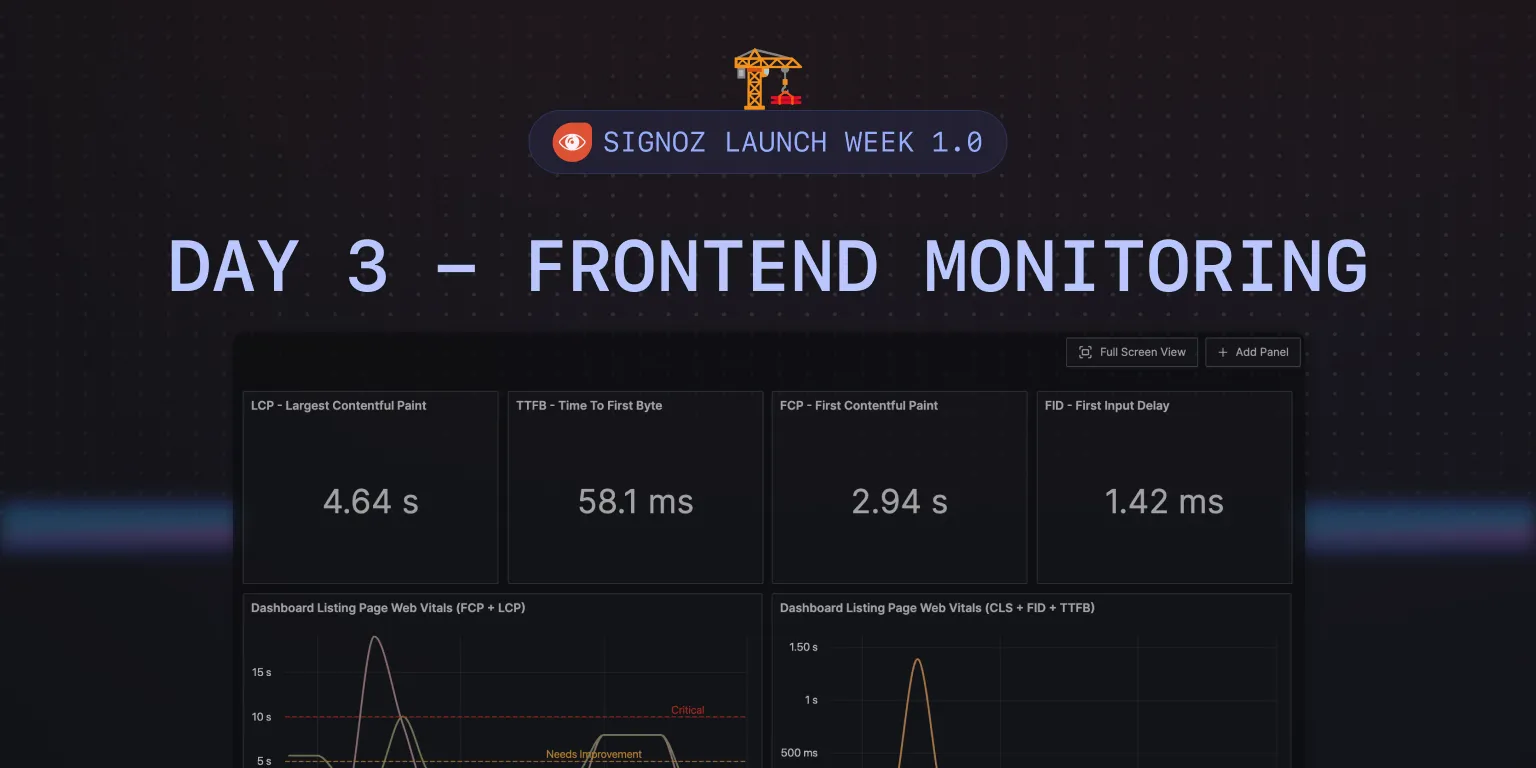
Feature in Spotlight: Frontend Monitoring [Day 3] 🧬

Maintainer, SigNoz
Welcome to SigNoz Launch Week Day 3!
Today’s feature in the spotlight is Frontend Monitoring with SigNoz.
Frontend monitoring is a very popular topic in our open-source community. So we wanted to dedicate a day to what you can accomplish in frontend monitoring with SigNoz.
Builders - The Frontend Team
The frontend team of SigNoz, comprising of Yunus, Rajat, and Vikrant are the brains behind all the colorful data-intensive charts and graphs of SigNoz. Building the frontend of an observability product like SigNoz is a unique challenge with millions of data points and querying involved. And Yunus, Rajat and Vikrant have taken this challenge head-on.

Why is Frontend Observability Important?
Frontend observability will help you identify any performance issues or errors that are not reported to the backend. Having a working frontend is critical for a good user experience, and things like UI crashes can impact the business of any digital company.
Identifying areas of improvement with a robust observability setup can go a long way in improving the overall user experience. It also makes sense for SigNoz to have a great frontend monitoring experience so that our users can set up an end-to-end monitoring of their applications.
You ultimately want to tie what’s happening in the frontend to the backend, and having everything under a single pane makes monitoring your application very easy.
Frontend Monitoring with SigNoz
Frontend monitoring can be divided into multiple aspects:
- Error/Exceptions Monitoring
- Performance Monitoring
- Real User Monitoring
Currently, OpenTelemetry does not have much support for frontend observability apart from supporting traces. But we have built some cool dashboards for monitoring important things like core web vitals. Let us check them out.
Core Web Vitals Monitoring with SigNoz
Web Vitals is an initiative by Google aimed at offering consistent advice for key indicators of web page quality crucial for a superior web user experience. Its goal is to streamline the myriad of performance measurement tools available and assist website owners in concentrating on the most significant metrics, known as the Core Web Vitals.
Currently, there are three core web vitals:
Largest Contentful Paint
It measures loading performance. To provide a good user experience, LCP must occur within 2.5 seconds of when the page first starts loading.First Input Delay
It measures interactivity. To provide a good user experience, pages must have a FID of 100 milliseconds or less.Cumulative Layout Shift
It measures visual stability. To provide a good user experience, must should maintain a CLS of 0.1. or less.
Here’s a quick guide that provides a step-by-step approach to monitor core web vitals such as Largest Contentful Paint (LCP), First Input Delay (FID), and First Contentful Paint (FCP) using OpenTelemetry, SigNoz, and the web-vitals library.
Step 1: Setup the metrics provider
The first step involves setting up the MeterProvider from OpenTelemetry**,** using which we can generate custom metrics in our application.
import { MeterProvider, PeriodicExportingMetricReader } from '@opentelemetry/sdk-metrics-base';
import { OTLPMetricExporter } from '@opentelemetry/exporter-metrics-otlp-http';
import { Resource } from '@opentelemetry/resources';
import { opentelemetry } from '@opentelemetry/api';

// Define your resource, e.g., service name, environment.
const resource = new Resource({
  'service.name': 'yourServiceName',
});

// Create a metric reader with OTLP exporter configured to send metrics to a local collector.
const metricReader = new PeriodicExportingMetricReader({
  exporter: new OTLPMetricExporter({
    url: 'http://127.0.0.1:4318/v1/metrics',
  }),
  exportIntervalMillis: 10000, // Export metrics every 10 seconds.
});

// Initialize a MeterProvider with the above configurations.
const myServiceMeterProvider = new MeterProvider({
  resource,
  readers: [metricReader],
});

// Set the initialized MeterProvider as global to enable metric collection across the app.
opentelemetry.metrics.setGlobalMeterProvider(myServiceMeterProvider);
Step 2: Capture Core Web Vitals
Utilize the web-vitals library to capture performance metrics like LCP, FID, and FCP. This library provides a simple API to capture web performance metrics.
import { getCLS, getFCP, getFID, getLCP, getTTFB } from 'web-vitals';

getCLS(yourCustomCallback);
getFID(yourCustomCallback);
getLCP(yourCustomCallback);
Step 3: Exporting the Data
Given that web vitals are non-additive values, we can utilize Observable Async Gauges from OpenTelemetry to periodically observe and export these metrics. This metric type is suitable for web vitals because it allows observing values over time without assuming additive behavior, which is essential for accurately representing metrics like LCP, FCP, and FID.
import { metrics } from '@opentelemetry/api';

const meter = metrics.getMeter('web-vitals');
const lcp = meter.createObservableGauge('lcp');

case 'LCP': {
	lcp.addCallback((result) => {
	result.observe(metric.value);
	});
}
You can send the metrics to SigNoz, and build a customized dashboard to monitor your core web vitals.
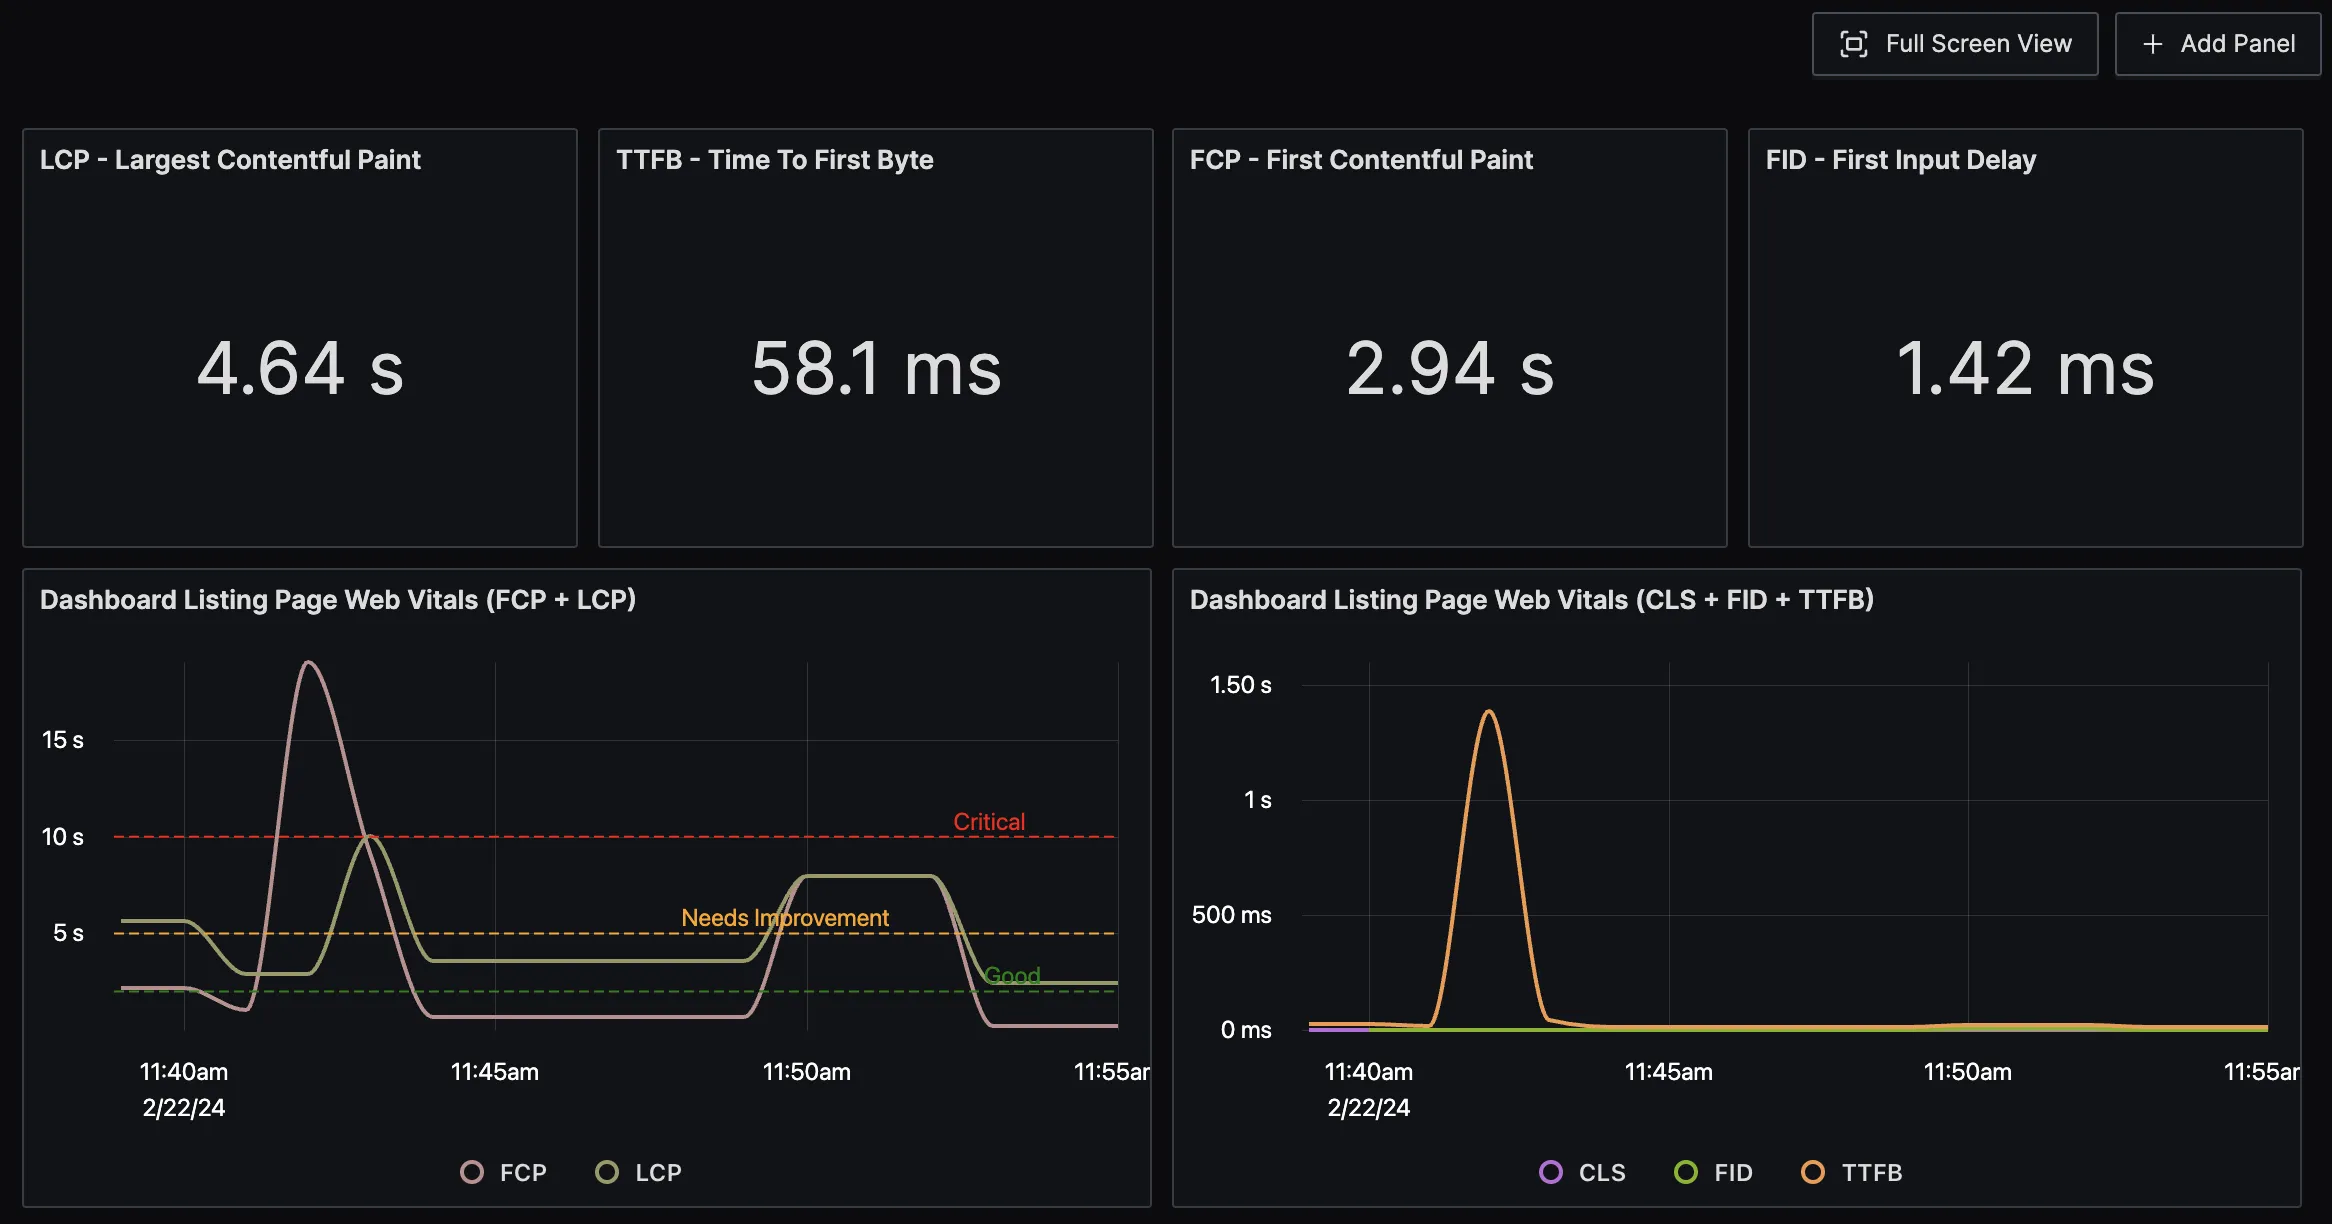
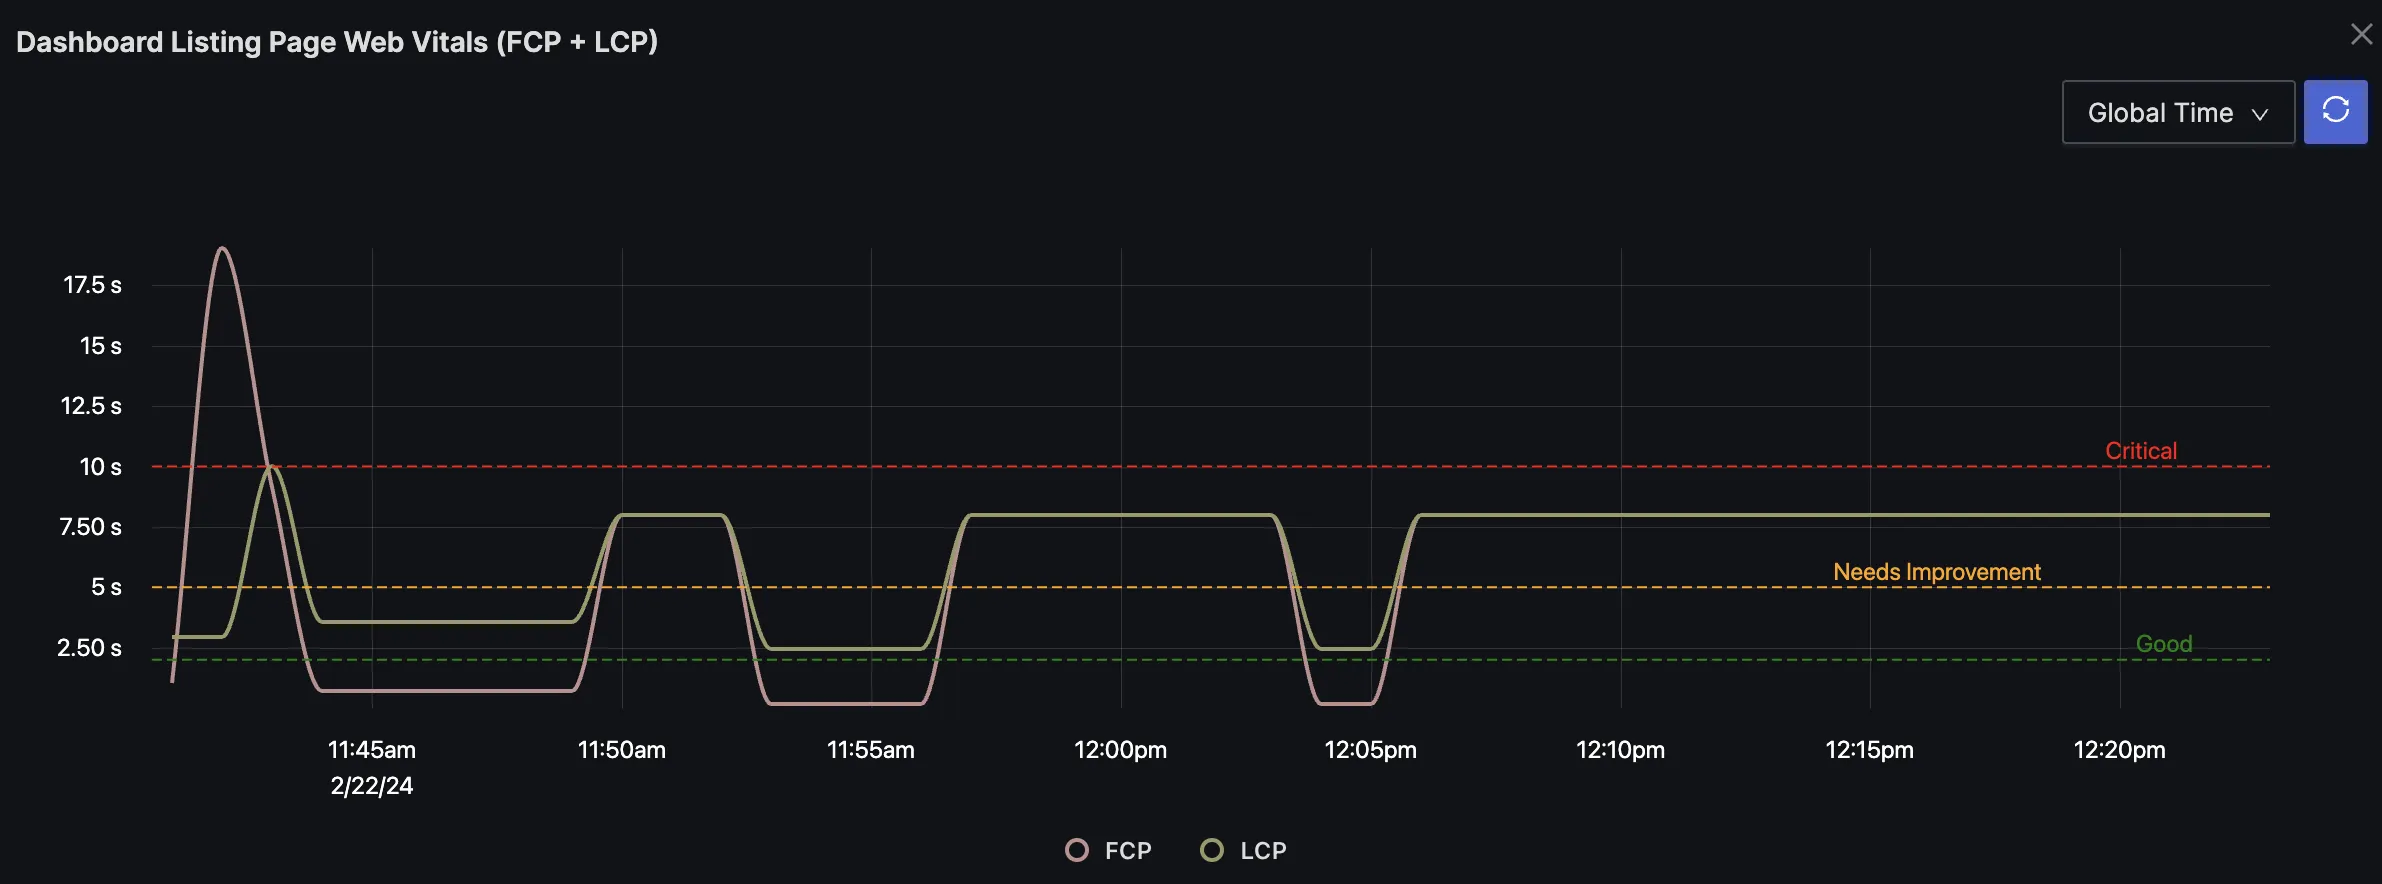
One of the cool features of SigNoz charts is that you can create thresholds in the chart with different color coding. For example, in the below graph there are three thresholds for good, needs improvement, and critical level.
You can also create alerts and set notifications to a preferred channel to be notified about anything critical that needs to be investigated.
Error Tracking with SigNoz
One of the other important aspects of frontend monitoring is error tracking. In SigNoz, you can track errors with the help of trace data.
Here’s a quick guide that walks you through setting up frontend error tracking in your React application using SigNoz. By following these steps, you can monitor and trace errors in your frontend application efficiently.
Step 1: Initialize the Trace Provider
First, we need to set up the TraceProvider, which is essential for tracking errors and sending traces to the SigNoz backend.
const provider = new WebTracerProvider({
	resource,
});

const exporter = new OTLPTraceExporter({
	url: 'http://127.0.0.1:4318/v1/traces',
});

const processor = new BatchSpanProcessor(exporter);
provider.addSpanProcessor(processor);
Step 2: Integrate Error Tracking with React
To capture all errors from your React application, use an ErrorBoundary component. This component will catch JavaScript errors in any child component tree and log them as traces.
Wrap Your Application with ErrorBoundary
Modify your application's root component to include theErrorBoundary. This ensures that any error in the app is caught and processed.import ErrorBoundary from './ErrorBoundary'; // Make sure to create this component import ErrorBoundaryFallback from './ErrorBoundaryFallback'; // A fallback UI component <ErrorBoundary FallbackComponent={ErrorBoundaryFallback} onError={reportErrorStackTrace}> {/* Your App Component */} </ErrorBoundary>Implement the Error Reporting Function
Create a function to report errors from theErrorBoundary. This function will send error details to SigNoz.import { SpanStatusCode, trace } from '@opentelemetry/api'; import { defaultTo } from 'lodash-es'; import { ErrorInfo } from 'react'; export function reportErrorStackTrace(error: Error, info: ErrorInfo): void { const tracer = trace.getTracer('Error Boundary'); tracer.startActiveSpan('Error Boundary', (span) => { span.recordException(error); // Optional: Set custom attributes on the trace span.setAttribute('stackTrace', defaultTo(error.stack, '')); span.setAttribute('errorMessage', error.message); // Mark the span with an error status span.setStatus({ code: SpanStatusCode.ERROR, }); //Always end the open span span.end(); }); }
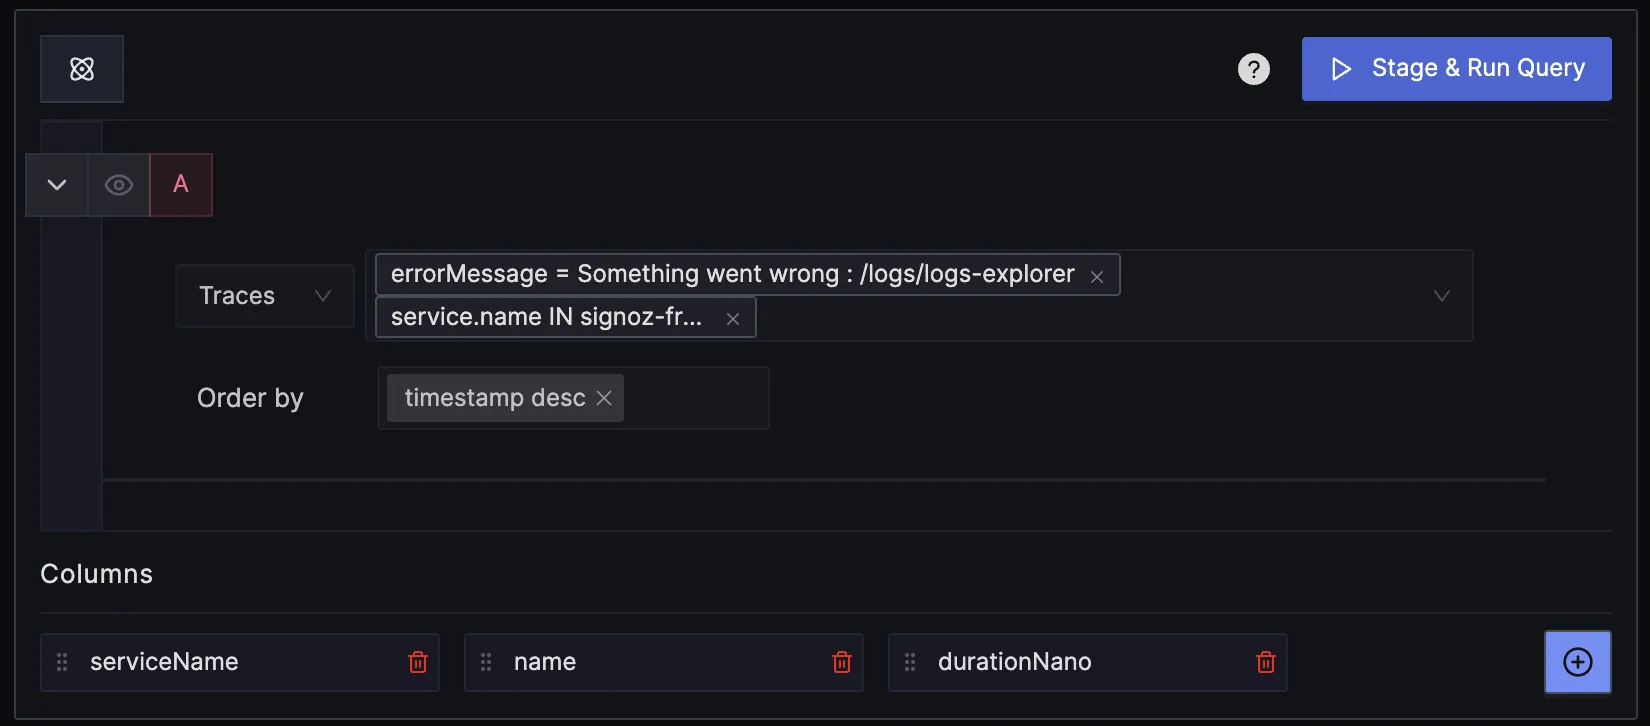
Once you’re done with the set up, you can create a customized dashboard for monitoring the errors in SigNoz.
SigNoz lets you write queries on all signals - logs, metrics, and traces. For error tracking, you can create queries on trace data to build different panels.
You can also click on any errors in the list and see the exact span in flame graph view of the trace. From there, you can get more information on the error with the help of span attributes.
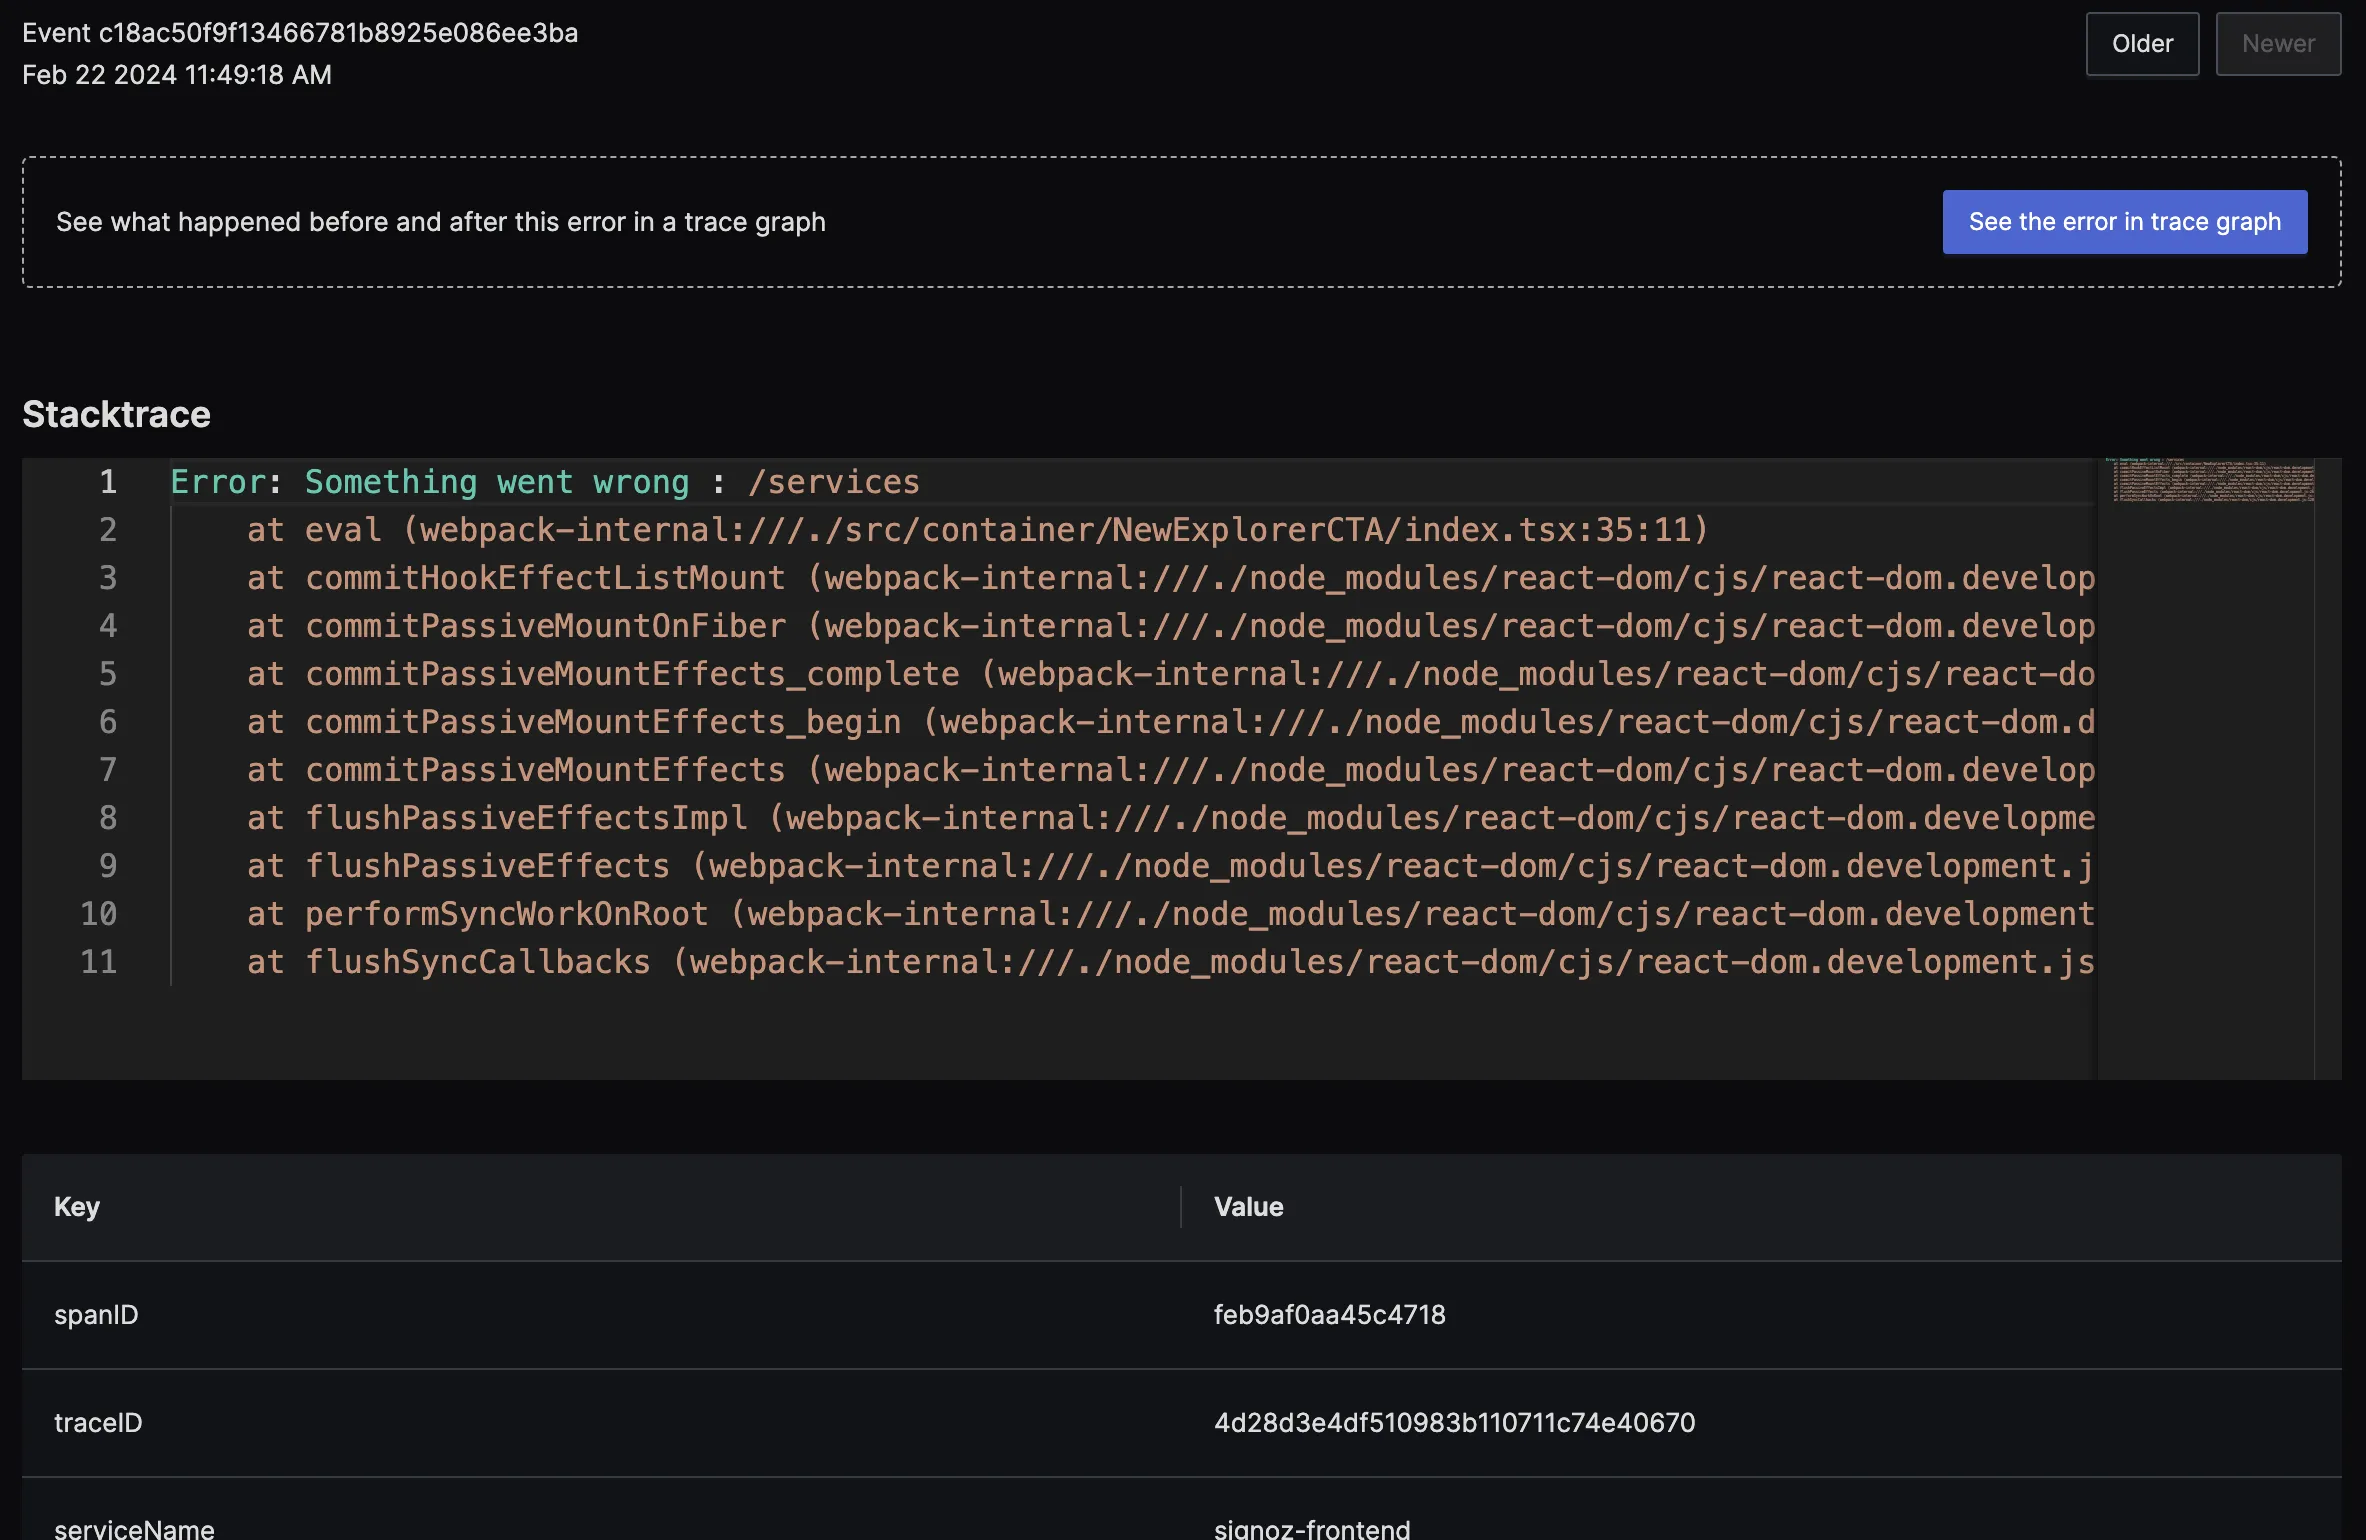
We also have a dedicated tab for exception tracking.
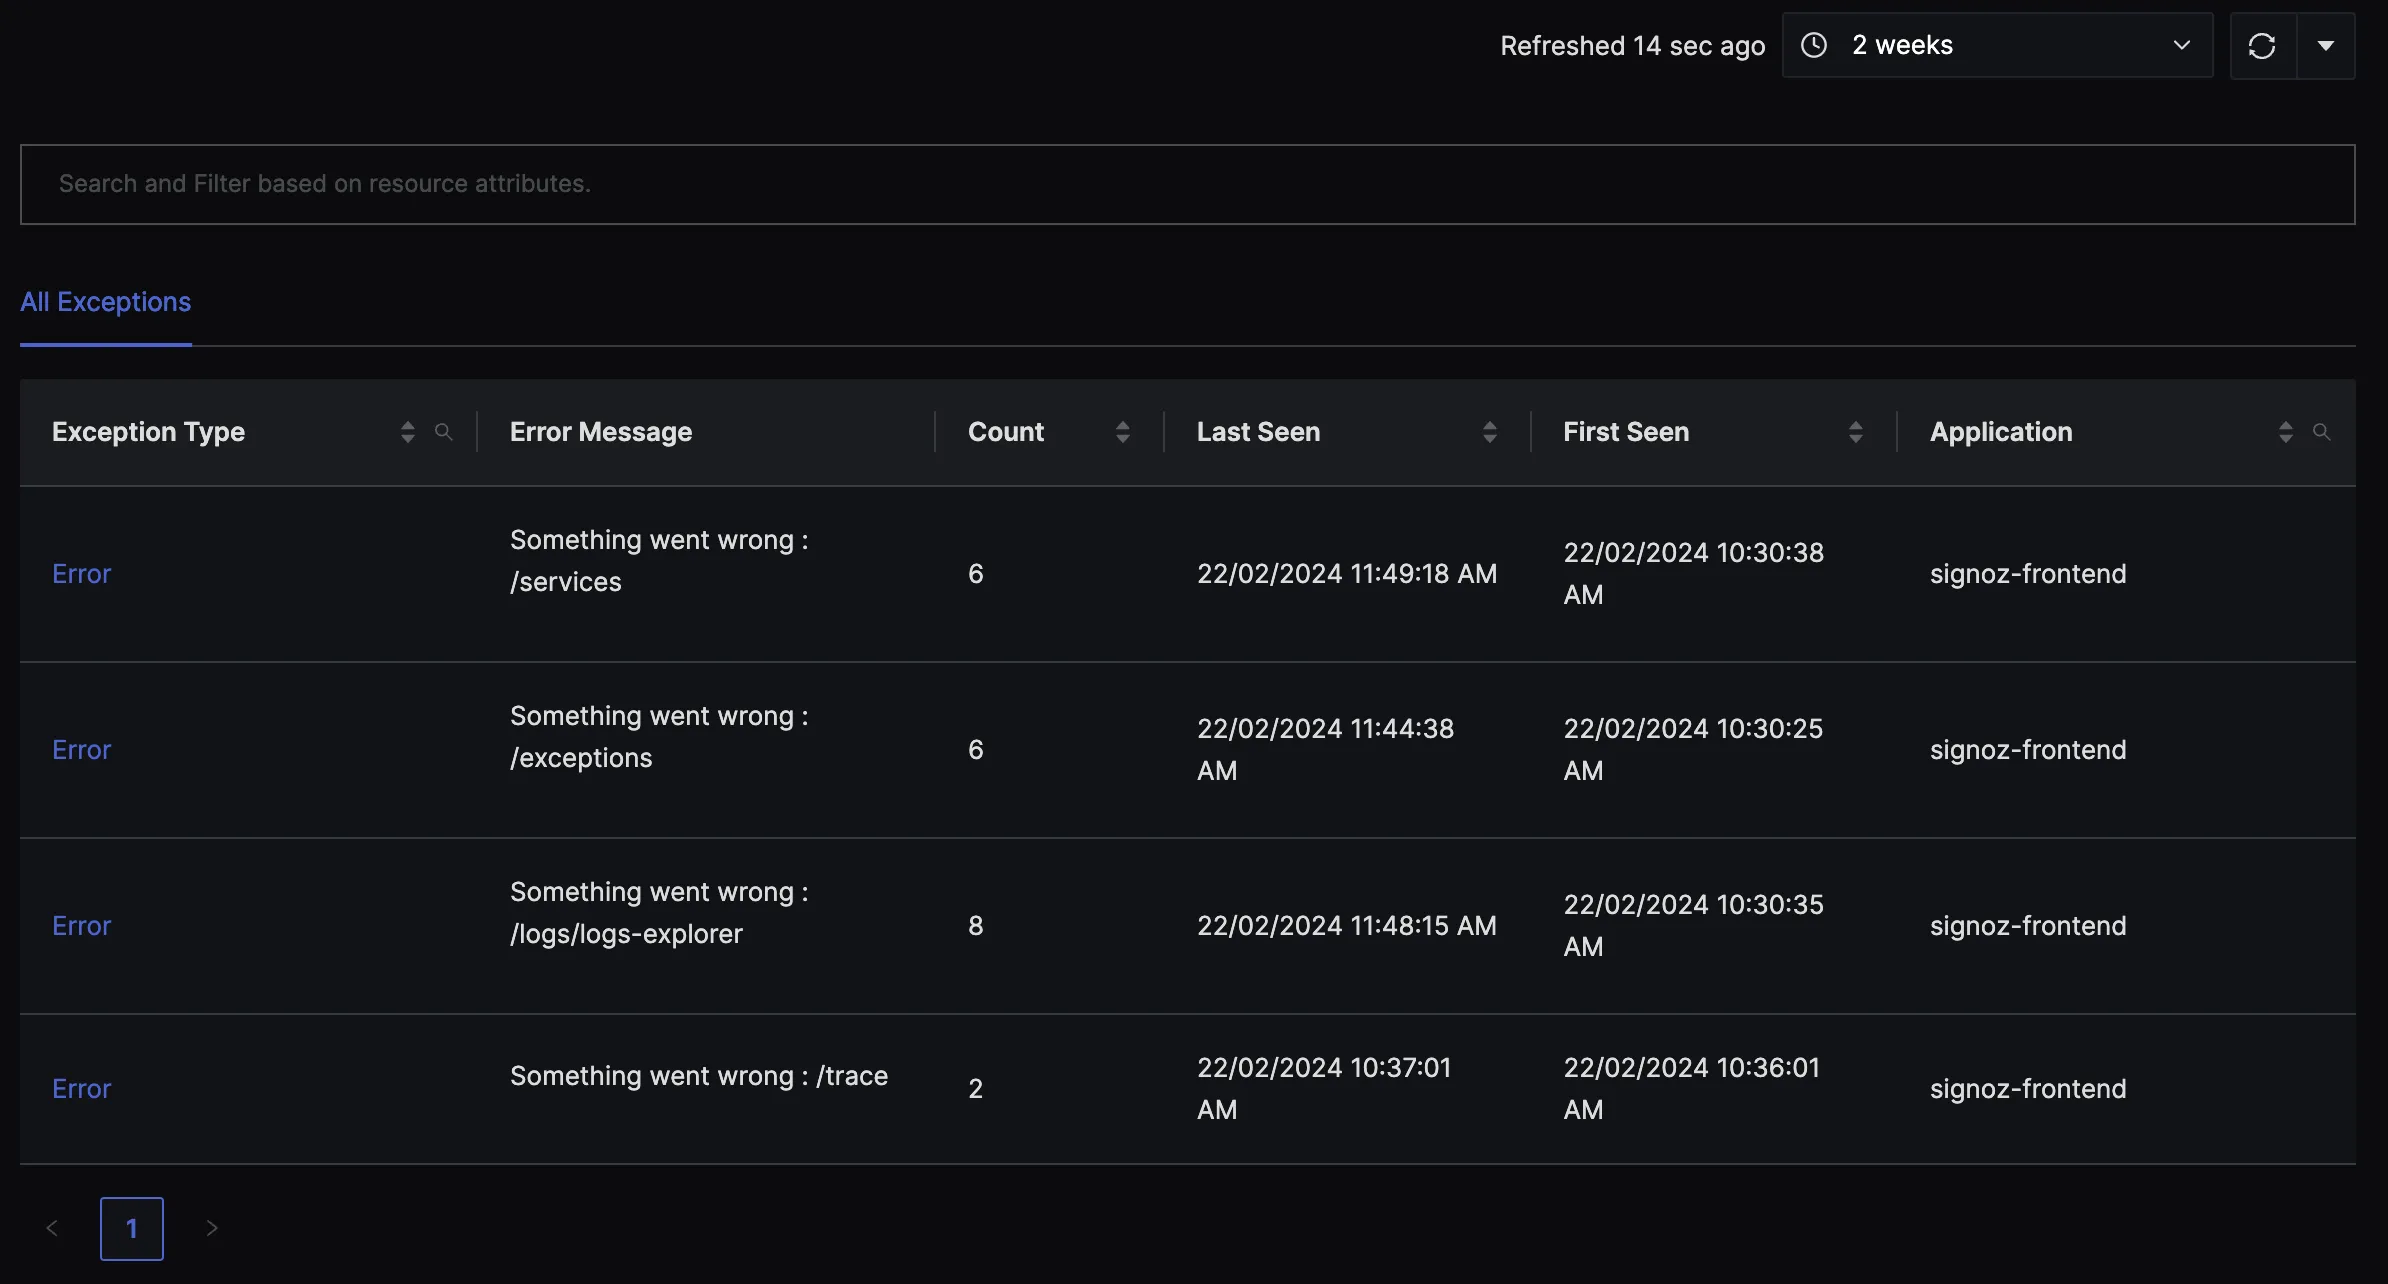
If you want to investigate further, you can check out the entire stacktrace of the exception.
Frontend Engineering At SigNoz
SigNoz is a very data-intensive product. For example, a single trace might contain thousands of spans and to render them in our frontend efficiently is a challenging task. Yunus shares that it is what makes it exciting to work as a Frontend engineer at SigNoz.
There are two types of improvement the frontend team is working on to improve the performance of SigNoz UI:
Improving Perceived Performance
Optimizing chart rendering
We were previously using chartjs, but our UI performance was taking a hit. In our research, we found uPlot library has a better performance even for large datasets, especially when it is dealing with time-series data. So it was a perfect fit for us.The challenge that we faced with uPlot was a lack of good documentation, but our team was able to roll it out to improve our charts’ performance.
We have also implemented design tokens for making our frontend development more consistent and efficient.
What’s next?
One of our key objectives is to introduce out-of-the-box dashboards tailored specifically for frontend observability. We're also excited to unveil panel grouping functionality, which will help users organize their dashboard panels more effectively, providing clearer and more insightful visualizations.
We will also be working on implementing a wide array of integrations. These integrations will facilitate easy onboarding to SigNoz, allowing users to effortlessly connect to a variety of sources and sinks for telemetry data. Additionally, we're exploring the possibility of incorporating query suggestions and quick filters, streamlining the data exploration process for users of all levels.
We’re going to work on more frontend-specific features that takes user experience in SigNoz to the next level. For example, our team is working on keyboard shortcuts which will enable users to access different things in SigNoz quickly. The first version is already available to users of SigNoz.
Furthermore, we will be working towards empowering our product and marketing teams with the ability to update copy within the product independently, without needing to involve the engineering team. This will streamline the process of iterating on our product's messaging and ensure that our users receive the most up-to-date information at all times.


