Feature in Spotlight: Logs Pipeline [Day 4] 🪵

Maintainer, SigNoz
Welcome to SigNoz Launch Week Day 4!
Today’s feature in the spotlight is Logs Pipeline.
With Log Pipelines, you can transform logs to suit your querying and aggregation needs before they get stored in the database.
The Builder - Raj Kamal Singh
Raj joined SigNoz for the love of startups and building things from scratch. An ex-googler, he loves the dynamic and innovative environment of startups and bringing new products to the market.

Why are Log Pipelines important?
Log pipelines are important for various reasons:
Pre-Process your logs data
Pipelines allow users to preprocess their signal data before it gets stored. This preprocessing can include extracting specific attributes from logs, making the data better suited for querying and aggregation needs.Make log analysis more efficient
By extracting relevant attributes from logs, pipelines enable more efficient analysis. Developers can perform queries and aggregations on extracted attributes, allowing for a more granular and insightful analysis of the data.No need for code modification or redeployment
Pipelines provide a way to modify the structure and content of log data without needing to change application code or redeploy components.Normalization across services
In a complex stack, components from different sources (both third-party and in-house) may produce logs in varied formats. Pipelines help normalize these logs by extracting and standardizing attributes, facilitating a unified view across services.Ad-hoc analytics and handling High-dimensionality data
Pipelines enable ad hoc analytics by allowing attributes to be dynamically extracted for analysis. This is especially important for high-cardinality data (like IP addresses), which might not be feasible to analyze as metrics due to their high-cardinality.Handling logs from third-party components
For third-party systems where direct control over metrics generation from logs isn't possible, pipelines can extract metrics and attributes from logs, ensuring even third-party systems' data can be effectively monitored and analyzed.
Log Pipelines in SigNoz
Using Log pipelines, you can create rules for transforming logs with a few clicks in SigNoz UI.
It enables you to unleash the full potential of your logs by pre-processing them to suit your needs before they get stored. This unlocks valuable logs-based queries and dashboards that wouldn't be possible otherwise.
You can also use log preprocessing to achieve other goals, like cleaning sensitive information in your logs or normalizing the names of fields across services.
Log Pipelines in Action
Let’s suppose you have a demo service called cart-service, which logs information about orders that are being placed. The body of the log is in json.
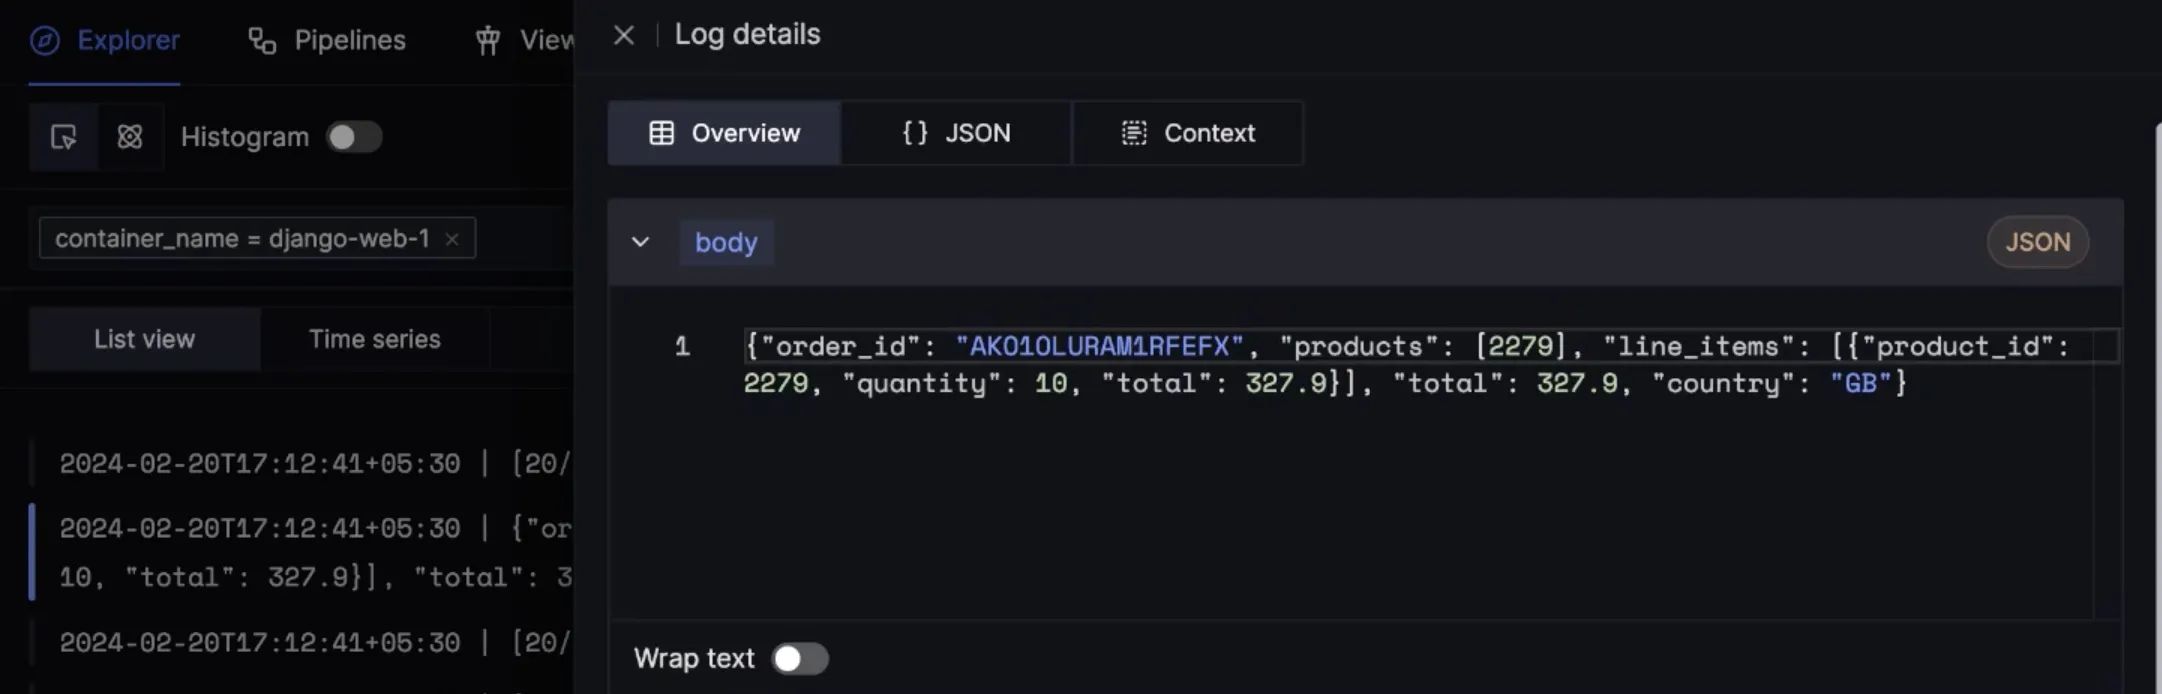
With log pipelines, you can extract things like country code and total amount for orders into their own attribute.
With the extracted attributes, you will be able to run queries for finding things like average order values across countries. This becomes very powerful for querying specific things out of raw log data and creating charts & alerts on them.
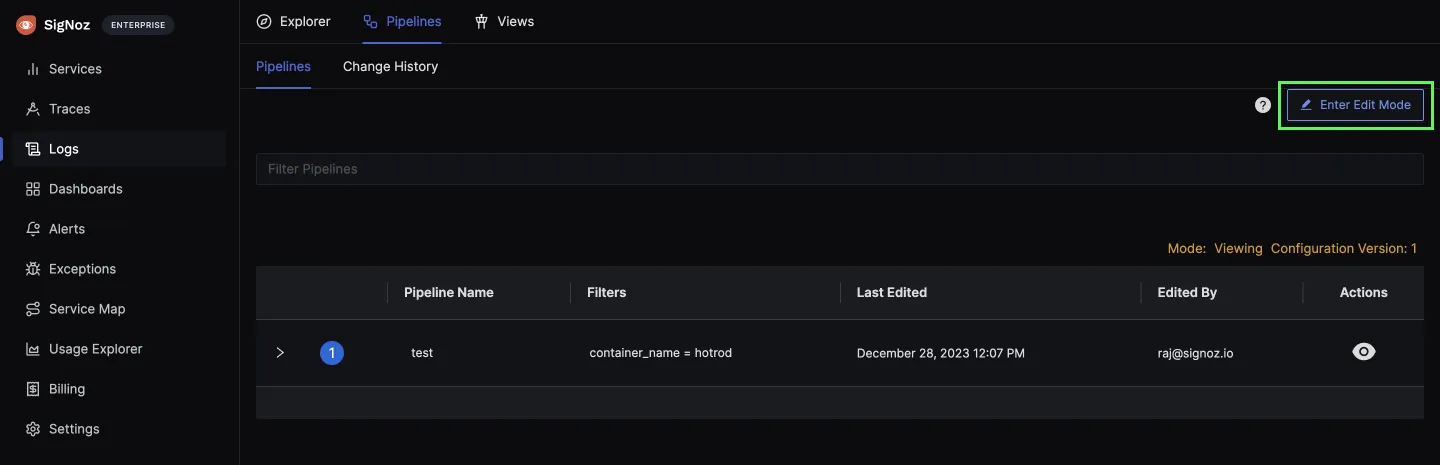
You can access pipelines from the Logs Explorer tab. And then click on Enter Edit Mode to add a new pipeline.
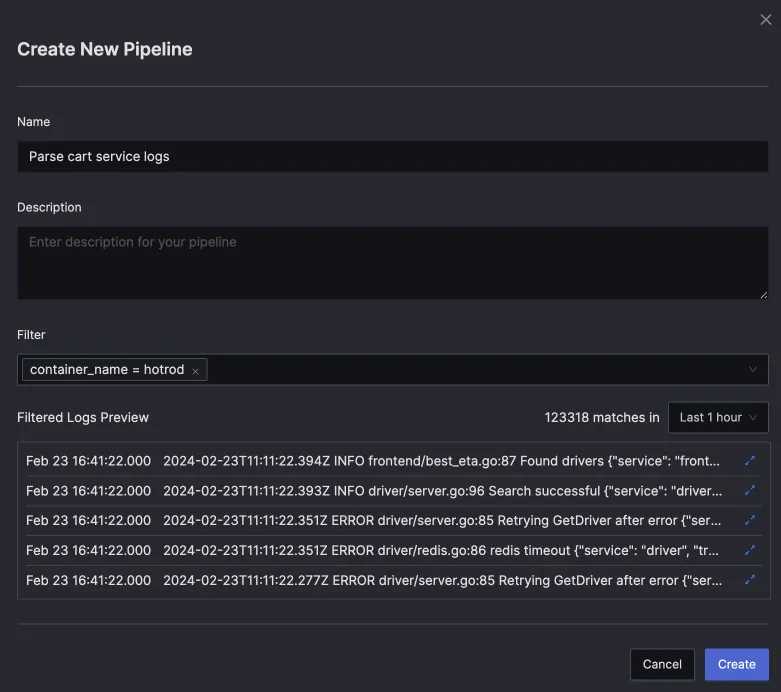
Once you click on Add a New Pipeline, there will be a pop-up for creating a new pipeline with fields for name, description, and filter. Using the Filter field, you can create pipelines for specific incoming log streams.
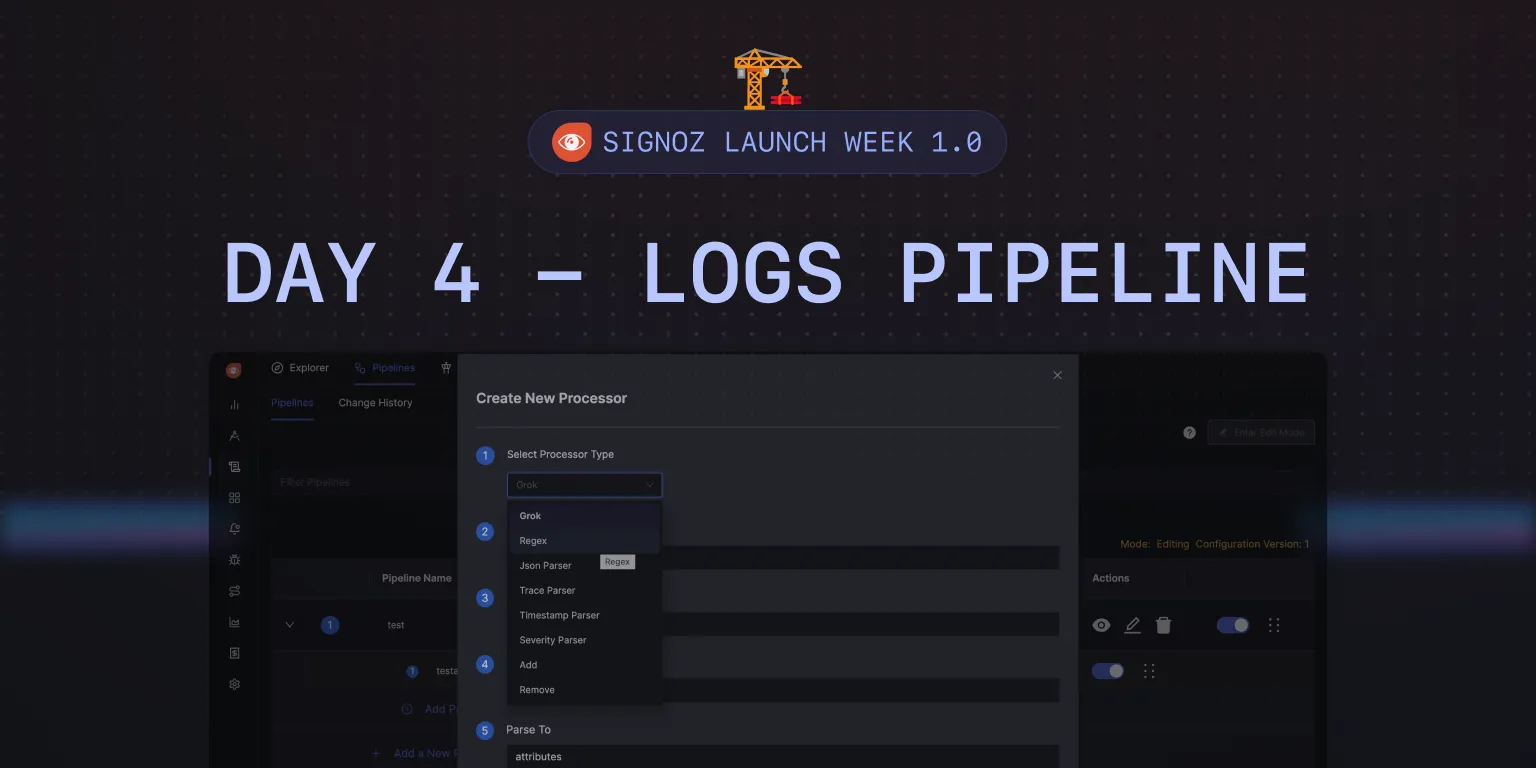
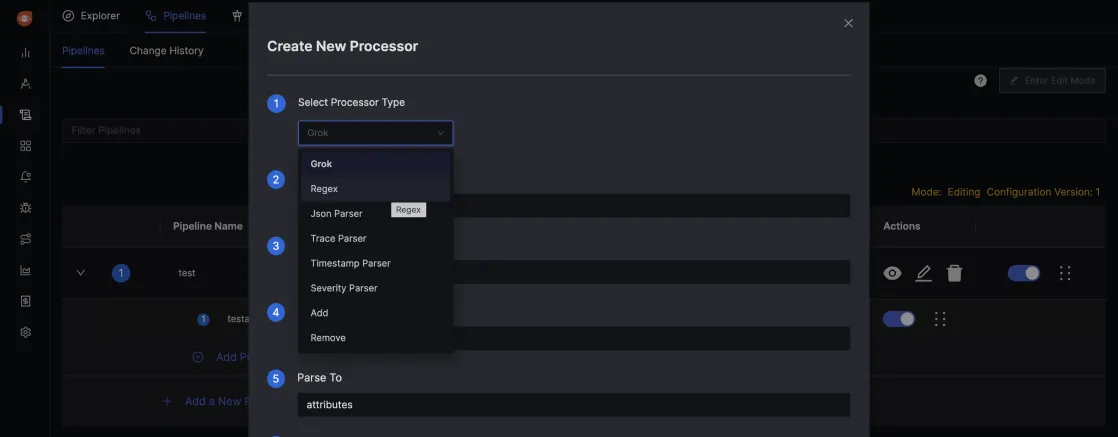
Once the pipeline is created, you can apply a chain of processors to transform your logs to suit your needs.
Behind the Scenes: How Log Pipelines Work?
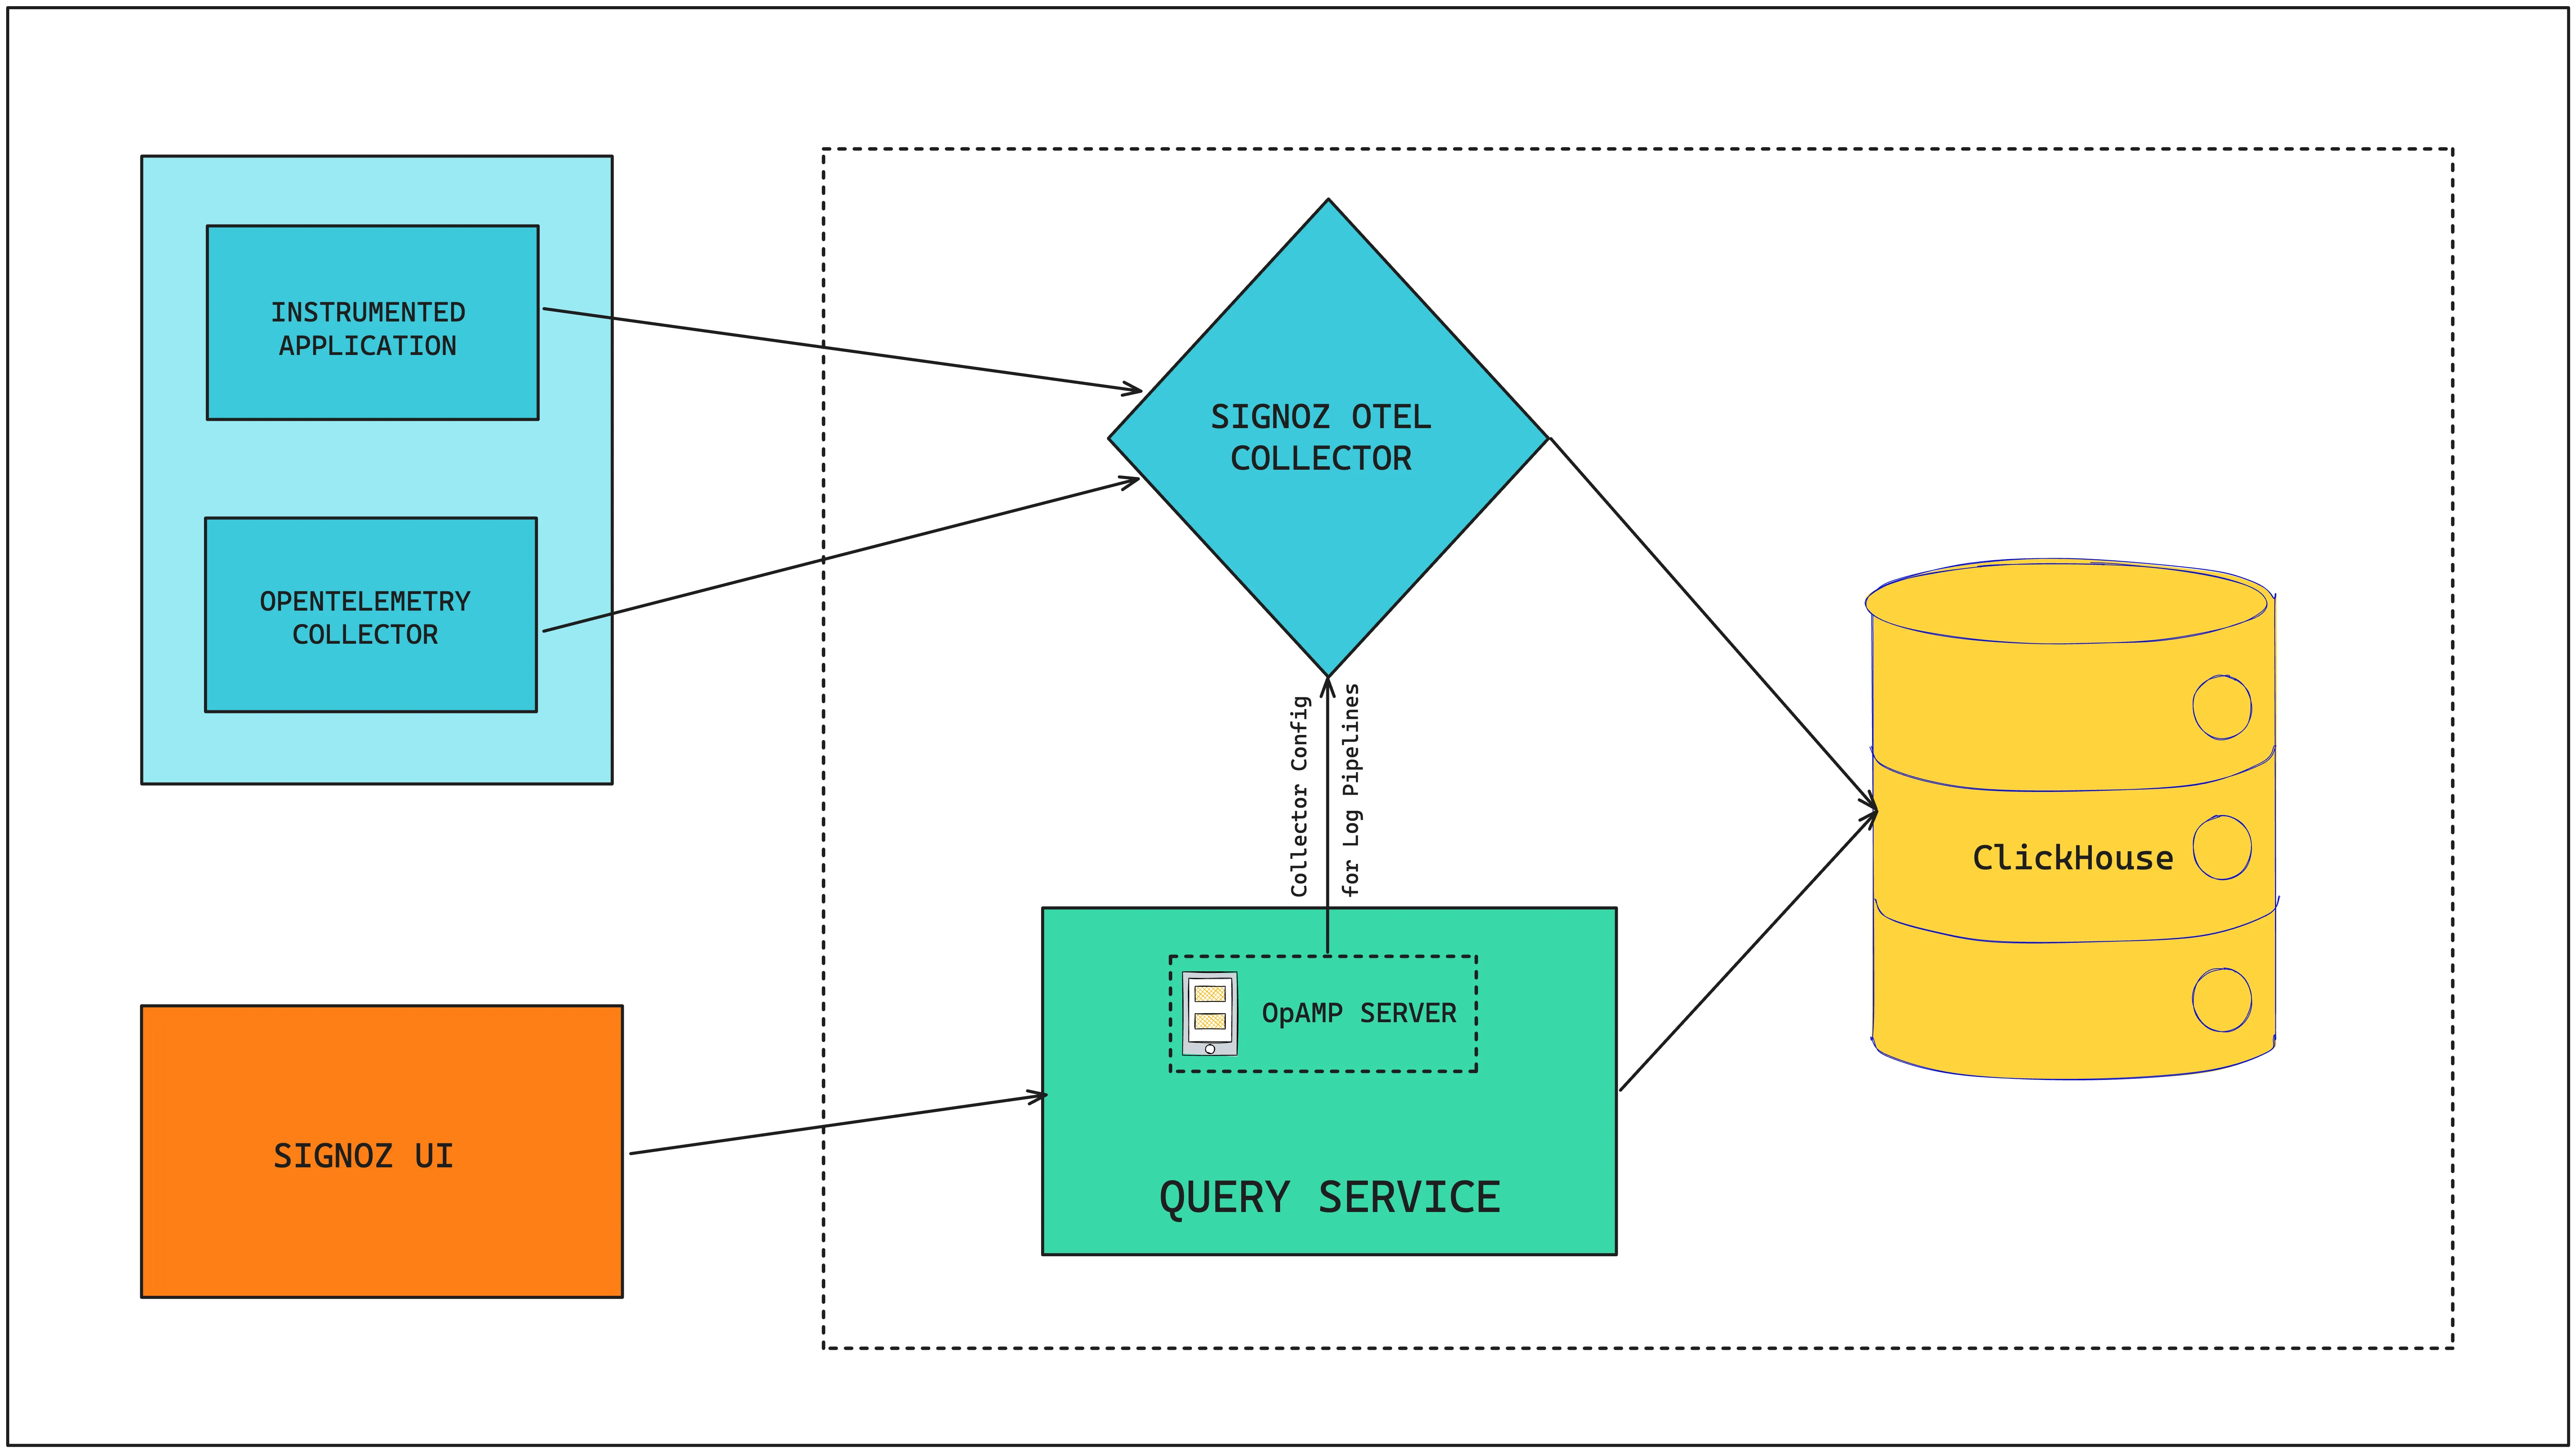
Log pipelines are essentially configurations in the OpenTelemetry Collector deployed to ingest incoming log data.
To understand how Log pipelines work, let’s get a brief overview of SigNoz architecture. Data from instrumented applications and Otel collectors are sent to the SigNoz OTel collector for pre-processing, which then gets written to ClickHouse (SigNoz DB). SigNoz UI interacts with this data with the help of Query Service.
Managing OTel Configurations with OpAMP
In the SigNoz UI, when a new log pipeline is saved, the query service communicates with the SigNoz OTel Collector via the OpAMP server to update its configuration. OpAMP, which stands for OpenAgent Management Protocol, facilitates the transmission of rules for transforming incoming logs from SigNoz UI to SigNoz OTel collector. OpAMP can also be used for several other use cases.
The integration of an OpAMP server within our query service allows it to direct the SigNoz OTel Collector on the necessary configurations. This ensures that any new log pipeline created by a user in the SigNoz UI is promptly applied to the incoming logs by the collector.
What’s next?
There are many more exciting things coming up for logs in SigNoz.
Integrations
We will be working on making data ingestion more plug-and-play through the development of integrations within SigNoz. The aim is to make it very easy for users to bring their data into SigNoz and start gaining insights from their data.
Using OpAMP to automate data collection
We’re also excited about the scope of OpAMP in automating data collection from our user’s environment. We can allow OTel collectors in a client’s environment to directly connect to our OpAMP server which can instruct it what to run. This can enable a whole world of features and make setting up observability a breeze for even complex environments.
The OTel collector in the client environment can auto-discover all the standard components, and the OpAMP server can handle the configurations required to collect telemetry specified by the user using SigNoz UI.
Unified Query language
OpenTelemetry has standardized the write path for observability. In the long-term future, we’re also excited about a probable development of standardization on the querying side. Today, observability vendors handle querying data in the manner that they see fit. But OpenTelemetry has the potential to develop a standard query language which will be interesting to watch.


