OpenTelemetry Java Agent - Implement Observability With Zero Code Changes
OpenTelemetry emerged as a single project after the merging of OpenCensus(from Google) and OpenTracing(from Uber) into a single project. The project aims to make telemetry data(logs, metrics, and traces) a built-in feature of cloud-native software applications.

The OpenTelemetry Java agent enables Java applications to generate and capture telemetry data automatically. This article gives you a solid overview of the OpenTelemetry Java agent, including how it works. But first, let's take a short detour to understand what OpenTelemetry is.
What is OpenTelemetry?
OpenTelemetry is a collection of code - a set of APIs, SDKs, tooling, and integrations that help you generate and manage telemetry data. It helps you generate, emit, collect, process, and export telemetry data.
The telemetry data captured with OpenTelemetry enables observability for your systems and applications. It also aims to standardize this process. The data you collect with OpenTelemetry is vendor-agnostic and can be exported in many formats.
OpenTelemetry does not come with a backend analysis tool. For storage, analysis, and visualization of telemetry data, you can use a full-stack observability platform like SigNoz.
How do we generate telemetry data using OpenTelemetry?
Telemetry data is generated using a process called instrumentation. OpenTelemetry provides instrumentation libraries for both manual and automatic instrumentation. These libraries are specific to the languages that they are used for. Instructions for setting up instrumentation also vary with programming languages.
OpenTelemetry defines instrumentation libraries as libraries that enable observability for another library.
OpenTelemetry Java libraries
For Java applications, OpenTelemetry provides three repositories:
opentelemetry-java
This repo is the main OpenTelemetry Java SDK and provides components for manual instrumentation. Top-level components include OpenTelemetry API, extensions, SDK, bridge layers for OpenTracing and OpenCensus.
opentelemetry-java-instrumentation
This is the sibling project of opentelemetry-java and provides the all-in-one, easy-to-install auto instrumentation Java agent. The OpenTelemetry Java agent enables you to capture telemetry data from many popular libraries and frameworks. You need to attach it to any Java 8+ application. We will learn more about the Java agent below.
opentelemetry-java-contrib
OpenTelemetry java provides this repo to cover JVM-based applications and workflows that don't fit into the scope of opentelemetry-java and opentelemetry-java-instrumentation.
What is OpenTelemetry Java agent?
OpenTelemetry has a very handy Java JAR agent that can be attached to any Java 8+ application for instrumenting Java applications. The Java JAR agent can detect a number of popular libraries and frameworks and instrument it right out of the box for generating telemetry data.
OpenTelemetry collectors capture the generated telemetry data, which can then be exported in its desired format. If you're using SigNoz, then you can use the default OTLP exporters. The Java agent and the exporter can be configured via the command line with some environment variables. You will not need to make any changes to your code, and that's why it is so convenient to get started with the OpenTelemetry Java agent.
How to use OpenTelemetry Java agent?
The Java agent needs to be downloaded and distributed for each host that you want to monitor.
Steps to use the OpenTelemetry Java agent:
-
Download and distribute the latest Java JAR agent to each monitored host and service.
-
Prepare environment variables like the service name of your monitored service and endpoint to where you will export your data
-
Attach the agent to the jar of your application while running it
If you're exporting your data to an observability tool like SigNoz, you will have to specify the IP address of the host machine where SigNoz is hosted. SigNoz listens to incoming data at port number: 4317. So remember to allow incoming requests to port number 4317 where SigNoz is hosted.
Examples of some of the environment variables to take care of:
OTEL_TRACES_EXPORTER=otlp
OTEL_EXPORTER_OTLP_ENDPOINT=<IP of SigNoz Backend>:4317
OTEL_RESOURCE_ATTRIBUTES="service.name=SERVICE_NAME"
Let's see how the command looks like when you want to run the Java agent attached to an application:
OTEL_EXPORTER_OTLP_ENDPOINT="http://<IP of SigNoz>:4317"
OTEL_RESOURCE_ATTRIBUTES=service.name=javaApp
java -javaagent:/path/to/opentelemetry-javaagent-all.jar -jar target/*.jar
The path to the Java agent JAR file needs to be replaced with the location of the file downloaded. For example, for my local, the command looks like this:
OTEL_EXPORTER_OTLP_ENDPOINT="http://<IP of SigNoz>:4317"
OTEL_RESOURCE_ATTRIBUTES=service.name=javaApp
java -javaagent:/Users/Downloads/to/opentelemetry-javaagent-all.jar -jar target/*.jar
And with that, the OpenTelemetry Java agent will dynamically inject bytecode to capture telemetry from a number of popular libraries and frameworks. Let's see what some of the libraries and frameworks included in the list are.
List of libraries and frameworks supported by OpenTelemetry Java agent
The supported libraries and frameworks supported by OpenTelemetry Java agent for automatic instrumentation includes:
- Akka HTTP 10.0+
- Apache HttpClient 2.0+
- AWS Lambda 1.0+
- AWS SDK 1.11.x and 2.2.0+
- Cassandra Driver 3.0+
- Elasticsearch API 5.0+
- Elasticsearch REST Client 5.0+
- gRPC 1.6+
- JDBC Java 8+
- Jedis 1.4+
- Kafka 0.11+
- Kubernetes Client 7.0+
- MongoDB Driver 3.1+
- OkHttp 3.0+
- RabbitMQ Client 2.7+
- Spark Web Framework 2.3+
- Spring Web Services 2.0+
- Vert.x 3.0+
Some of the popular application servers supported by the Java agent include Glassfish, JBoss EAP, Jetty, Payara, Tomcat, TomEE, Weblogic, and Wildfly.
You can find the complete list of supported libraries and frameworks supported by OpenTelemetry Java agent at opentelemetry-java-instrumentation GitHub repo.
Getting started with OpenTelemetry Java agent
The OpenTelemetry Java Jar agent provides a quick and convenient way to enable your Java application for observability. With out-of-box instrumentation for many popular libraries, the Java agent can be a good starting point for instrumenting your apps with OpenTelemetry.
As mentioned earlier, OpenTelemetry is a vendor-agnostic instrumentation library. So the telemetry data is portable. You can configure it to export in many different formats. A tool like SigNoz supports the default OTLP formats and is a perfect choice for sending your telemetry data.
SigNoz is a full-stack open-source APM tool built natively for OpenTelemetry. It provides metrics monitoring, log management, and distributed tracing under a single pane of glass.
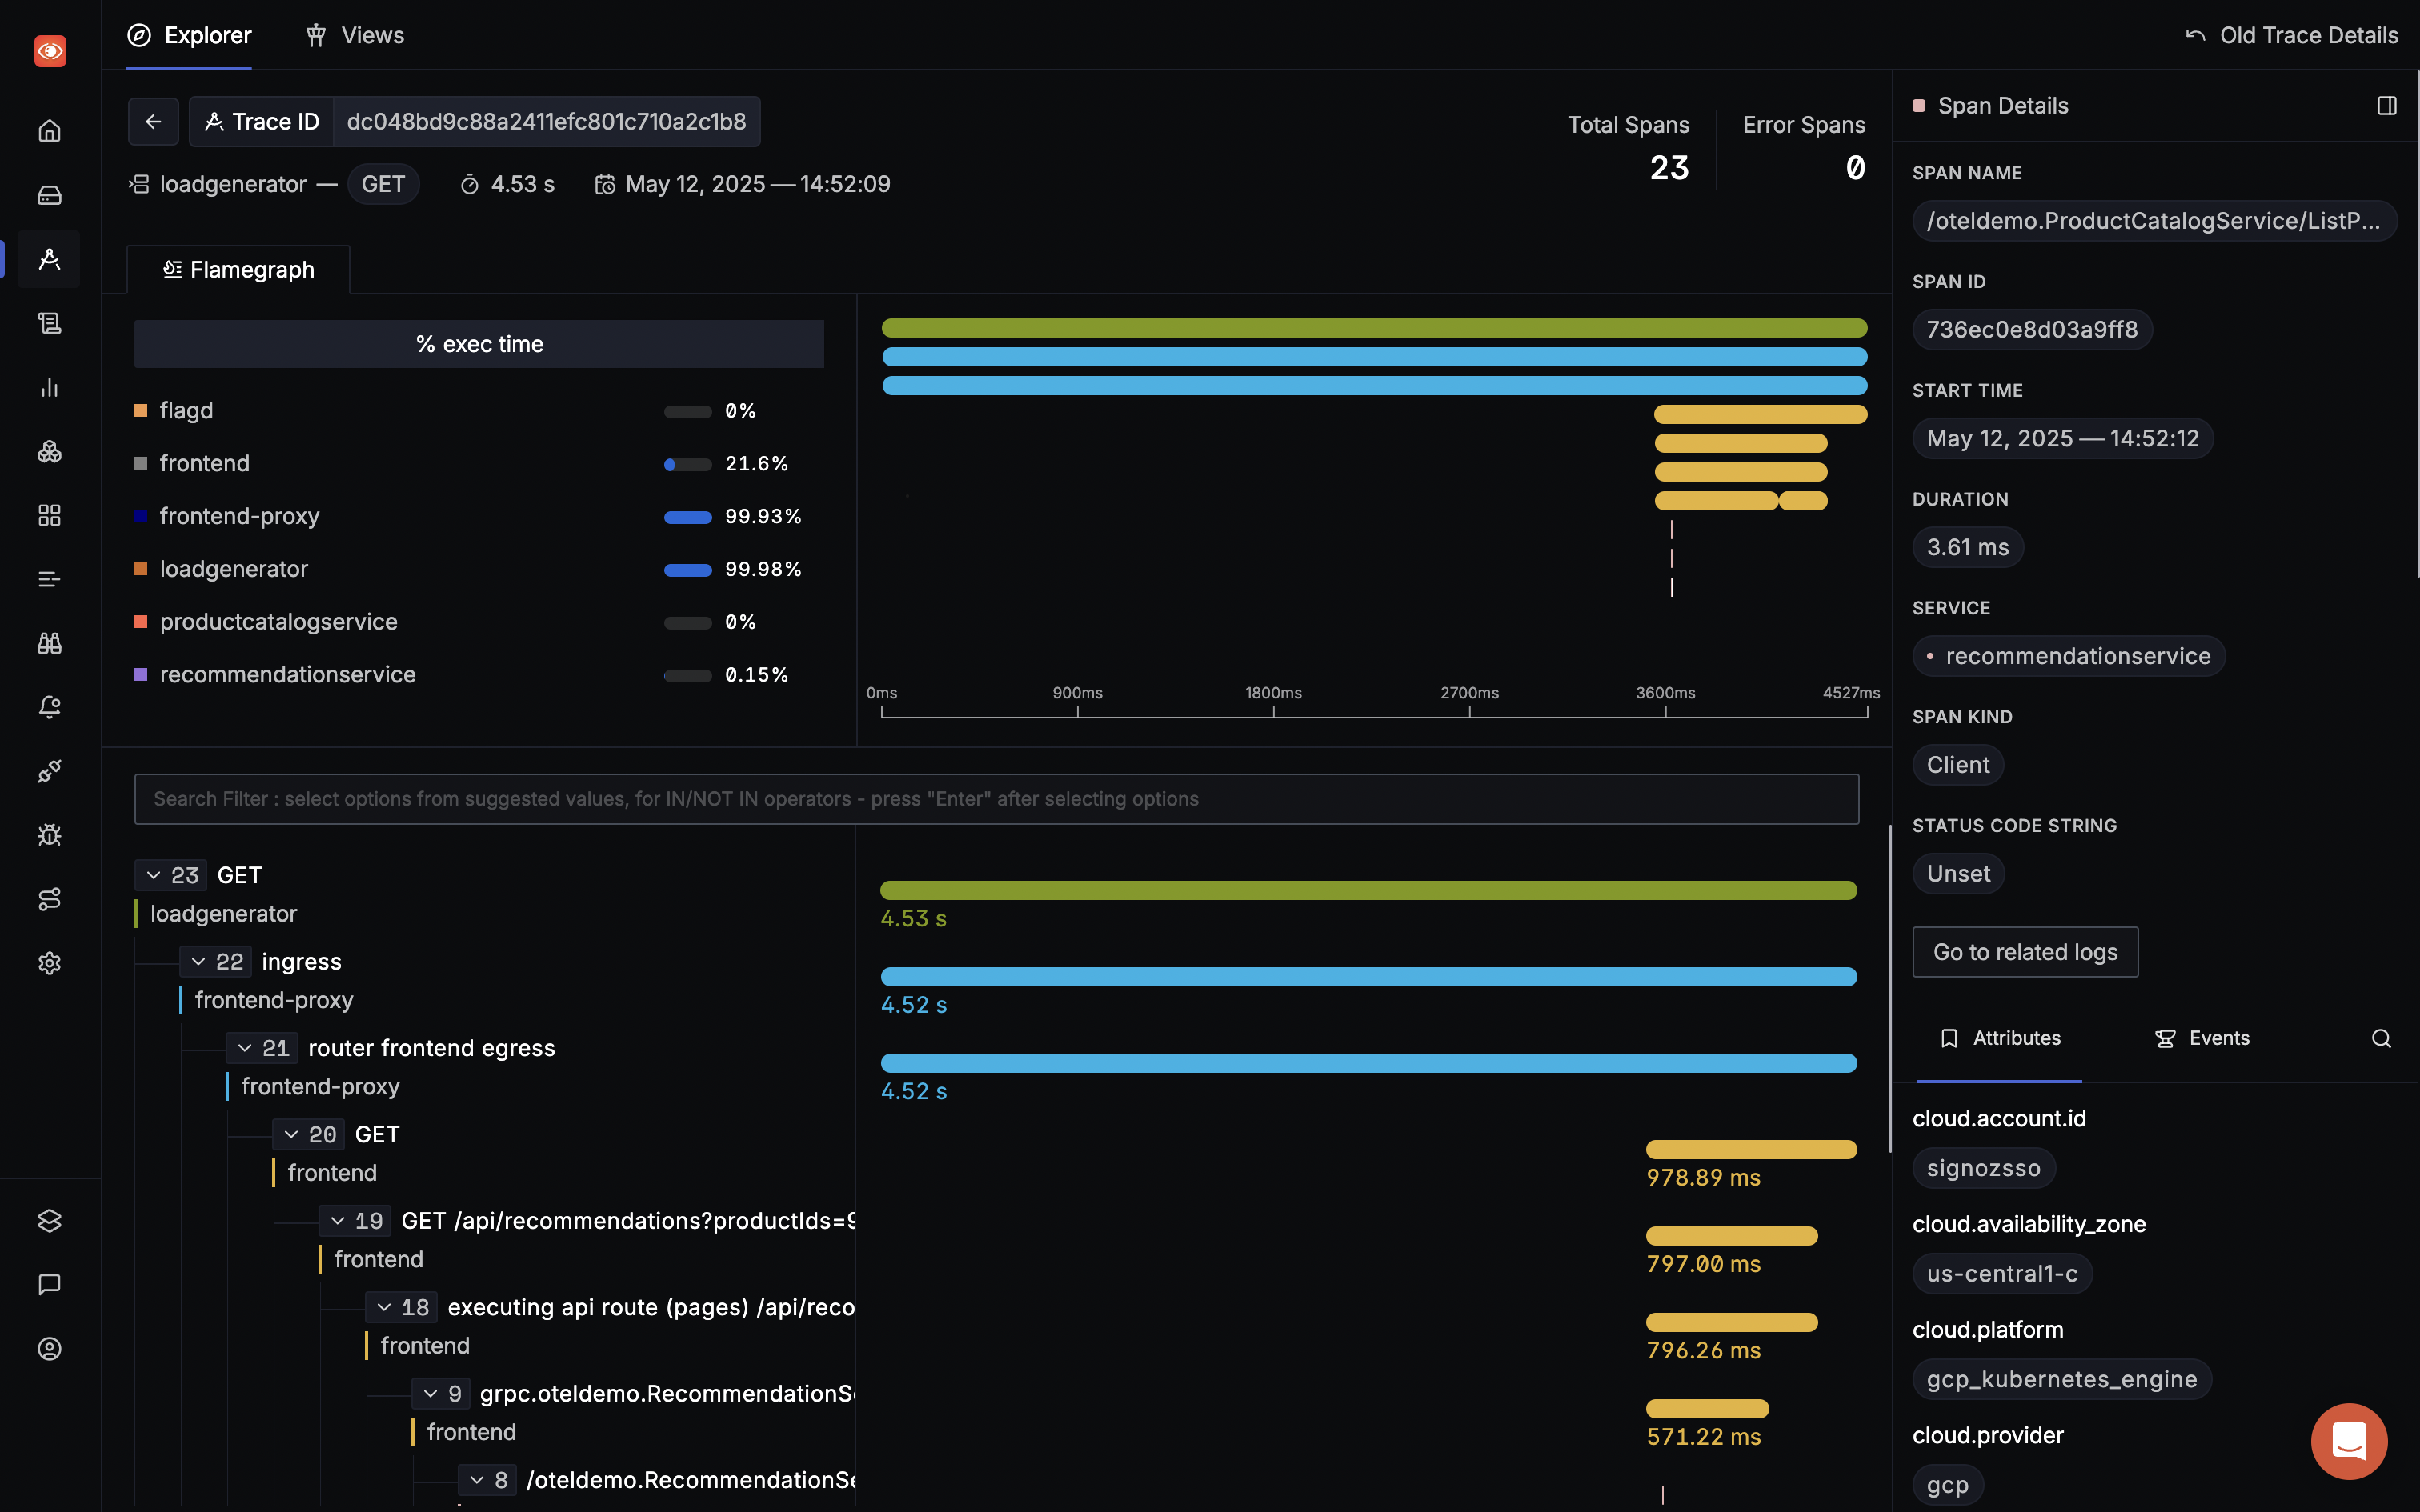
It comes with a powerful visualization layer where you can visualize charts like the popular RED metrics and distributed tracing with flame graphs and Gantt charts.
SigNoz can be installed on macOS or Linux computers in just three steps by using a simple install script.
The install script automatically installs Docker Engine on Linux. However, on macOS, you must manually install Docker Engine before running the install script.
git clone -b main https://github.com/SigNoz/signoz.git
cd signoz/deploy/
./install.sh


Read how to monitor your Spring Boot application with OpenTelemetry Java agent and SigNoz 👇
Monitor your Spring Boot application with OpenTelemetry and SigNoz

