Datadog vs Jaeger - Features, Pricing & Use Cases [Updated for 2026]
Datadog and Jaeger are both leading tools in the observability space, but they represent two fundamentally different philosophies. Datadog is a commercial, all-in-one SaaS platform that unifies metrics, traces, and logs. Jaeger is a popular, open-source project focused specifically on distributed tracing.
Choosing between them isn't just a technical decision; it's about balancing the convenience of a fully managed, integrated platform against the power and control of a self-hosted, specialized tool. This guide dives deep into their differences, helping you navigate this critical choice for your team.
Quick Comparison: Datadog vs. Jaeger
| Feature | Datadog | Jaeger |
|---|---|---|
| Scope | All-in-one observability platform: APM, logs, infrastructure metrics, security, RUM, etc. | Specialized distributed tracing system. |
| PricingModel | Commercial SaaS (Software as a Service). | Free and open-source (CNCF graduated project). |
| Deployment | Managed cloud service. | Self-hosted. Requires managing your own infrastructure (agents, collectors, storage). |
| Core Strength | Unified data correlation (traces, metrics, logs in one place). | Deep, scalable distributed tracing with open standards. |
| Ease of Use | Easy to start, polished UI, but can have a learning curve due to its breadth. | Simple UI for tracing, but requires engineering effort to deploy and maintain a full stack. |
| Integration | 500+ plug-and-play integrations. | Integrates via open standards (OpenTelemetry), requiring more manual setup. |
Core Differences between Datadog and Jaeger
Architecture & Deployment: Do You Want to Build or Buy?
The most fundamental difference is the deployment model, which dictates control, flexibility, and operational load.
Datadog is a managed SaaS platform. You install a lightweight agent, and all the complex backend infrastructure for data processing, storage, and analysis is handled by Datadog. This offers a fast setup and low maintenance burden but means your telemetry data is sent to a third-party cloud.
Jaeger is self-hosted and open-source. You deploy and manage all components (collectors, storage, UI) on your own infrastructure, whether on-premises or in the cloud. This gives you full control over your data and architecture but requires significant engineering effort to deploy, scale, and maintain.
A key update is that Jaeger v2 is now built on the OpenTelemetry Collector, making it more modular and aligned with modern standards.
Scope & Features: All-in-One Swiss Army Knife or a Precision Scalpel?
What kind of visibility do you truly need? Are you looking for a comprehensive observability suite that covers all bases, or a specialized tool that excels at one critical task?
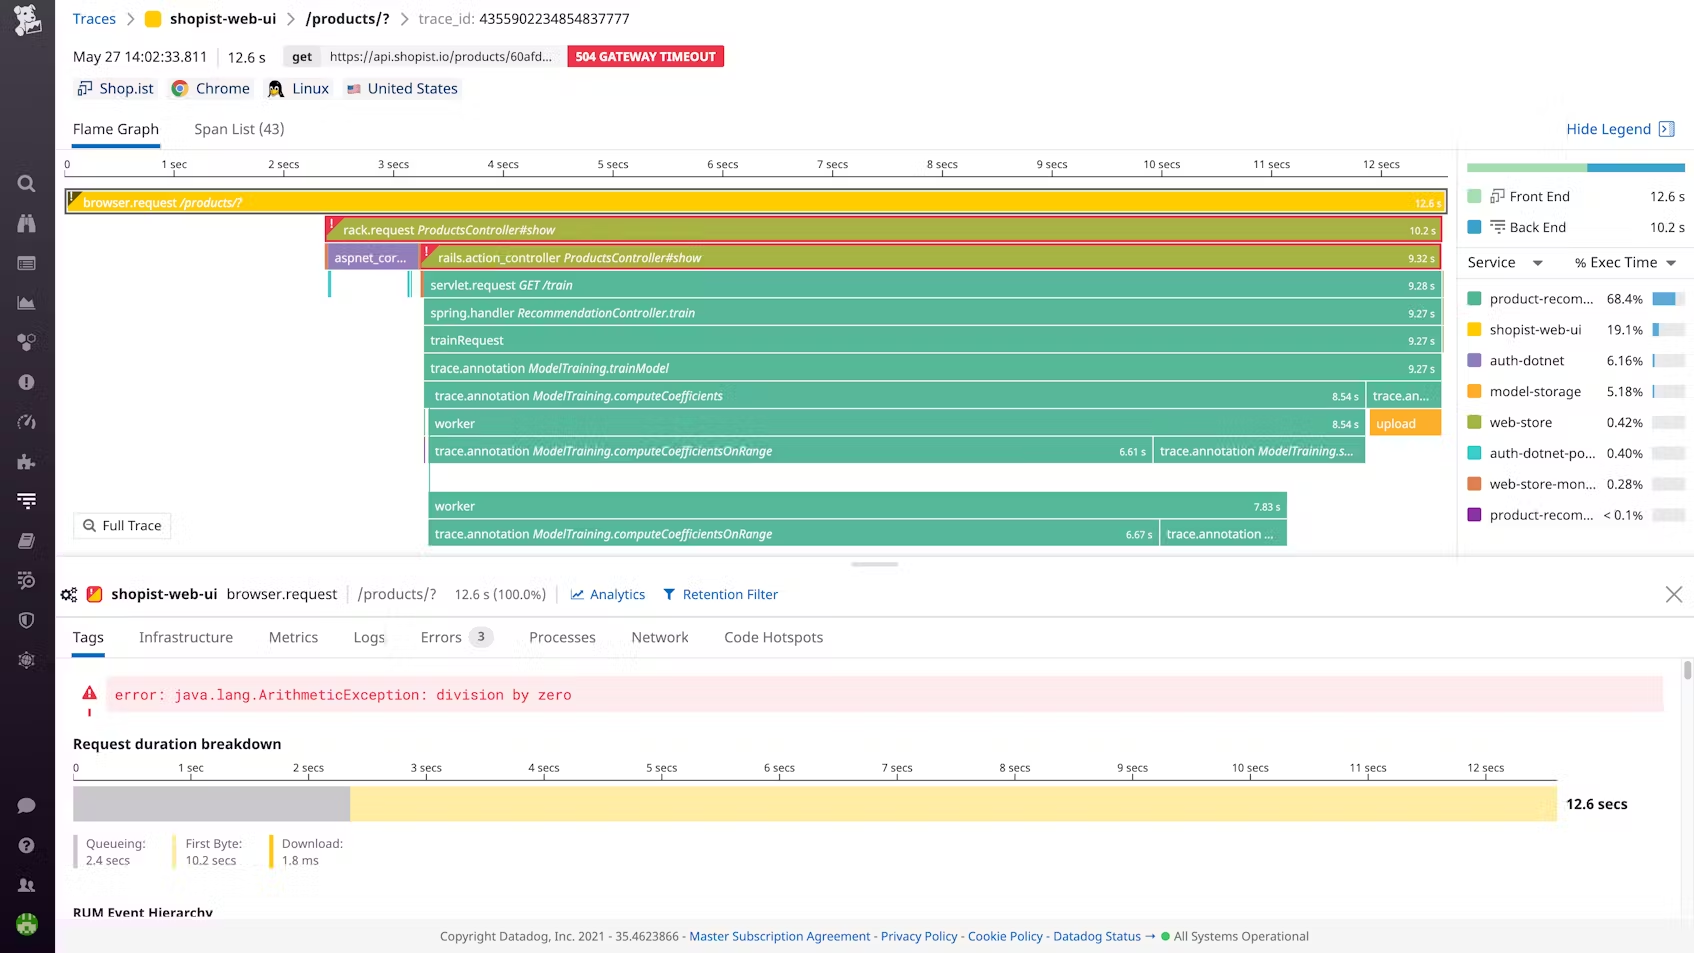
- Datadog is a full-stack observability platform. Its key strength is correlating data across different signals. You can seamlessly pivot from a slow trace to related host metrics, logs, and even user sessions (RUM) within a single UI. This unified context is powerful for rapid troubleshooting.

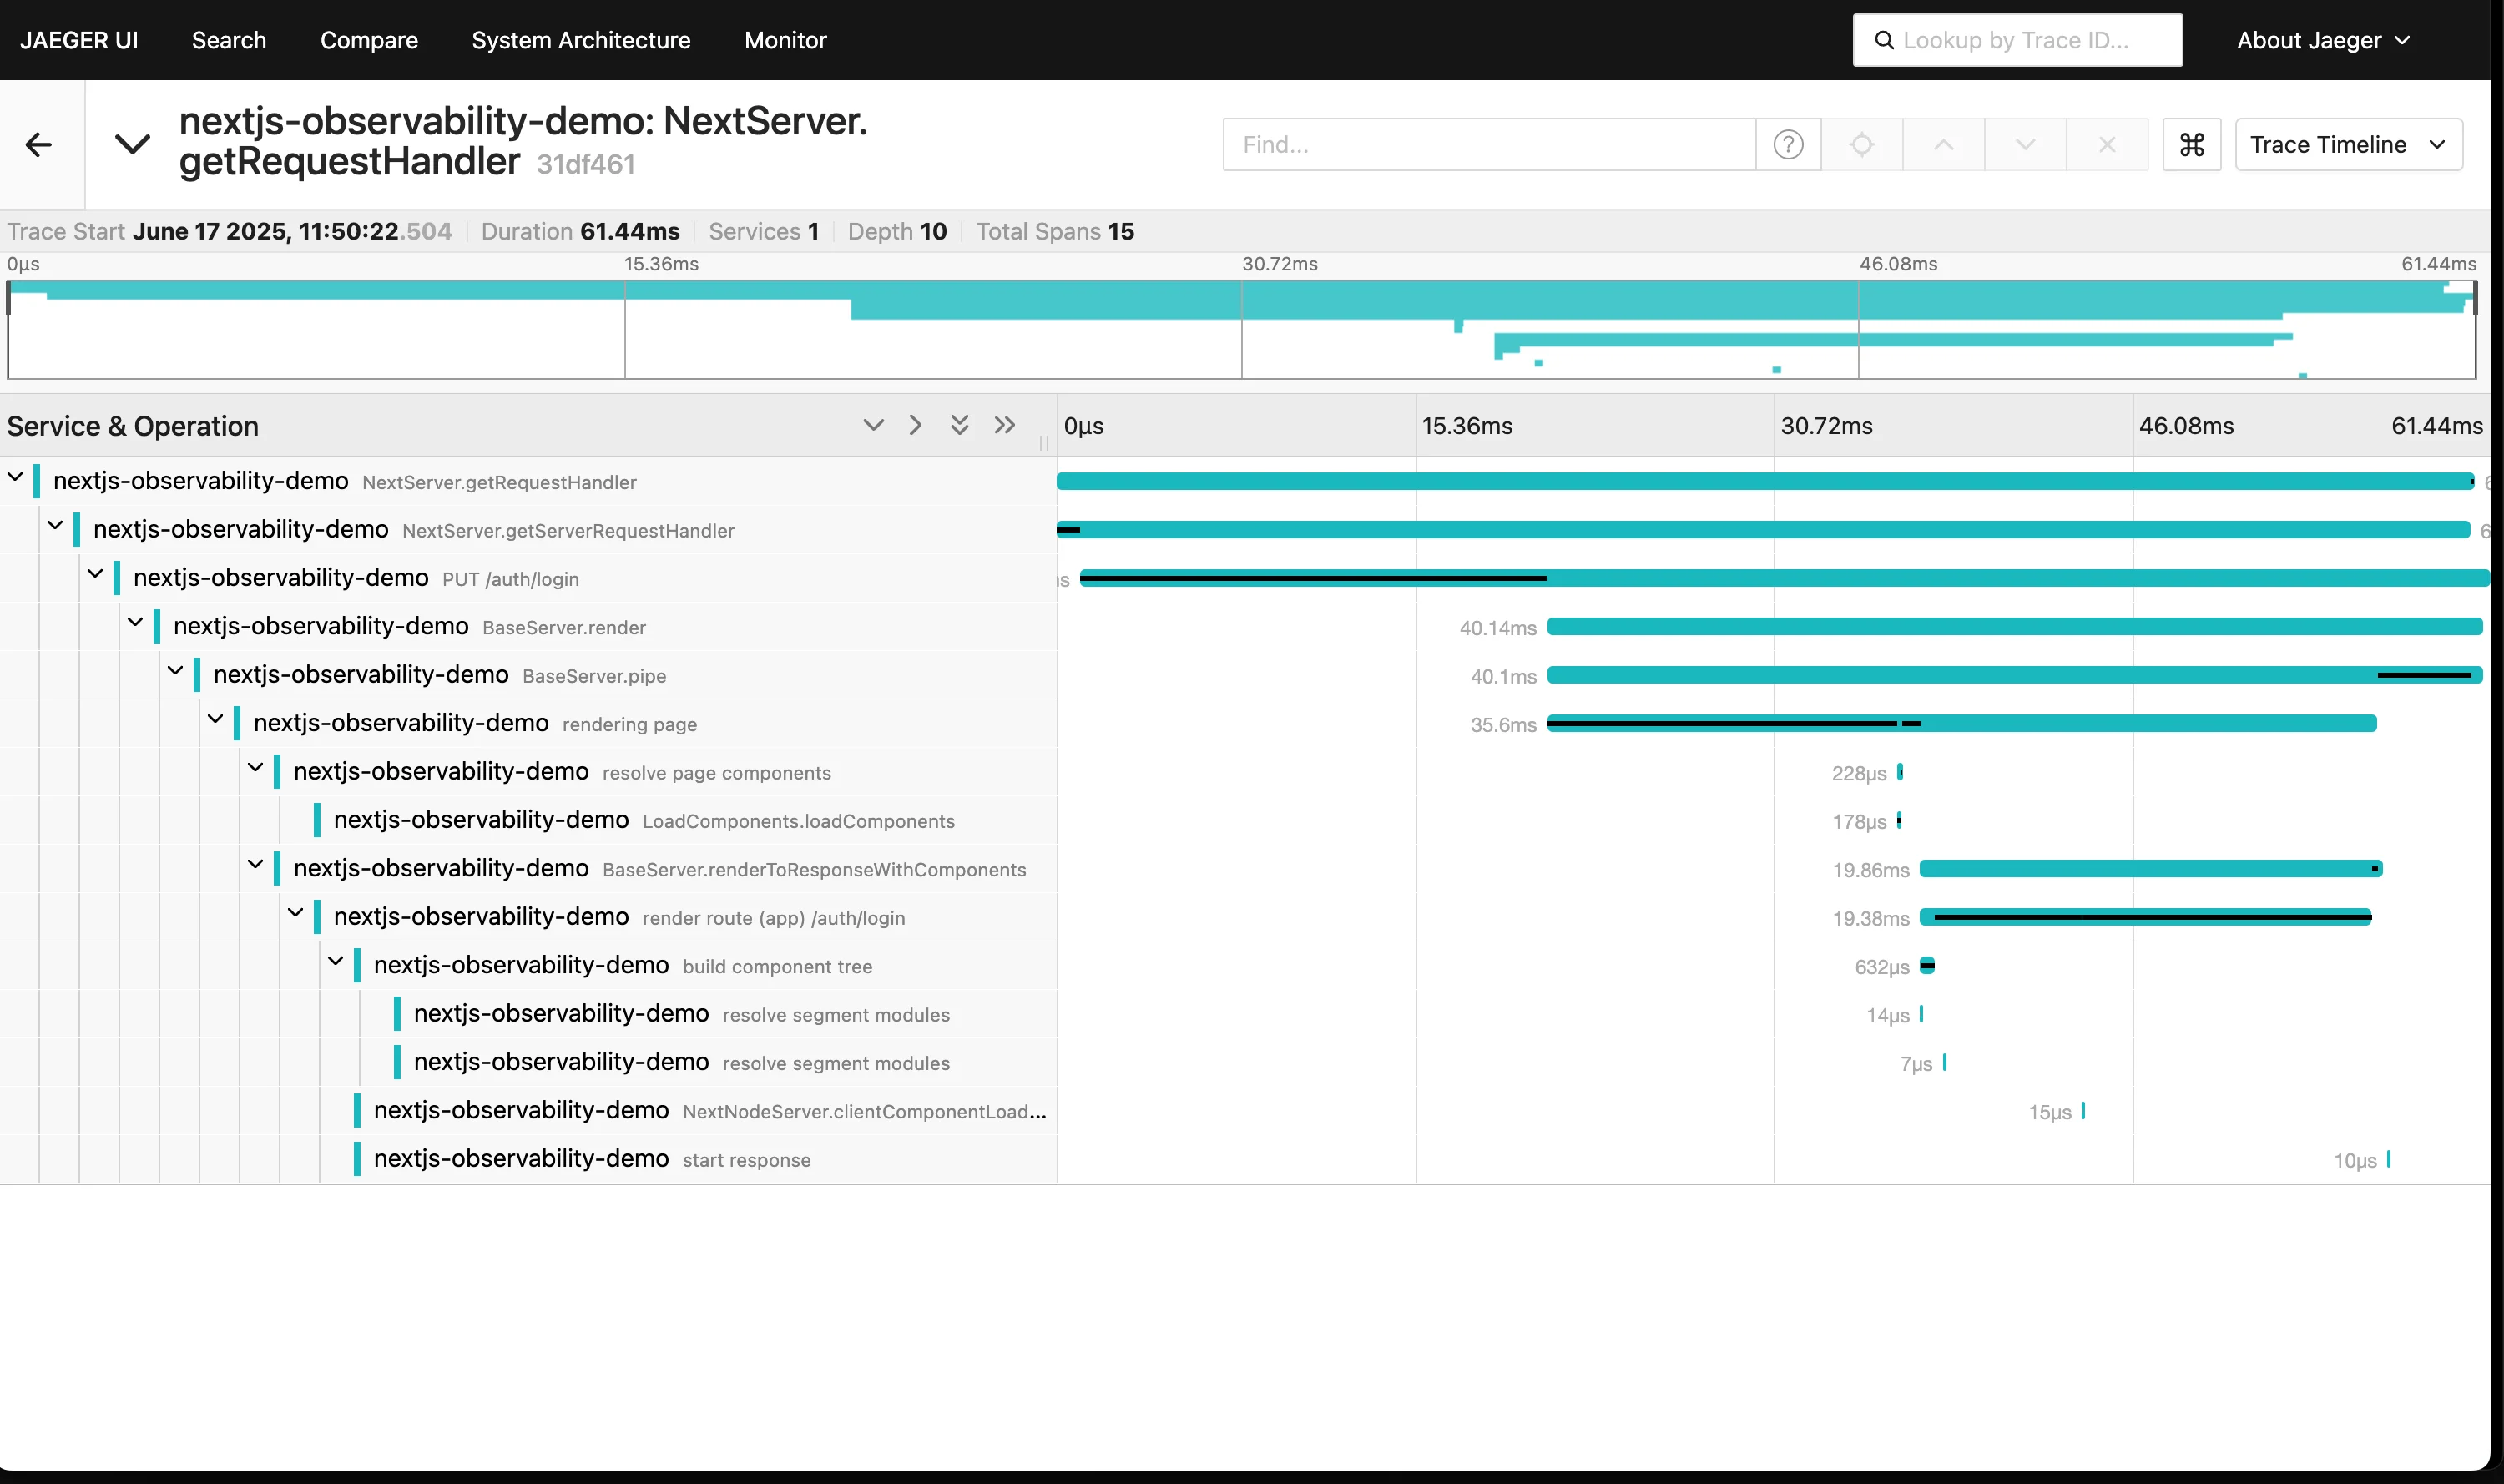
- Jaeger is a specialized distributed tracing tool. It excels at capturing, visualizing, and analyzing traces but does not handle metrics or logs. To get a complete picture, you must integrate it with other tools like Prometheus (for metrics) and Elasticsearch/Loki (for logs), which requires manual effort to correlate data (e.g., by ensuring trace IDs are present in logs).
Instrumentation & Integration: How Much Hand-Holding Do You Need?
How do you get telemetry data from out your apps and into your observability platform? What's the setup complexity and control level?
Datadog offers over 500+ turnkey integrations and auto-instrumentation libraries that make data collection easy. While it supports OpenTelemetry, its ecosystem is primarily designed for a seamless experience with its own agents.
Jaeger integrates primarily through open standards, specifically OpenTelemetry. This prevents vendor lock-in at the code level—you can instrument your applications once with OpenTelemetry and send the data to Jaeger or any other compatible backend. This offers flexibility but requires more hands-on configuration than Datadog's plug-and-play approach.

Pricing Models: The Elephant in the Room
Let's be frank: observability isn't free. But how you pay, and how predictable that bill is, can make or break your budget and even influence your architectural decisions.
Datadog has a complex, usage-based subscription model. You pay per host, per GB of ingested logs, per million indexed log events, for custom metrics, and more. While powerful, this can lead to unpredictable and high costs at scale, forcing teams to make architectural choices to manage their bills. For a detailed breakdown, check out our guide on Datadog Pricing.
Jaeger is free, open-source software. The cost is not in licensing but in the Total Cost of Ownership (TCO). This includes the infrastructure (servers, storage) needed to run it and, more importantly, the engineering time required for setup, maintenance, and scaling. At large scale, this TCO can be significantly lower than a Datadog subscription, but it's a trade-off against engineering resources.
When to Choose Which: Making the Right Call for Your Team
Deciding between Datadog and Jaeger isn't about finding a universally "better" tool; it's about aligning the solution with your team's unique needs, resources, and long-term vision. Here's a practical guide to help you make that call. To help you quickly weigh the trade-offs, let's look at the key advantages and disadvantages of each.
Choose Datadog if:
- You need an all-in-one solution and want to avoid managing multiple tools.
- Time-to-value is critical, and you have the budget for a premium tool.
- Your team has limited operational bandwidth to manage monitoring infrastructure.
- You need advanced features like RUM, Synthetics, or seamless correlation across signals.
Pros:
- Unified Platform: Metrics, traces, and logs in one place.
- Easy to Start: SaaS model means fast setup and low maintenance.
- Powerful Features: Rich integrations, AI-powered anomaly detection, and a polished UI.
- Vendor Support: Official support channels and SLAs.
Cons:
- High Cost: Can become very expensive, especially at scale.
- Complex Pricing: Difficult to predict and control bills.
- Vendor Lock-in: Proprietary platform can be hard to migrate away from.
- Data Privacy: Requires sending telemetry data to a third-party cloud.
Choose Jaeger if:
- Your primary need is a powerful, dedicated distributed tracing system.
- Cost is a major concern, and you have the engineering resources to manage a self-hosted solution.
- You are building a cloud-native stack with open-source tools like Prometheus and Grafana.
- Data privacy and control are paramount, requiring an on-premises or self-hosted deployment.
Pros:
- Free & Open Source: No licensing fees.
- No Vendor Lock-in: Built on open standards like OpenTelemetry.
- Full Control: You control your data, deployment, and configuration.
- Scalable: Proven to handle massive trace volumes.
Cons:
- Traces-Only: Requires other tools for metrics and logs.
- High Operational Overhead: Requires engineering effort to deploy, manage, and scale.
- Lacks Advanced Features: No built-in alerting, anomaly detection, or unified dashboards.
- Community Support: Relies on best-effort community support.
An Alternative: SigNoz - Unified Observability, Open-Source
For teams evaluating Datadog and Jaeger, SigNoz presents a compelling third option that combines the strengths of both: the unified, full-stack experience of Datadog with the open-source, no-vendor-lock-in principles of Jaeger.
For the Jaeger User: Go Beyond Tracing
If you appreciate Jaeger's open-source, deep-tracing capabilities but find yourself needing to manually stitch together metrics and logs, SigNoz is a natural next step. It is a full-stack observability platform, not just a tracer.
- Unified Observability, Natively: SigNoz provides metrics, traces, and logs in a single application. It's built on OpenTelemetry, so the same instrumentation you use for Jaeger can send all three signals to SigNoz. This allows you to correlate a slow trace with relevant host metrics or error logs without switching tools.
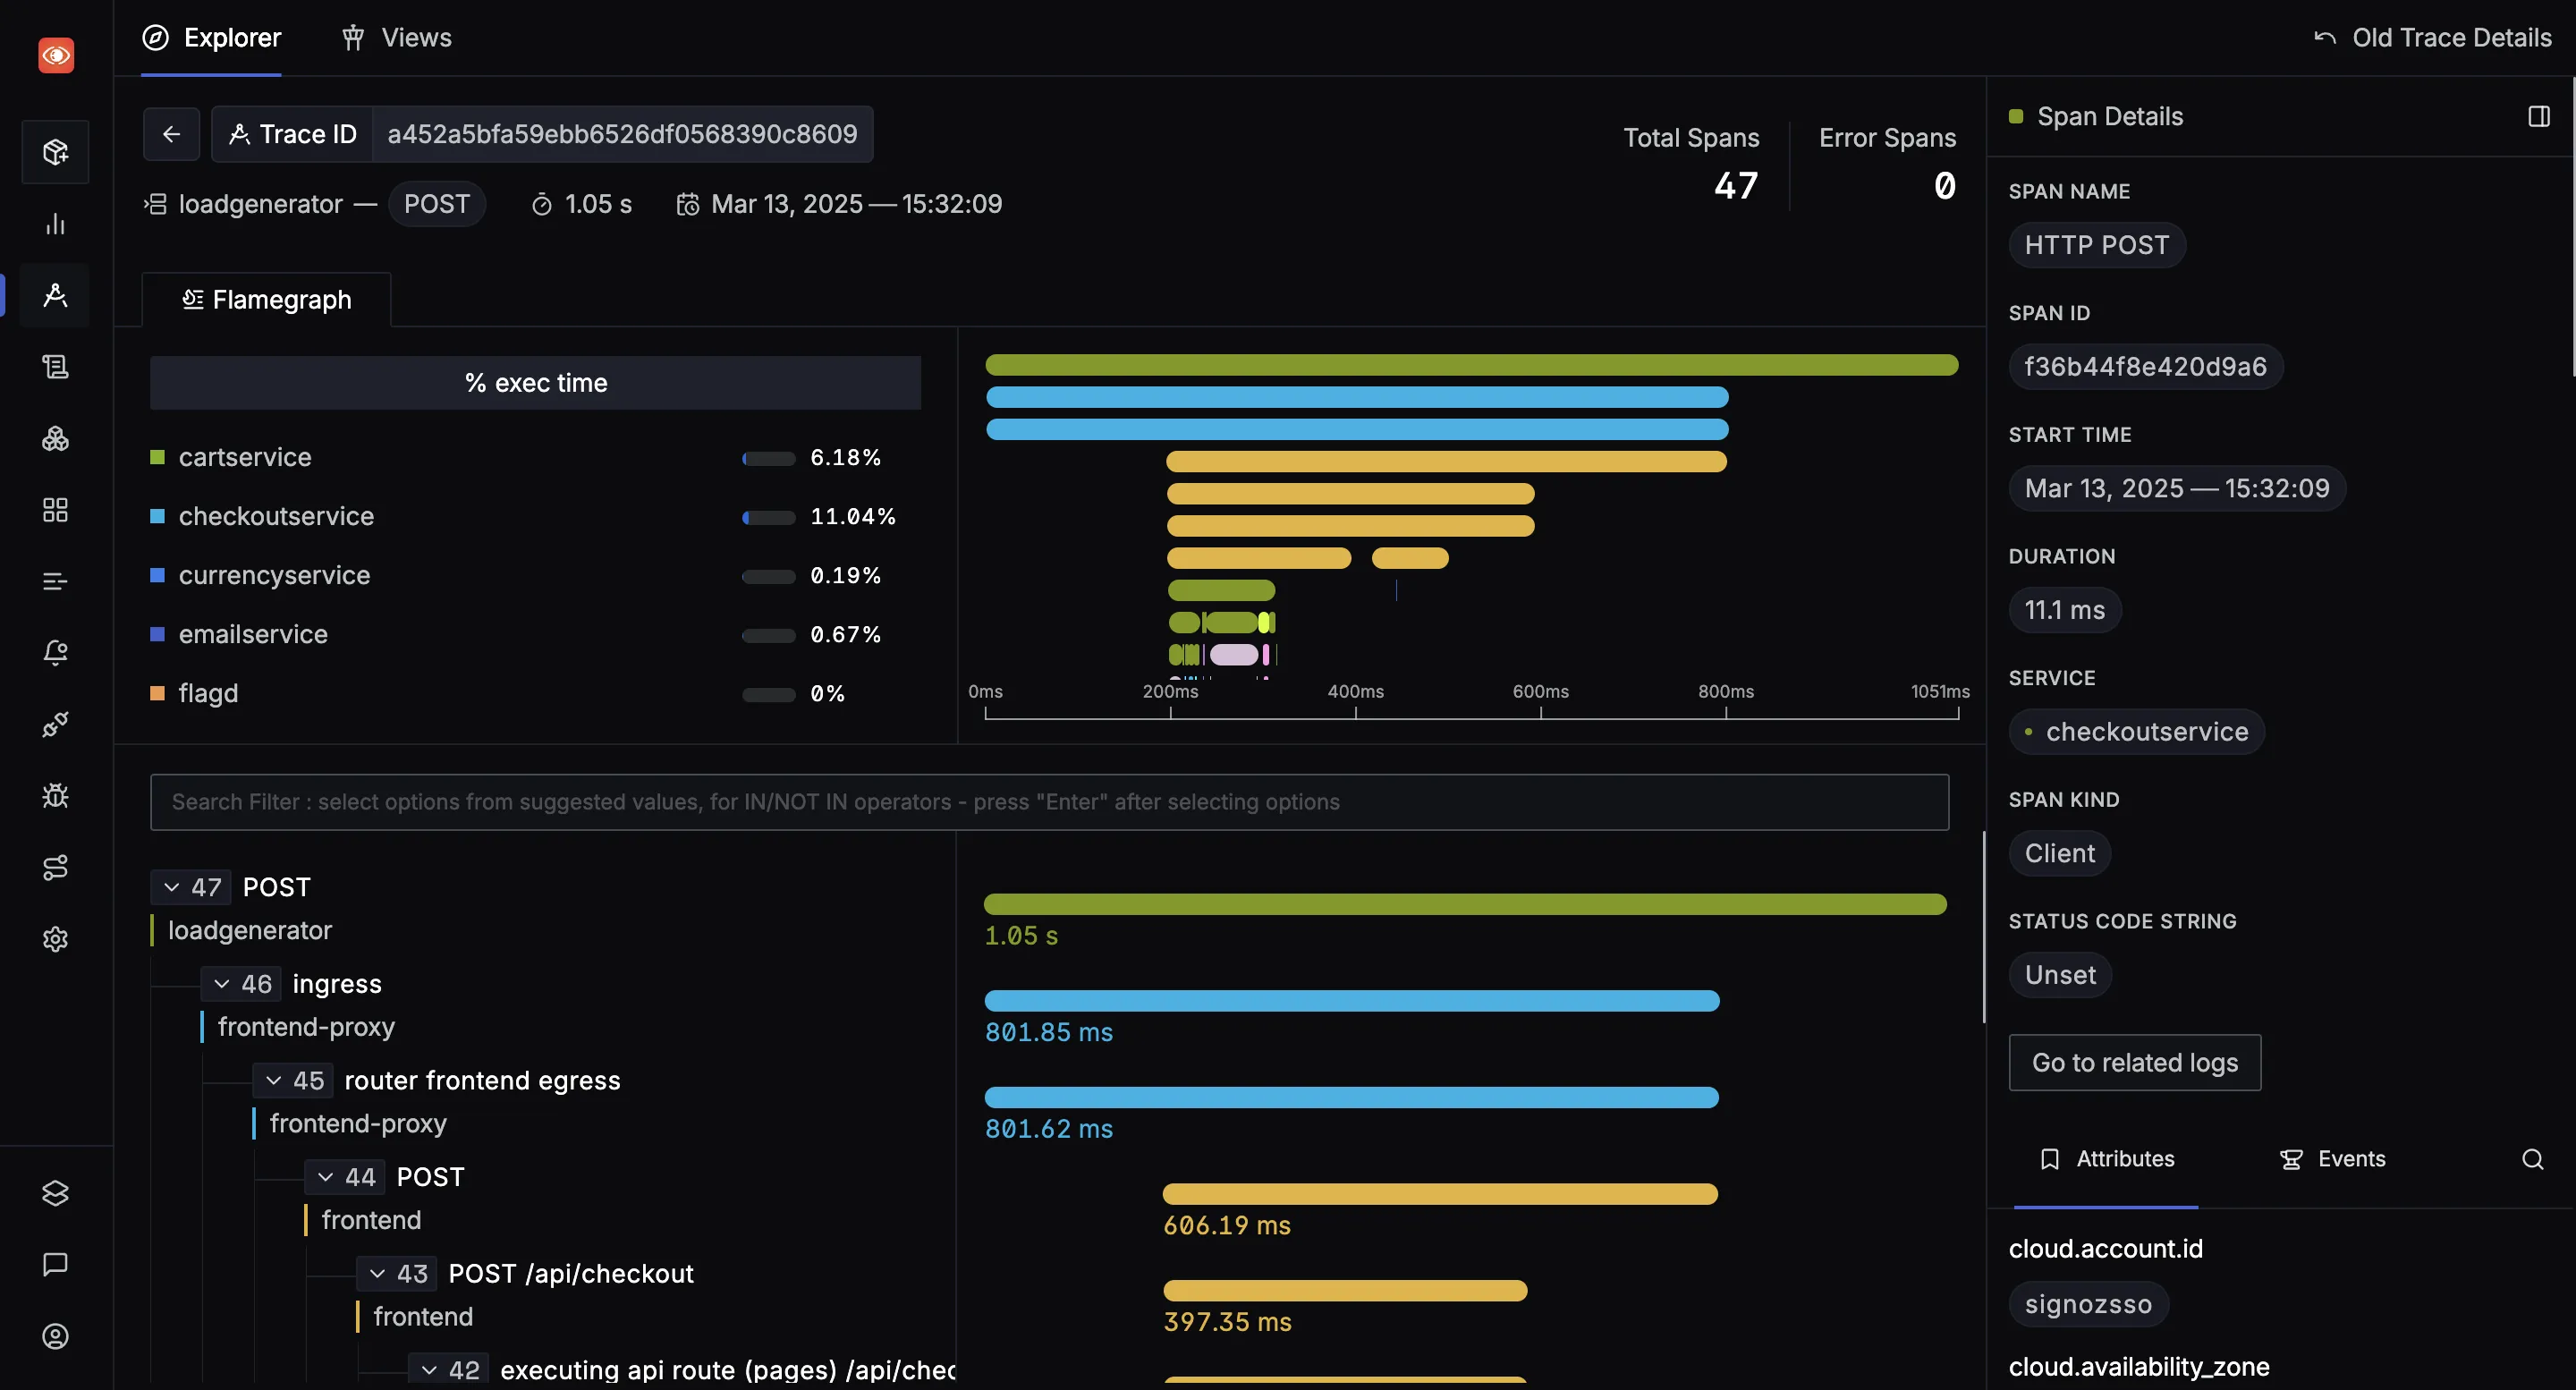
- High-Performance Tracing: SigNoz is engineered to handle high-cardinality, high-volume trace data. It can efficiently process and visualize traces with up to a million spans, a common challenge in complex microservice architectures. This is achieved through a combination of UI virtualization and an optimized backend, ensuring a smooth debugging experience even for the most complex requests.

For the Datadog User: Escape the Cost and Lock-in
If you value Datadog's unified platform but are wary of the cost and proprietary nature, SigNoz offers a clear migration path.
- OpenTelemetry Native: SigNoz is built on OpenTelemetry. Unlike Datadog, where OpenTelemetry metrics are often treated as expensive "custom metrics", SigNoz embraces them natively. This means you can adopt open standards without financial penalty.
- A Clear Migration Path: SigNoz provides detailed documentation for migrating from Datadog. You can switch from the Datadog agent to the OpenTelemetry Collector and re-route your telemetry data to SigNoz. It even provides guidance on converting from DogStatsD to OpenTelemetry metrics, ensuring a smooth transition.
- Transparent, Cost-Effective Pricing: As an open-source tool, SigNoz offers a more predictable and often significantly lower TCO. You can self-host it for maximum control or use the managed cloud version, with pricing based on data volume, not on per-host charges or other complex metrics.
In short, SigNoz offers a powerful, open-source alternative that bridges the gap between the focused tracing of Jaeger and the comprehensive, but costly, platform of Datadog.
SigNoz Cloud is the easiest way to run SigNoz. Sign up for a free account and get 30 days of unlimited access to all features.
You can also install and self-host SigNoz yourself since it is open-source. With 24,000+ GitHub stars, open-source SigNoz is loved by developers. Find the instructions to self-host SigNoz.
Related Content
