How to Monitor PostgreSQL metrics with OpenTelemetry
PostgreSQL metrics monitoring is important to ensure that PostgreSQL is performing as expected and to identify and resolve problems quickly. In this tutorial, you will install OpenTelemetry Collector to collect PostgreSQL metrics and then send the collected data to SigNoz for monitoring and visualization.
In this tutorial, we cover:
- A Brief Overview of PostgreSQL
- A Brief Overview of OpenTelemetry
- How does OpenTelemetry Collector collect data?
- Prerequisites
- Setting up SigNoz
- Setting Up OpenTelemetry Collector
- Monitoring with SigNoz Dashboard
- Conclusion
- Reference: Metrics & Attributes of PostgreSQL supported by OpenTelemetry
- Further Reading
If you want to jump straight into implementation, start with this prerequisites section.
A Brief Overview of PostgreSQL
PostgreSQL is a sophisticated open-source relational database management system catering to everyone from coding rookies to seasoned tech experts. It is often hailed as the "world's most advanced open-source relational database.” It is a robust and versatile database management system that caters to a broad spectrum of developer communities.
Renowned for its extensibility, it supports a myriad of data types and offers advanced indexing, making it adaptable to diverse applications. One of its standout features is ACID compliance, ensuring transactions are reliably processed. With a focus on extensibility, it allows users to define their data types, operators, and functions.
PostgreSQL has the tools to make managing and retrieving information a breeze. Whether you're a novice or an expert in the field, PostgreSQL stands as a reliable and feature-rich database solution.
A Brief Overview of OpenTelemetry
OpenTelemetry is a set of APIs, SDKs, libraries, and integrations aiming to standardize the generation, collection, and management of telemetry data(logs, metrics, and traces). It is backed by the Cloud Native Computing Foundation and is the leading open-source project in the observability domain.
The data you collect with OpenTelemetry is vendor-agnostic and can be exported in many formats. Telemetry data has become critical in observing the state of distributed systems. With microservices and polyglot architectures, there was a need to have a global standard. OpenTelemetry aims to fill that space and is doing a great job at it thus far.
In this tutorial, you will use OpenTelemetry Collector to collect PostgreSQL metrics for performance monitoring.
What is OpenTelemetry Collector?
OpenTelemetry Collector is a stand-alone service provided by OpenTelemetry. It can be used as a telemetry-processing system with a lot of flexible configurations to collect and manage telemetry data.
It can understand different data formats and send it to different backends, making it a versatile tool for building observability solutions.
Read our complete guide on OpenTelemetry Collector
How does OpenTelemetry Collector collect data?
A receiver is how data gets into the OpenTelemetry Collector. Receivers are configured via YAML under the top-level receivers tag. There must be at least one enabled receiver for a configuration to be considered valid.
Here’s an example of an otlp receiver:
receivers:
  otlp:
    protocols:
      grpc:
      http:
An OTLP receiver can receive data via gRPC or HTTP using the OTLP format. There are advanced configurations that you can enable via the YAML file.
Here’s a sample configuration for an otlp receiver.
receivers:
  otlp:
    protocols:
      http:
        endpoint: "localhost:4318"
        cors:
          allowed_origins:
            - http://test.com
            # Origins can have wildcards with *, use * by itself to match any origin.
            - https://*.example.com
          allowed_headers:
            - Example-Header
          max_age: 7200
You can find more details on advanced configurations here.
After configuring a receiver, you must enable it. Receivers are enabled via pipelines within the service section. A pipeline consists of a set of receivers, processors, and exporters.
The following is an example pipeline configuration:
service:
  pipelines:
    metrics:
      receivers: [otlp, prometheus]
      exporters: [otlp, prometheus]
    traces:
      receivers: [otlp, jaeger]
      processors: [batch]
      exporters: [otlp, zipkin]
Now that you understand how OpenTelemetry collector collects data, let’s see how you can collect PostgreSQL metrics with OpenTelemetry. You can find the list of metrics supported by OpenTelemetry here.
Prerequisites
This tutorial assumes that the OpenTelemetry Collector is installed on the same host as the PostgreSQL instance.
User for OpenTelemetry - The OpenTelemetry Collector for PostgreSQL needs to have permission for SELECT on pg_stat_database. You can create a dedicated user for OpenTelemetry and grant it the necessary permissions. To create a user & grant access for OpenTelemetry, you can use the following commands:
-- Create a new user with a password
CREATE USER your_username WITH PASSWORD 'your_password';

-- Grant SELECT privilege on pg_stat_database to the new user
GRANT SELECT ON pg_stat_database TO your_username;
If PostgreSQL is not on the same server as OpenTelemetry Collector
In this article, our assumption is your PostgreSQL server, and your OpenTelemetry collector will be on the same server. If this is not the case, then you should do an extra step to open your PostgreSQL service port (assuming 5432).
Open TCP port 5432 - The OpenTelemetry Collector for PostgreSQL communicates with the databases over TCP port. Therefore, you need to open the port.
To open TCP port 5432 on a Linux server, you can use the following command:
sudo ufw allow 5432/tcIf you are using some firewall for your VMs to block inbound traffic there too you would need to allow 5432 port.
Once you have completed these preparations, you can install and run the OpenTelemetry Collector for PostgreSQL.
Setting up SigNoz
You need a backend to which you can send the collected data for monitoring and visualization. SigNoz is an OpenTelemetry-native APM that is well-suited for visualizing OpenTelemetry data.
SigNoz cloud is the easiest way to run SigNoz. You can sign up here for a free account and get 30 days of unlimited access to all features.
You can also install and self-host SigNoz yourself. Check out the docs for installing self-host SigNoz.
Setting Up OpenTelemetry Collector
The OpenTelemetry Collector offers various deployment options to suit different environments and preferences. It can be deployed using Docker, Kubernetes, Nomad, or directly on Linux systems. You can find all the installation options here.
We are going to discuss the manual installation here and resolve any hiccups that come in the way.
Step 1 - Downloading OpenTelemetry Collector
Download the appropriate binary package for your Linux or macOS distribution from the OpenTelemetry Collector releases page. We are using the latest version available at the time of writing this tutorial.
For MACOS (arm64):
curl --proto '=https' --tlsv1.2 -fOL https://github.com/open-telemetry/opentelemetry-collector-releases/releases/download/v0.116.0/otelcol-contrib_0.116.0_darwin_arm64.tar.gzStep 2 - Extracting the package
Create a new directory named otelcol-contrib and then extract the contents of the otelcol-contrib_0.116.0_darwin_arm64.tar.gz archive into this newly created directory with the following command:
mkdir otelcol-contrib && tar xvzf otelcol-contrib_0.116.0_darwin_arm64.tar.gz -C otelcol-contribStep 3 - Setting up the Configuration file
Create a config.yaml file in the otelcol-contrib folder. This configuration file will enable the collector to connect with PostgreSQL and have other settings like at what frequency you want to monitor the instance.
The config file has a receiver enabled for hostmetrics too which will enable you to
Go into the directory:
cd otelcol-contribCreate config.yaml in folder otelcol-contrib with the below content in it.
receivers:
  hostmetrics:
    collection_interval: 30s
    scrapers:
      cpu: {}
      disk: {}
      load: {}
      filesystem: {}
      memory: {}
      network: {}
      paging: {}
      process:
        mute_process_name_error: true
        mute_process_exe_error: true
        mute_process_io_error: true
      processes: {}
  postgresql:
    endpoint: <POSTGRESQL_URL>:<POSTGRESQL_PORT>
    username: <POSTGRESQL_USERNAME>
    password: <POSTGRESQL_PASSWORD>
  postgresql/all:
    endpoint: <POSTGRESQL_URL>:<POSTGRESQL_PORT>
    transport: tcp
    username: <POSTGRESQL_USERNAME>
    password: <POSTGRESQL_PASSWORD>
    databases:
      - <YOUR DATABASE 1>
      - <YOUR DATABASE 2>
        # ... All databases you want to monitor
    collection_interval: 10s
    tls:
      insecure: true
      insecure_skip_verify:
        true
        # If your postgresql is connected by ssl you can use following settings
        # insecure: false
    # insecure_skip_verify: false
    # ca_file: /home/otel/authorities.crt
    # cert_file: /home/otel/mypostgrescert.crt
    # key_file: /home/otel/mypostgreskey.key
processors:
  batch:
    send_batch_size: 1000
    timeout: 10s
  # Ref: https://github.com/open-telemetry/opentelemetry-collector-contrib/blob/main/processor/resourcedetectionprocessor/README.md
  resourcedetection:
    detectors: [env, system, ec2] # include ec2 for AWS, gcp for GCP and azure for Azure.
    # Using OTEL_RESOURCE_ATTRIBUTES envvar, env detector adds custom labels.
    timeout: 2s
    override: false
    system:
      hostname_sources: [os] # alternatively, use [dns,os] for setting FQDN as host.name and os as fallback
exporters:
  otlp:
    endpoint: "ingest.{region}.signoz.cloud:443" # replace {region} with your region
    tls:
      insecure: false
    headers:
      "signoz-ingestion-key": <SIGNOZ_INGESTION_KEY>
  debug:
    verbosity: detailed
service:
  telemetry:
    metrics:
      address: localhost:8888
  pipelines:
    metrics:
      receivers: [postgresql, postgresql/all]
      processors: [batch]
      exporters: [otlp]
    metrics/hostmetrics:
      receivers: [hostmetrics]
      processors: [resourcedetection, batch]
      exporters: [otlp]
You would need to replace the following details for the config to work properly:
- Endpoint for your PostgreSQL instance. In place of POSTGRESQL_URL and port in place of POSTGRESQL_PORT
- Details of username that can be used for monitoring. (set in prerequisites section) username:
<POSTGRESQL_USERNAME>password:<POSTGRESQL_PASSWORD> - Add all the database names you want to monitor in place of
<YOUR DATABASE 1>,<YOUR DATABASE 2> - Under exporters, configure the
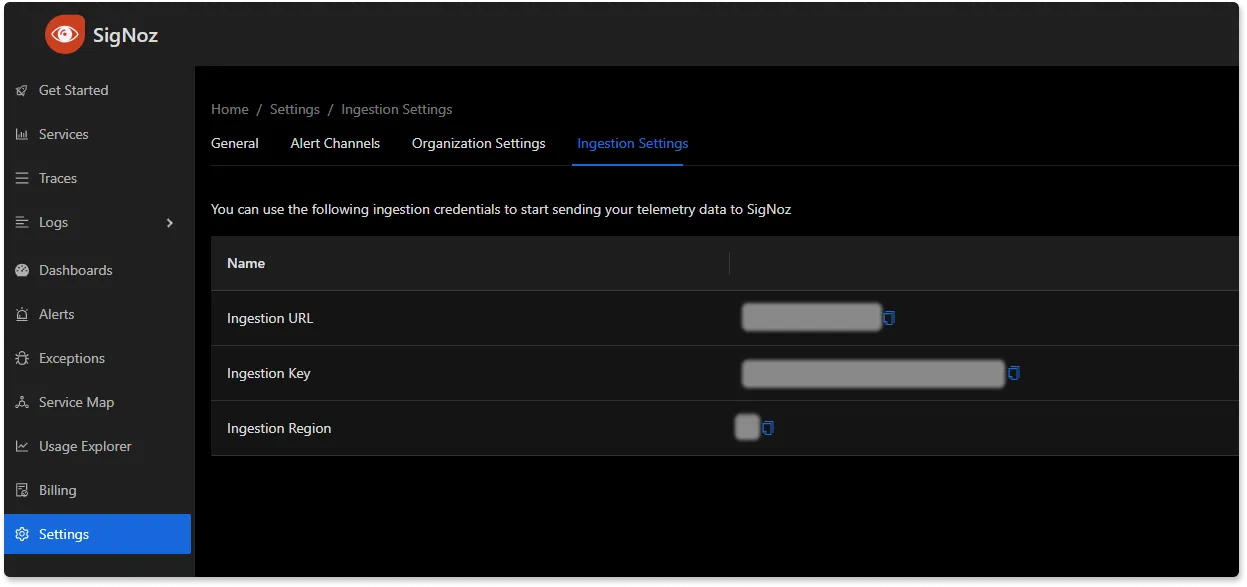
endpointfor SigNoz cloud along with the ingestion key undersignoz-ingestion-key. You can find these settings in the SigNoz dashboard.
Also note how we have set up the pipeline in the service section of the config. We have added postgresql and postgresql/all in the receiver section of metrics and set the exporter to otlp.
Step 4 - Running the collector service
Every Collector release includes an otelcol executable that you can run. Since we’re done with configurations, we can now run the collector service with the following command.
From the otelcol-contrib, run the following command:
./otelcol-contrib --config ./config.yamlIf you want to run it in the background:
./otelcol-contrib --config ./config.yaml &> otelcol-output.log & echo "$\!" > otel-pidStep 5 - Debugging the output
If you want to see the output of the logs, we’ve just set up for the background process. You may look it up with:
tail -f -n 50 otelcol-output.logtail 50 will give the last 50 lines from the file otelcol-output.log
You can check if your service is running successfully by seeing the last log something like -
2023-11-17T19:33:20.161Z info service@v0.116.0/service.go:169 Everything is ready. Begin running and processing data.You can stop the collector service with the following command:
kill "$(< otel-pid)"Monitoring with SigNoz Dashboard
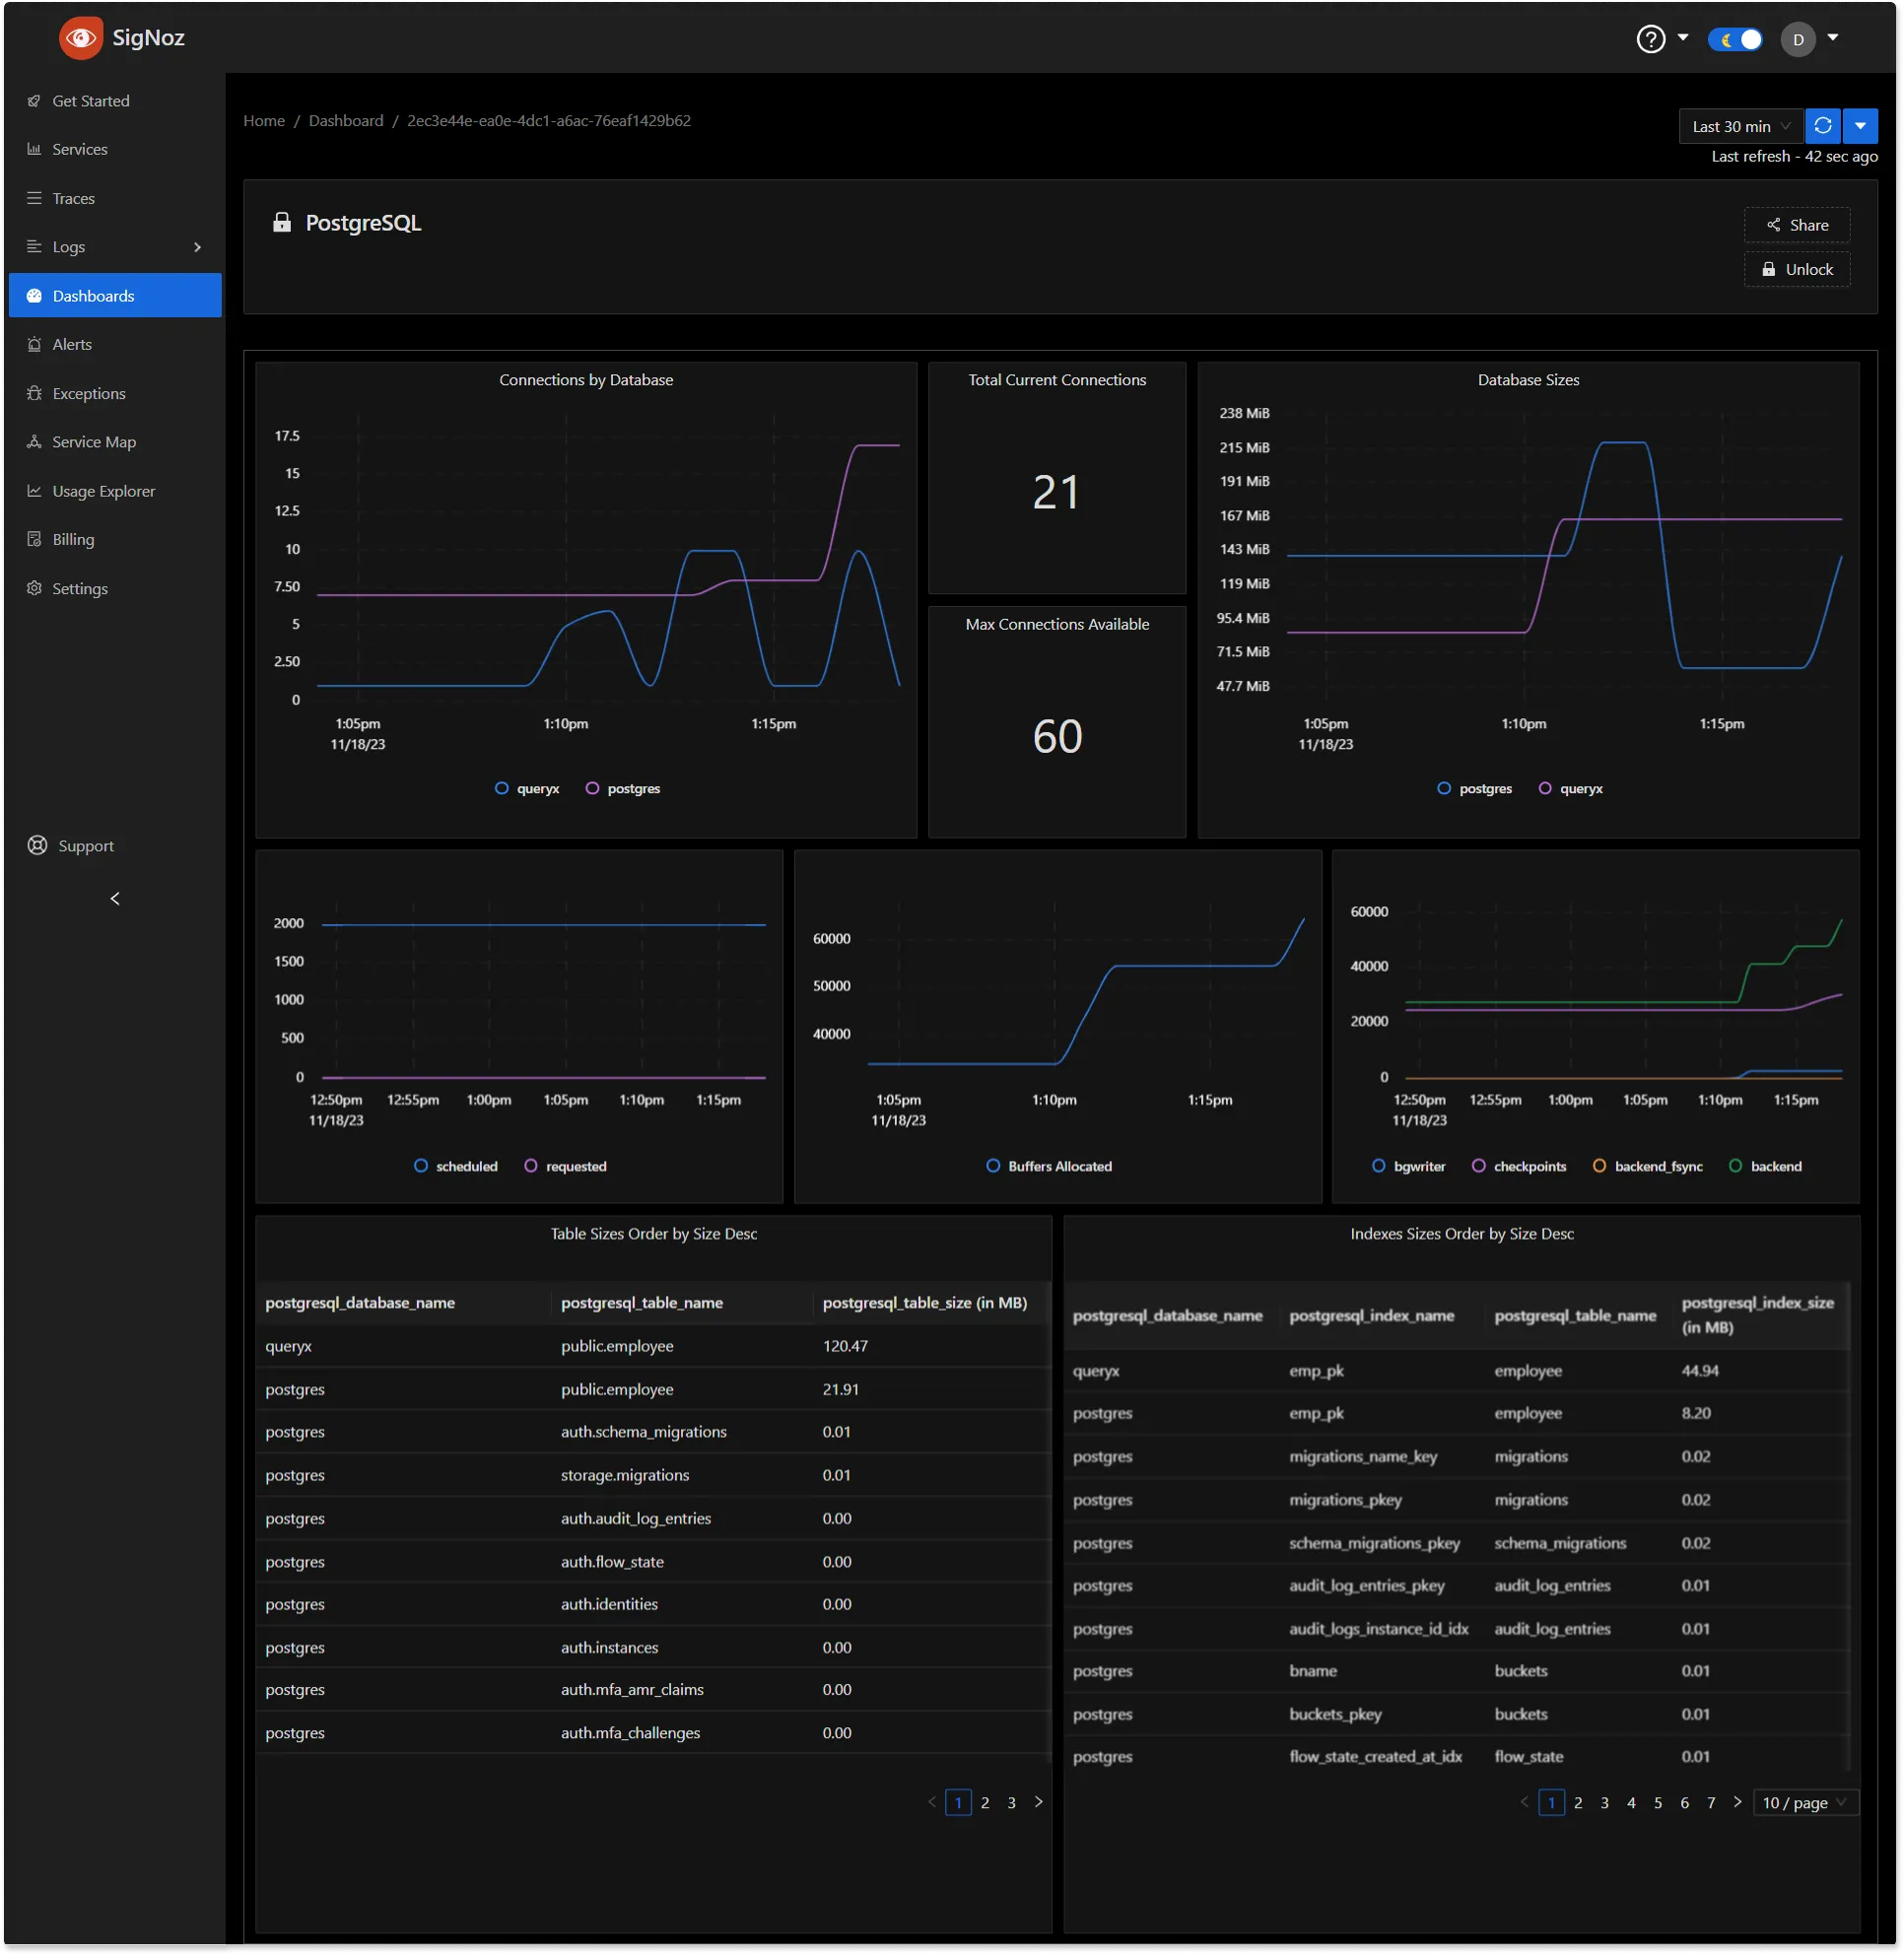
Once the above setup is done, you will be able to access the metrics in the SigNoz dashboard. You can go to the Dashboards tab and try adding a new panel. You can learn how to create dashboards in SigNoz here.
PostgreSQL Metrics
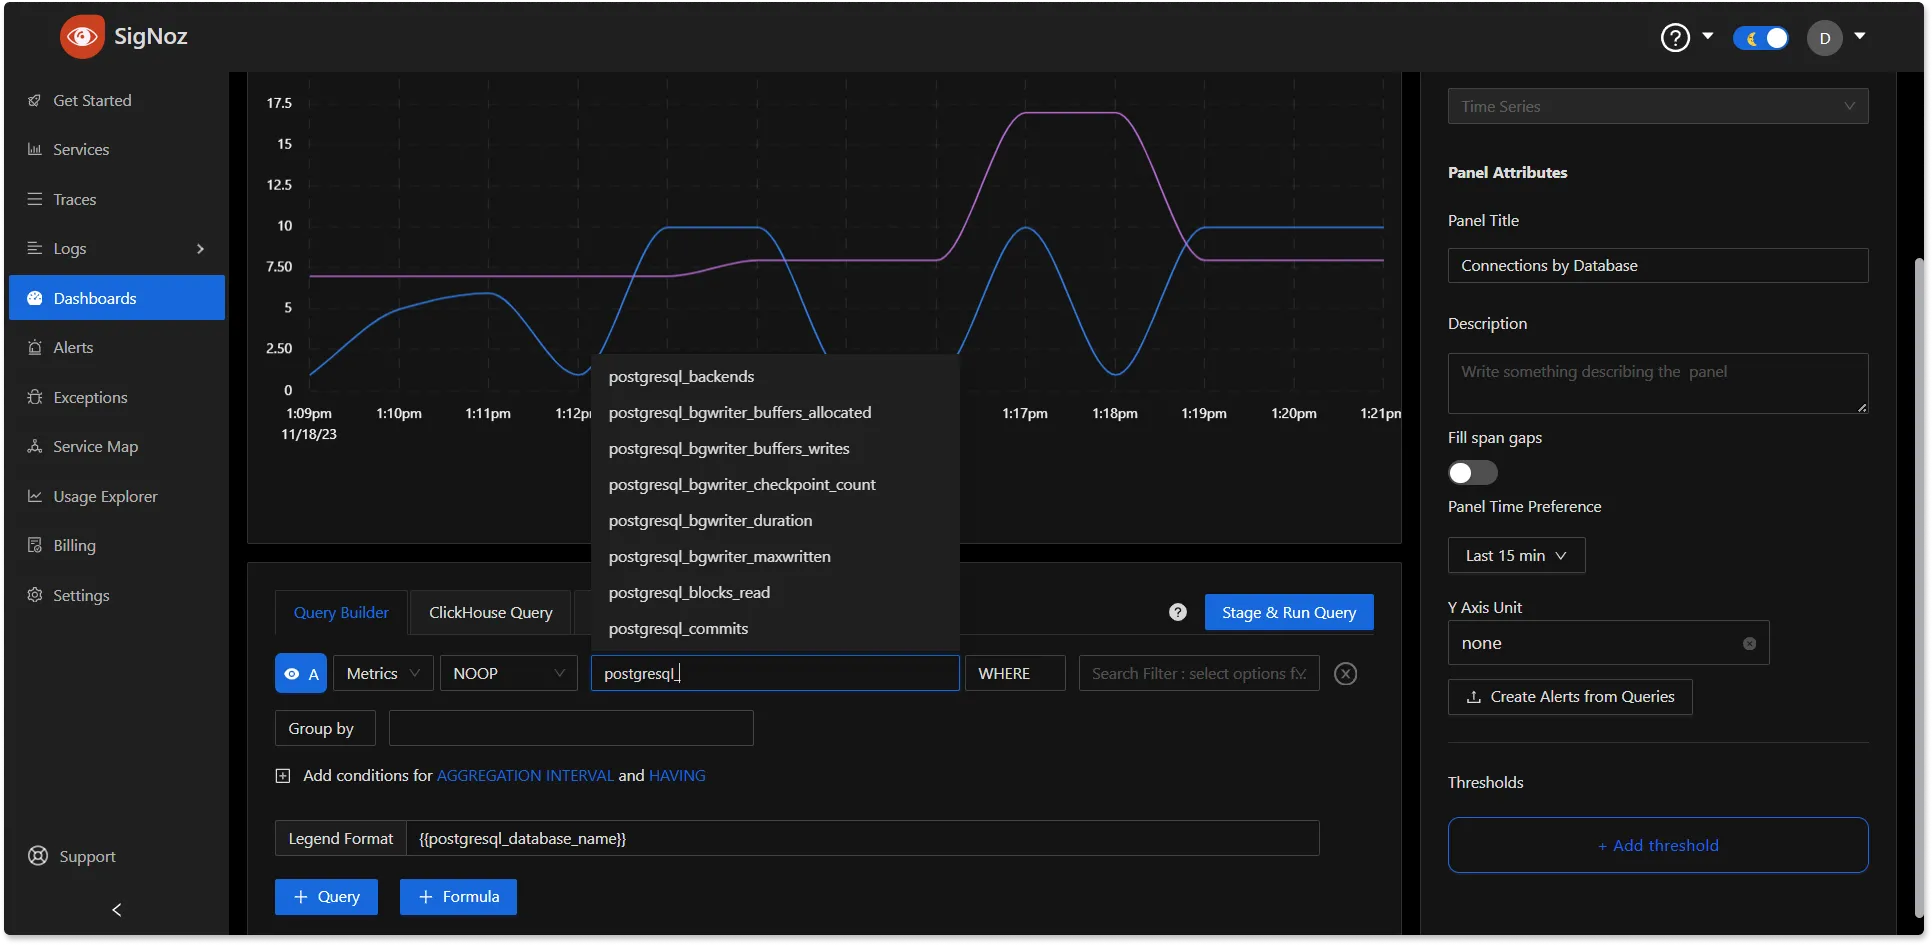
If you want to get started quickly with PostgreSQL monitoring, you can load this JSON in SigNoz dashboard and get started.
PostgreSQL Panel
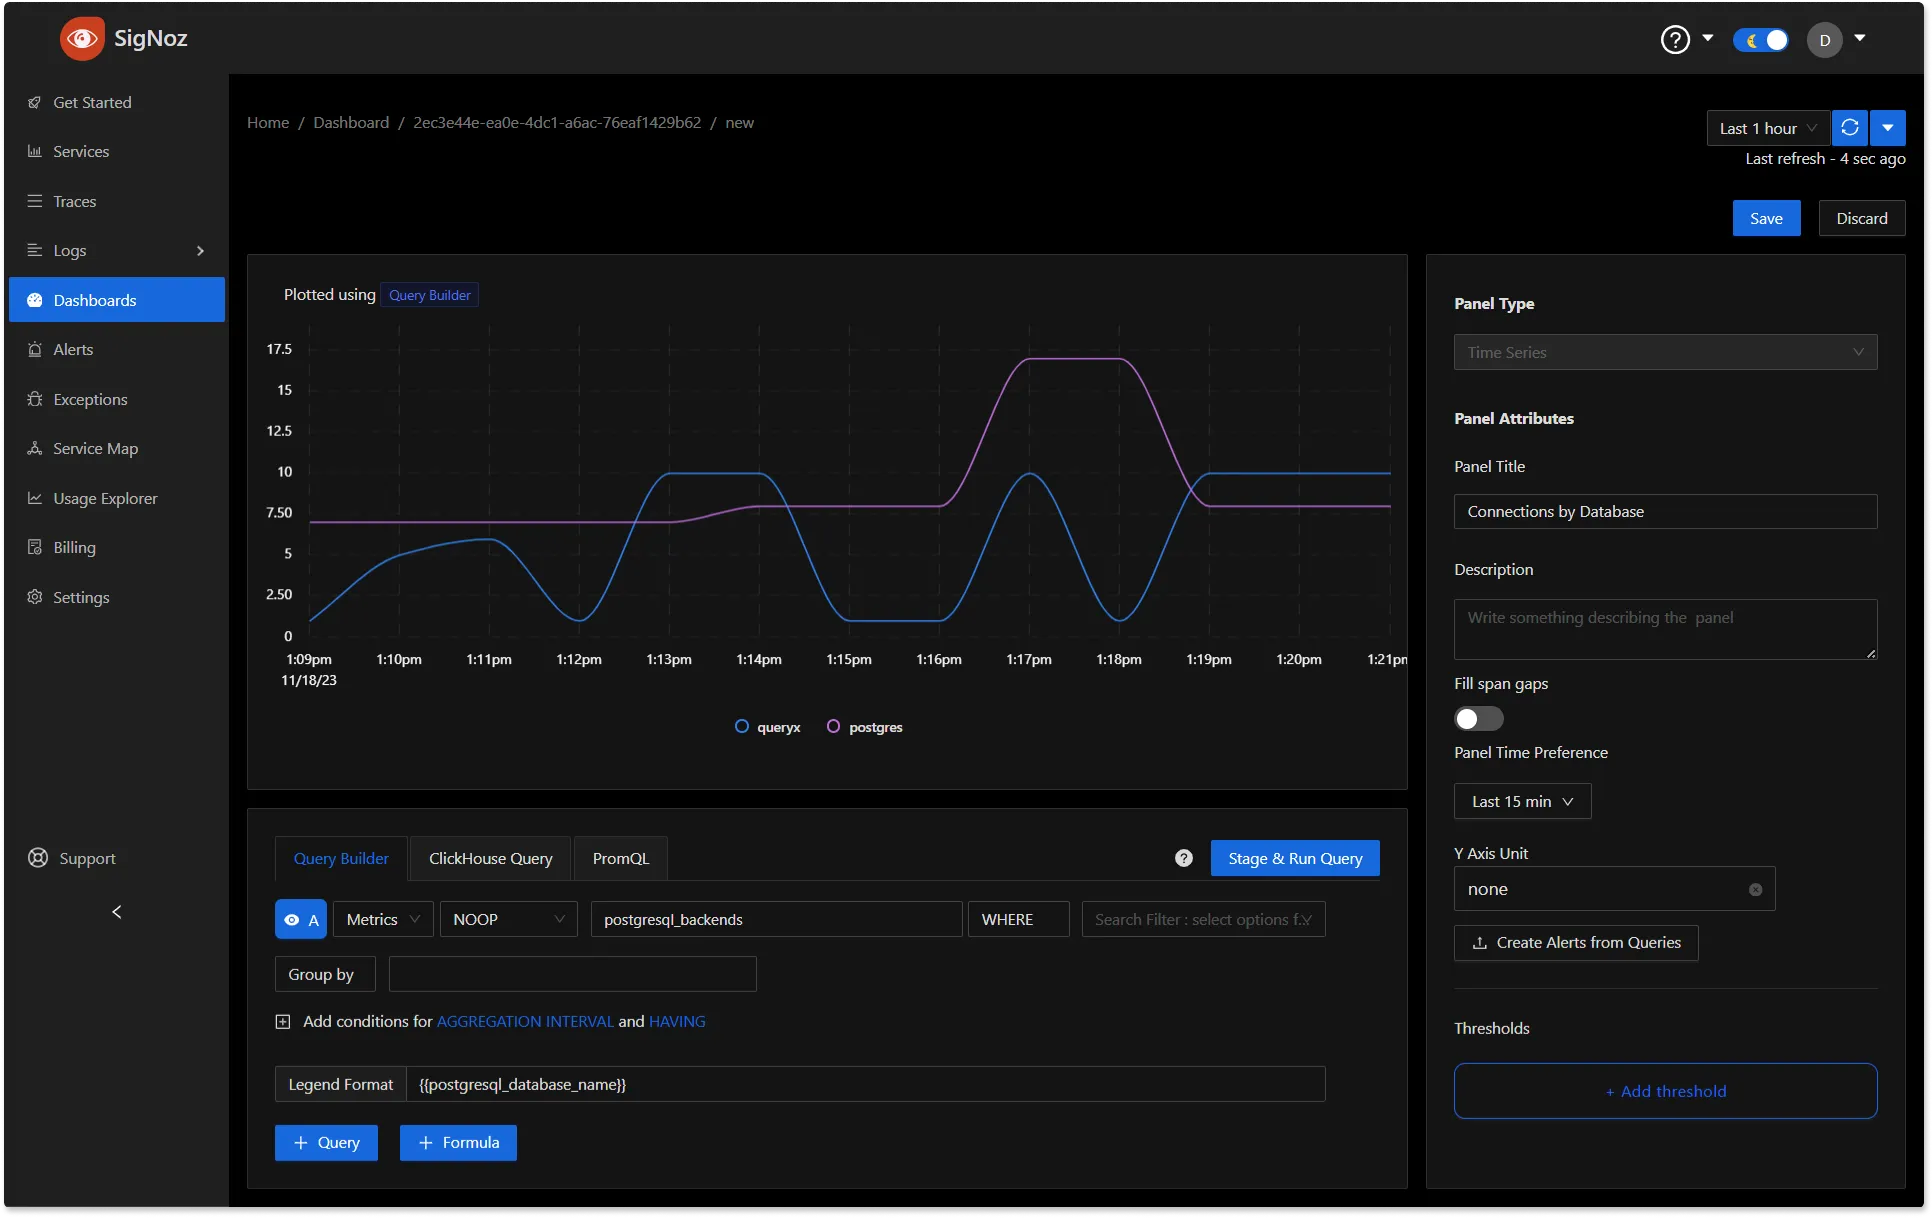
PostgreSQL basic metrics dashboard
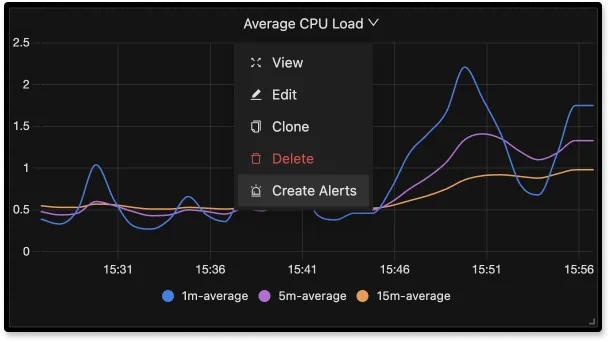
You can also create alerts on any metric. Learn how to create alerts here.
Metrics & Attributes for PostgreSQL supported by OpenTelemetry
The following metrics and resource attributes for PostgreSQL can be collected by the Opentelemetry Collector.
Metrics
These metrics are enabled by default. Collectors provide many metrics that you can use to monitor how your PostgreSQL server is performing or if something is not right.
Key Terms for Metrics & Attributes
Name: The name of the metric is a unique identifier that distinguishes it from other metrics. It helps in referencing and organizing various metrics on SigNoz as well.
Type: The type of metric defines the kind of data it represents. Common metric types include INT, DOUBLE, STRING, etc.
Unit: The unit specifies the measurement unit associated with the metric. It helps in interpreting and comparing metric values, including Bytes, NONE, etc.
Temporality: It involves understanding the temporal patterns and fluctuations within the data, providing insights into how the metric evolves over time. Temporality is crucial for analyzing trends, identifying patterns, and making informed decisions based on the temporal behavior of the observed metric.
Monotonicity: It refers to the cumulative nature of a metric, indicating that its values continuously increase or remain non-decreasing over time. This property is crucial for tracking cumulative values, such as the total count of events or occurrences.
| Metric | Description | Name | Type | Value Type | Unit | Temporality | Monotonic |
|---|---|---|---|---|---|---|---|
| Backends | The number of backends | postgresql.backends | SUM | INT | NONE | Cumulative | false |
| Maximum Connections | Configured maximum number of client connections allowed | postgresql.connection.max | GAUGE | INT | NONE | N/A | N/A |
| Database Counts | Number of user databases | postgresql.database.count | SUM | INT | NONE | Cumulative | false |
| Database Size | The database disk usage | postgresql.db_size | SUM | INT | Bytes | Cumulative | false |
| Index Scans | The number of index scans on a table | postgresql.index.scans | SUM | INT | NONE | Cumulative | true |
| Index Scans | The number of index scans on a table | postgresql.index.scans | SUM | INT | NONE | Cumulative | true |
| Index Size | The size of the index on disk | postgresql.index.size | GAUGE | INT | Bytes | N/A | N/A |
| Database Operations | The number of db row operations | postgresql.operations | SUM | INT | NONE | Cumulative | true |
| Delay in Replication | The amount of data delayed in replication | postgresql.replication.data_delay | GAUGE | INT | Bytes | N/A | N/A |
| Rollbacks | The number of rollbacks | postgresql.rollbacks | SUM | INT | NONE | Cumulative | true |
| Total Rows | The number of rows in the database | postgresql.rows | SUM | INT | NONE | Cumulative | false |
| Total Tables | Number of user tables in a database | postgresql.table.count | SUM | INT | NONE | Cumulative | false |
| Table Sizes | Disk space used by a table | postgresql.table.size | SUM | INT | Bytes | Cumulative | false |
| Table Vacuum | Number of times a table has manually been vacuumed | postgresql.table.vacuum.count | SUM | INT | NONE | Cumulative | true |
| WAL File Age | Age of the oldest WAL file. This metric requires WAL to be enabled with at least one replica. | postgresql.wal.age | GAUGE | INT | seconds | N/A | N/A |
| WAL File Lag | Time between flushing recent WAL locally and receiving notification that the standby server has completed an operation with it. | ||||||
| This metric requires WAL to be enabled with at least one replica. | postgresql.wal.lag | GAUGE | INT | seconds | N/A | N/A | |
| Background Writer Buffer Allocated | Number of buffers allocated | postgresql.bgwriter.buffers.allocated | SUM | INT | NONE | Cumulative | true |
| Background Writer Buffer Writes | Number of buffers written | postgresql.bgwriter.buffers.writes | SUM | INT | NONE | Cumulative | true |
| Background Writer Checkpoint Count | The number of checkpoints performed | postgresql.bgwriter.checkpoint.count | SUM | INT | NONE | Cumulative | true |
| Background Writer Duration | Total time spent writing and syncing files to disk by checkpoints | postgresql.bgwriter.duration | SUM | DOUBLE | Milliseconds | Cumulative | true |
| Background Writer Maximum Written | Number of times the background writer stopped a cleaning scan because it had written too many buffers | postgresql.bgwriter.maxwritten | SUM | INT | NONE | Cumulative | true |
| Blocks Read | The number of blocks read | postgresql.blocks_read | SUM | INT | NONE | Cumulative | true |
| Commits | The number of commits | postgresql.commits | SUM | INT | NONE | Cumulative | true |
Optional Metrics
These metrics are not emitted by default. Each of them can be enabled by applying the following configuration:
metrics:
  <metric_name>:
enabled: true| Metric | Description | Name | Type | Value Type | Unit | Temporality | Monotonic |
|---|---|---|---|---|---|---|---|
| Database Locks | The number of database locks | postgresql.database.locks | GAUGE | INT | NONE | N/A | N/A |
| Deadlocks | The number of deadlocks | postgresql.deadlocks | SUM | INT | NONE | Cumulative | true |
| Sequential Scans | The number of sequential scans | postgresql.sequential_scans | SUM | INT | NONE | Cumulative | true |
| Temp Files | The number of temp files | postgresql.temp_files | SUM | INT | NONE | Cumulative | true |
| WAL Delay | The time between flushing recent WAL locally and receiving notification that the standby server has completed an operation with it. This metric requires WAL to be enabled with at least one replica | postgresql.wal.delay | GAUGE | DOUBLE | seconds | N/A | N/A |
Attributes
| Metric | Attribute | Description | Value Type | Values |
|---|---|---|---|---|
| Background Buffer Writes | source | The source of a buffer write | STRING | backend, backend_fsync, checkpoints, bgwriter |
| Background Checkpoint Count | type | The type of checkpoint state | STRING | requested, scheduled |
| Background Writer Duration | type | The type of time spent during the checkpoint | STRING | sync, write |
| Blocks Read | source | The block read source type | STRING | heap_read, heap_hit, idx_read, idx_hit, toast_read, toast_hit, tidx_read, tidx_hit |
| Database Operations | operation | The database operation | STRING | ins, upd, del, hot_upd |
| Delay in Replication | replication_client | The IP address of the client connected to this backend. If this field is "unix", it indicates either that the client is connected via a Unix socket | STRING | ANY |
| Total Rows | state | The tuple (row) state | STRING | dead, live |
| WAL File Lag | operation | The operation which is responsible for the lag | STRING | flush, replay, write |
| WAL File Lag | replication_client | The IP address of the client connected to this backend. If this field is "unix", it indicates either that the client is connected via a Unix socket | STRING | ANY |
| Database Locks | relation | OID of the relation targeted by the lock, or null if the target is not a relation or part of a relation | STRING | ANY |
| Database Locks | mode | Name of the lock mode held or desired by the process | STRING | ANY |
| Database Locks | lock_type | Type of the lockable object | STRING | ANY |
| WAL Delay | operation | The operation which is responsible for the lag | STRING | flush, replay, write |
| WAL Delay | replication_client | The IP address of the client connected to this backend. If this field is "unix", it indicates either that the client is connected via a Unix socket | STRING | ANY |
Resource Attributes
These attributes will be enabled by default:
| Attribute | Description | Value Type |
|---|---|---|
| postgresql.database.name | The name of the database | STRING |
| postgresql.index.name | The name of the index on a table | STRING |
| postgresql.table.name | The schema name followed by the table name | STRING |
These are the currently supported metrics at the time the article is written. Check the OpenTelemetry Collector Contrib repo for any updates.
Conclusion
In this tutorial, you installed an OpenTelemetry Collector to collect PostgreSQL metrics and sent the collected data to SigNoz for monitoring and alerts.
Visit our complete guide on OpenTelemetry Collector to learn more about it. OpenTelemetry is quietly becoming the world standard for open-source observability, and by using it, you can have advantages like a single standard for all telemetry signals, no vendor lock-in, etc.
SigNoz is an open-source OpenTelemetry-native APM that can be used as a single backend for all your observability needs.
Further Reading
Complete Guide on OpenTelemetry Collector
