Kibana vs. Grafana - A Scenario-Based Decision Guide [2026]
Both Kibana and Grafana are data visualization tools providing users capabilities to explore, analyze and visualize data with dashboards. The difference between Kibana and Grafana lies in their genesis. Kibana was built on top of the Elasticsearch stack, famous for log analysis and management. In comparison, Grafana was created mainly for metrics monitoring supporting visualization for time-series databases.
While Kibana is proficeint in visualizing log data from Elasticsearch, Grafana is more of a general-purpose data visualization tool with a special focus on metrics visualization.
Kibana vs Grafana: Scenario based Decision Guide
Which tool to use for the following scenarios:
- Kibana for Log and Event Data Analysis
- Grafana for Metrics Visualization
- Kibana for Elasticsearch Data Visualization
- Grafana for Alerting and Notifications
- Grafana for Custom Dashboards
- Kibana for Application Performance Monitoring (APM)
- Kibana for Security Information and Event Management (SIEM)
- Grafana for Multi-Source Data Aggregation
- Grafana for Network Performance Monitoring
Let's dive deeper into how you should choose between Kibana and Grafana. But before that, let’s have a look at the tools and their key features.
What is Kibana?
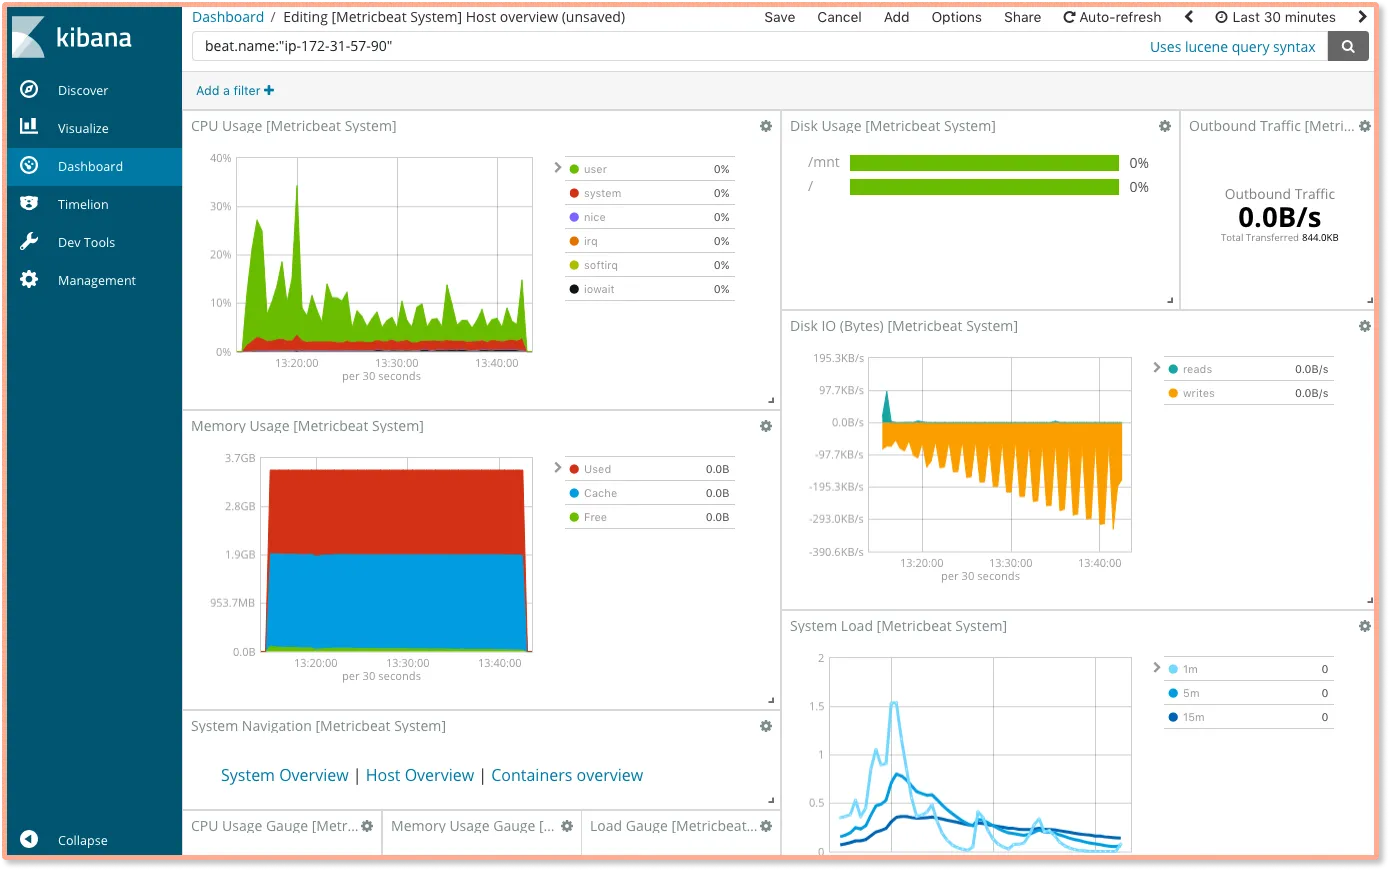
Kibana is the ‘K’ in the popular ELK stack. It is built on top of the popular Elasticsearch stack to explore, visualize, and analyze the log data collected by Logstash and stored by Elasticsearch. Kibana was created in 2013, and since then, it has come to become the frontend for the log management stack provided by Elastic. Kibana provides search and data visualization functionalities on data stored and indexed in Elasticsearch. Though initially built for supporting logs visualization, Kibana now provides charting capabilities for all types of data stored in Elasticsearch. Kibana provides different types of search and query functionalities to perform searches on data indexed in Elasticsearch. Some of the common search methods provided by Kibana include:
KQL
KQL stands for Kibana Query Language. It supports free text search and field-based searches.Boolean Queries
It supports boolean searches withand,or, andnot. For example, to match documents with response200or extensionphp, you can write:response:200 or extension:php
For visualization, Kibana offers most of the common chart types such as bar, area, pie, histogram, and heatmaps.

Key features of Kibana
- Visualization
Kibana provides a lot of ways to visualize data easily. Some of the visualizations that are commonly used are vertical bar charts, horizontal bar charts, pie charts, line graphs, heat maps, etc. - Search and Query capabilities
Kibana enables its users to perform searches on data indexed in Elasticsearch with intuitive free text and field-based searches. Kibana uses KQL as its default query language to let users perform searches. - Analysis and data exploration
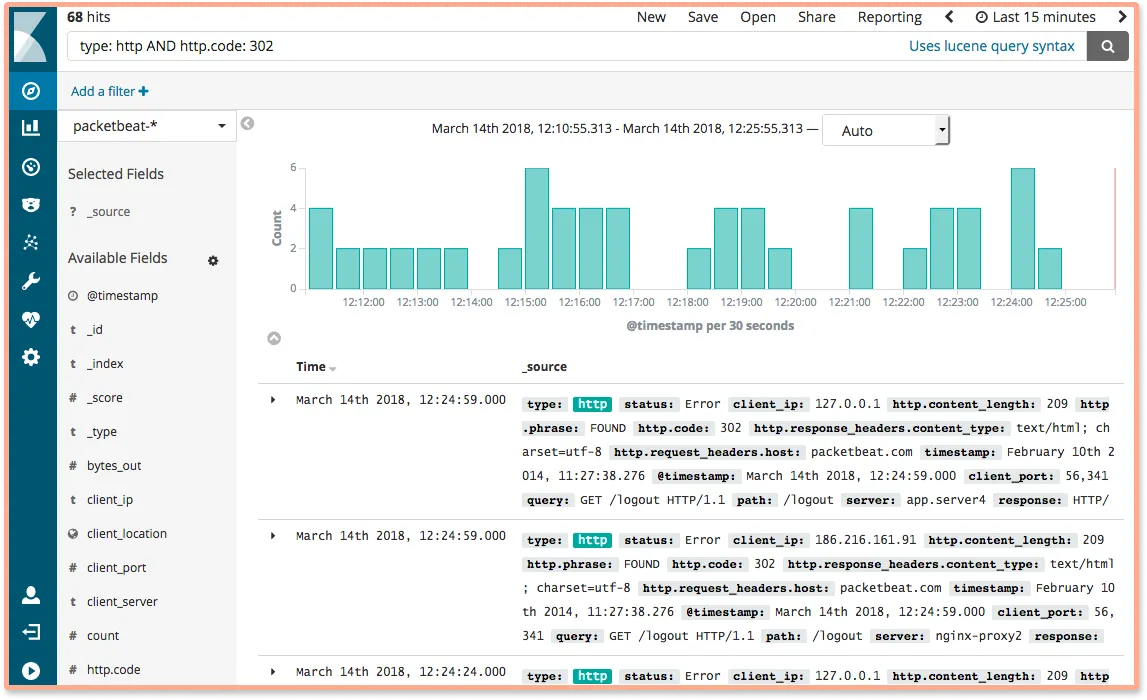
Kibana provides a tab calledDiscoverto let users explore and analyze data. It is useful for doing ad-hoc analysis on your data when you want specific answers. You can quickly create views from the data, and if you wish, you can also create dashboards. - Dashboards
When we have the visualizations ready, all of them can be placed on one board – the Dashboard. Observing different data views together can give you a clear overall idea about what exactly is happening. - Plugins
Kibana also has a lot of plugins available to add new visualization or UI addition from its community-driven plugin modules. For example, there are plugins available for 3D charts and 3D graphs.
What is Grafana?
Grafana is a popular open-source analytics and visualization tool. It was created by Torkel Ödegaard in the year 2014 and is focused on visualizing metrics from time-series databases such as InfluxDB, OpenTSDB, and Prometheus.
Grafana is backed by Grafana Labs, the parent company behind the open-source Grafana.
Grafana lets end-users make complex monitoring dashboards by combining multiple data sources. A brief workflow for creating a dashboard in Grafana involves the following steps:
- Install Grafana
Grafana can be installed on many different operating systems. - Add a data source
Grafana gives you a dropdown for common data sources like Prometheus, Graphite, InfluxDB, etc. - Create dashboards
After configuring your data source; you can use the explore view of Grafana and build queries to monitor the metrics you want to track.

Key features of Grafana
Some of the key features of Grafana include:
- Visualization Panels
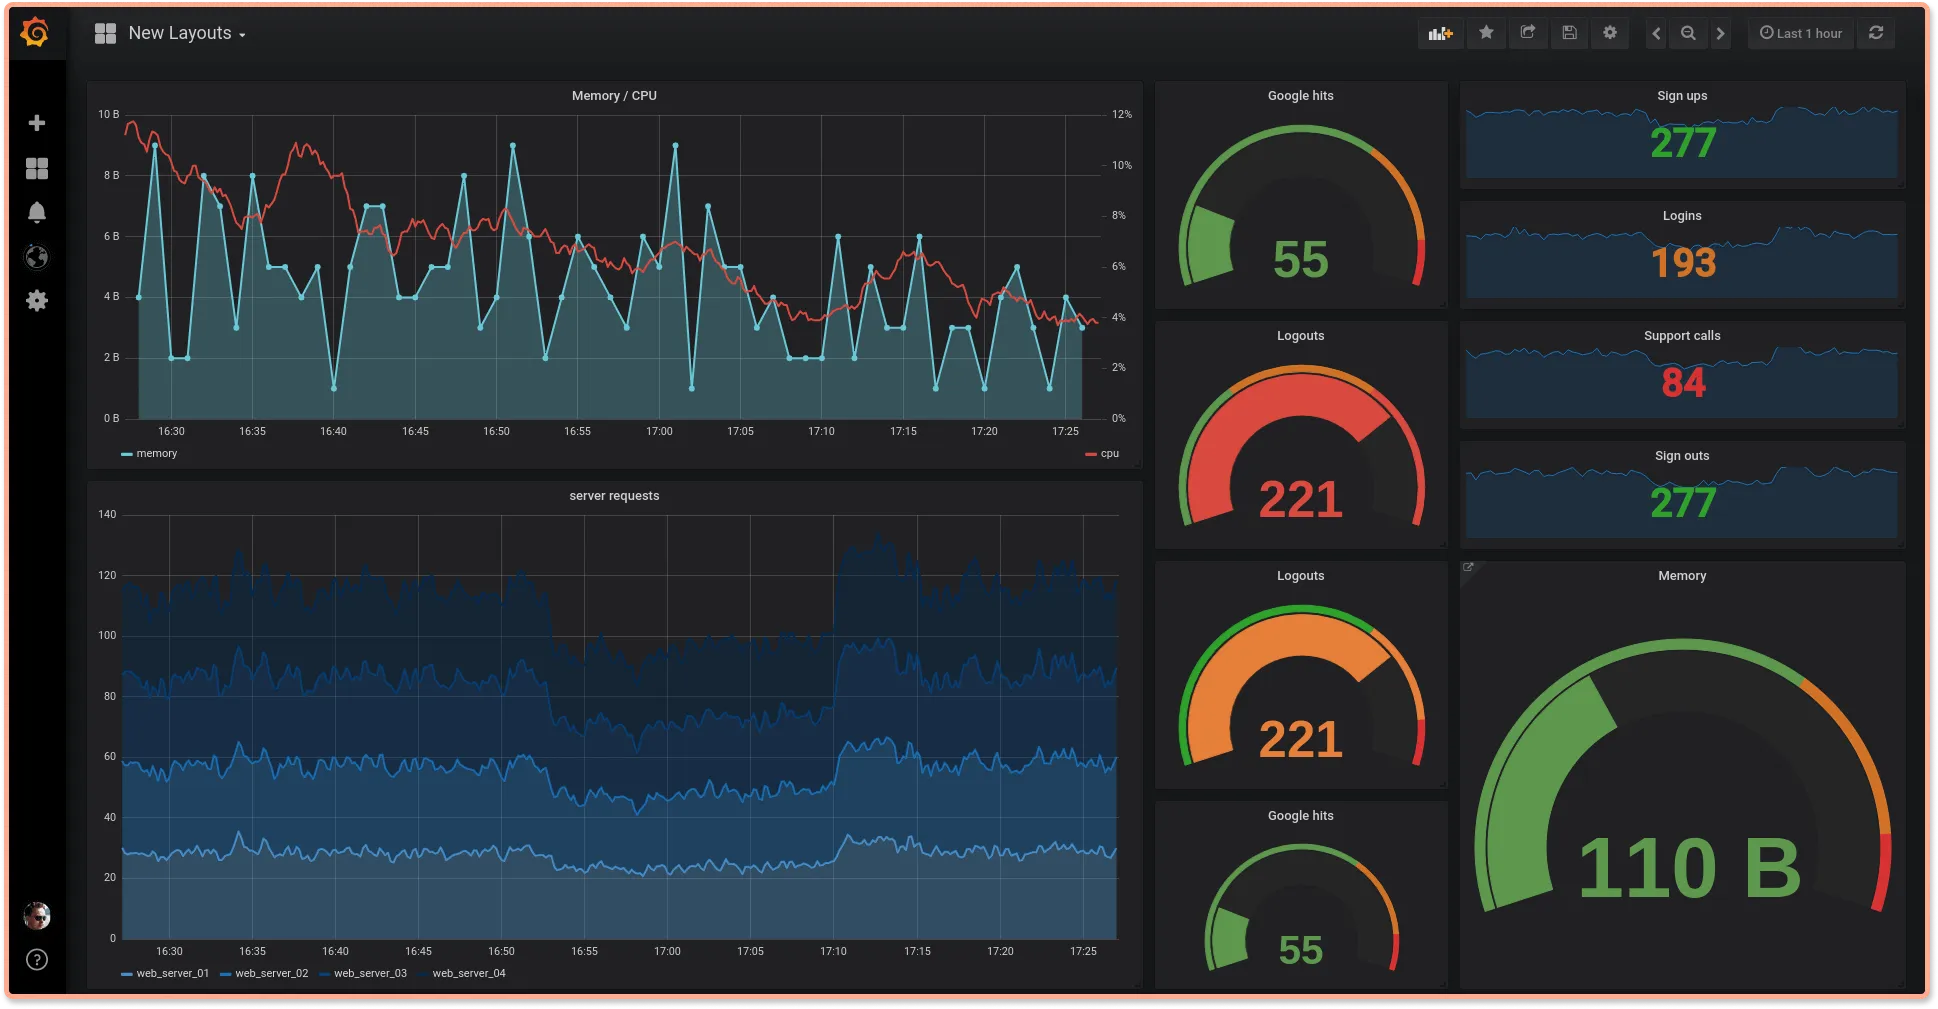
Grafana has a wide range of visualization options like time series, bar charts, heat maps, histograms, graphs, geo-maps, and more that can help users visualize data effectively. - Data Sources
Grafana supports an extensive list of storage backends for time-series data. It also provides a customized query editor for each data source so that the capabilities of each data source can be fully utilized. - Unifying Data Sources
In Grafana, you can build dashboards combining multiple data sources. Dashboards contain multiple panels, with each panel corresponding to a specific data source. - Dashboard Collaboration
Grafana allows users to share dashboard within their organization and also create public dashboards in some cases. It also provides role-based access control features for effective team collaboration. - Alert Manager
Grafana provides an alerting UI that users can use to set and manage alerts on metrics. It also includes in-built support for Prometheus alert manager. Grafana sends alerts through several different notifiers, including email, PagerDuty, Slack, texts, and more.
Comparing Grafana and Kibana
Differences between Grafana and Kibana at a glance:
| Category | Grafana | Kibana |
|---|---|---|
| Data Sources | Supports various data sources | Supports only Elasticsearch from the ELK stack. |
| Alerts | Built-in alert engine | Uses Watchers for alerts |
| Query | Provides a query editor which supports multiple data sources | Uses Kibana Query Language |
| Architecture | Uses DB like Prometheus as data store | Uses Elasticsearch as data store |
| Parent Company | Grafana Labs | Elastic |
| License | Open-source is under Apache 2.0 | Elastic License and Server Side Public License (SSPL) |
Data sources
Grafana supports multiple data sources like Prometheus, InfluxDB, OpenTSDB, etc. It also supports Elasticsearch as a data source. Focused on visualizing metrics from time-series databases, Grafana officially supports multiple data sources. Here are a few of the popular ones:
- AWS Cloudwatch
- Azure Monitor
- Elasticsearch
- Google Cloud Monitoring
- Graphite
- InfluxDB
- Loki
- MySQL
- Prometheus
- InfluxDB
- Jaeger
- Tempo
On the other hand, Kibana only supports Elasticsearch as a data source.
Dashboard and Visualization
Both Kibana and Grafana offer a great set of visualization capabilities.
Grafana supports graph, single stat, table, heatmap, free text panel types, etc., which can be configured with a variety of data types. Grafana is built for cross-platform visualizations and can integrate data from multiple sources to create dashboards. Each panel in a Grafana dashboard corresponds to a specific data source, but multiple panels with different data sources can be combined to create a rich dashboard.
Kibana offers a wide variety of visualization types, allowing you to create pie charts, line charts, data tables, single metric visualizations, geo maps, etc. Apart from the basics, Kibana also provides visualizations for the following analyses:
- Location analysis
- Time series analysis
- Machine learning
Kibana’s discover feature let users explore and analyze data quickly.
Alerts
Grafana comes with Grafana alerting UI to create and manage alerts. Using alert rules in the Grafana dashboard, you can set evaluation criteria that determine whether an alert should be fired or not. It also provides features to organize your alert rules with role-based access controls.
Kibana does not directly handle alerts. They are configured in Elasticsearch using data watchers. Watcher is an Elasticsearch feature that allows you to build actions based on conditions that are assessed on a regular basis using data queries and take action based on the results. At the moment, the API is the only way to set up watches.
Query
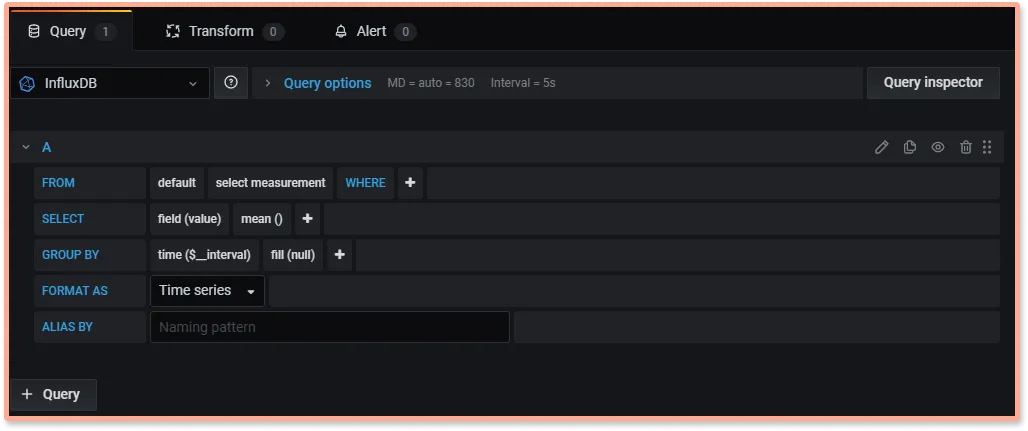
Grafana provides a query editor for writing queries. With the help of queries, Grafana panels interact with the underlying data source. The syntax of the query depends on the connected data source. For example, in the picture below, the connected data source is InfluxDB, and the query syntax will be based on what the data source provides.
Each data source has its own query language.

Kibana in turn uses the Elasticsearch Query Language for making queries.

Setup and Deployment
Installation Process
Kibana:
- Typically installed as part of the Elastic Stack
- Requires Elasticsearch to be set up and configured
- Can be complex for users new to the Elastic ecosystem
Grafana:
- Standalone installation available for various platforms
- Simpler setup process, especially for small-scale deployments
- Can be easily containerized using Docker
Configuration Options
Both tools offer extensive configuration options:
Kibana:
- Configuration tightly coupled with Elasticsearch settings
- Offers fine-grained control over index patterns and field mappings
Grafana:
- Highly customizable through configuration files or environment variables
- Easier to set up multi-tenancy and user organizations
Scalability Considerations
Kibana:
- Scales well with Elasticsearch cluster for large log volumes
- Performance can be impacted by complex queries on large datasets
Grafana:
- Handles large numbers of concurrent users efficiently
- Performance depends on the underlying data sources and query complexity
Use Cases: When to Choose Kibana or Grafana
Log Analysis and Management
Kibana excels in:
- Full-text search across logs
- Real-time log tailing and filtering
- Creating visualizations based on log patterns and trends
Example use case: A DevOps team uses Kibana to troubleshoot application errors by searching and analyzing log entries across multiple services.
Metrics Monitoring
Grafana shines in:
- Visualizing time-series metrics from multiple sources
- Creating comprehensive dashboards for system and application performance
- Setting up alerts based on metric thresholds
Example use case: An SRE team uses Grafana to monitor CPU, memory, and network usage across a Kubernetes cluster, with alerts for resource constraints.
Security and Compliance
Kibana offers:
- SIEM (Security Information and Event Management) capabilities
- Threat detection and visualization of security events
- Compliance reporting based on log data
Example use case: A security team uses Kibana to detect and investigate potential security breaches by analyzing authentication logs and network traffic patterns.
IoT and Real-time Data
Grafana excels in:
- Handling streaming data from IoT devices
- Creating real-time dashboards for sensor data
- Visualizing geospatial data from distributed sensors
Example use case: A smart city project uses Grafana to monitor and visualize real-time data from traffic sensors, air quality monitors, and energy consumption meters.
Performance and Scalability
Query Performance
Kibana:
- Optimized for Elasticsearch queries
- Can handle large volumes of log data efficiently
- Performance may degrade with complex full-text searches on large datasets
Grafana:
- Query performance depends on the underlying data source
- Efficiently handles time-series data from databases like Prometheus or InfluxDB
- May face challenges with large-scale relational database queries
Resource Requirements
Kibana:
- Typically requires more resources due to its integration with Elasticsearch
- Memory usage can be high when dealing with large log volumes
Grafana:
- Generally has lower resource requirements
- Can run efficiently on smaller instances or containers
Caching Mechanisms
Kibana:
- Relies on Elasticsearch caching for query optimization
- Offers dashboard caching to improve performance for frequently accessed visualizations
Grafana:
- Provides built-in caching mechanisms for data sources
- Allows fine-tuning of cache durations for individual panels
Clustering and High Availability
Kibana:
- Can be set up in a clustered configuration with Elasticsearch
- Requires additional components like load balancers for high availability
Grafana:
- Supports horizontal scaling through stateless deployments
- Offers enterprise features for high availability and load balancing
Community and Ecosystem
Open-source vs. Commercial Offerings
Kibana:
- Open-source core with X-Pack for additional features
- Elastic offers paid subscriptions for advanced features and support
Grafana:
- Open-source core with Grafana Enterprise for additional features
- Grafana Labs provides cloud-hosted and enterprise on-premise solutions
Plugin Ecosystems
Kibana:
- Offers a range of official plugins for additional visualizations and integrations
- Limited third-party plugin ecosystem compared to Grafana
Grafana:
- Extensive plugin ecosystem with both official and community-contributed plugins
- Easy to extend functionality through custom panels and data source plugins
Community Support
Kibana:
- Active community forums and documentation
- Support primarily focused on Elastic Stack integration
Grafana:
- Large and active community with extensive documentation
- Broader range of community resources due to its multi-data source nature
Release Cycles and Long-term Support
Kibana:
- Follows Elastic Stack release cycle
- Offers long-term support (LTS) versions for enterprise users
Grafana:
- Regular release cycle with frequent updates
- Provides LTS versions for stability in production environments
Security and Access Control
Authentication Methods
Kibana:
- Integrates with Elastic Stack security features
- Supports basic authentication, LDAP, and SAML
Grafana:
- Offers various authentication options including:
- Built-in user management
- LDAP/Active Directory
- OAuth (Google, GitHub, etc.)
- SAML
Role-based Access Control
Kibana:
- Provides fine-grained access control through Elasticsearch security features
- Allows control over index-level and field-level security
Grafana:
- Offers role-based access control for dashboards and data sources
- Supports team-based permissions and folder-level access control
Data Encryption
Kibana:
- Relies on Elasticsearch for data encryption at rest
- Supports SSL/TLS for data in transit
Grafana:
- Provides encryption for sensitive data stored in its database
- Supports SSL/TLS for secure communications
Audit Logging
Kibana:
- Offers comprehensive audit logging through Elasticsearch
- Tracks user actions, searches, and system changes
Grafana:
- Provides audit logs for user actions and system changes
- Offers more detailed audit logging in Enterprise version
Which is better Kibana or Grafana?
Both Kibana and Grafana have rich capabilities when it comes to data visualization. Depending on your use case, you can select one over the other. If your data source is Elasticsearch, it makes sense to choose Kibana over Grafana. Grafana does provide integrations to add Elasticsearch as a database, but Kibana was built specifically for the Elastsearch stack.
On the other hand, if you want to visualize metrics from a time-series database, Grafana provides a better user experience.
Both Kibana and Grafana have expanded beyond the scope of their initial offerings, and they now provide support for different types of data. For example, Grafana now supports log visualization collected by Loki - a log aggregation tool by Grafana Labs. Likewise, Kibana also supports metrics and tracing visualization.
A Better Alternative to Kibana & Grafana - SigNoz
Modern observability trends show that for effective monitoring of application, all your telemetry signals should be under a single pane of glass. Both Grafana Labs and Elastic, the companies behind Grafana OSS and Kibana offer observability solutions by stitching together multiple tools. For observability, these three signals are considered important:
- Logs
- Metrics
- Traces
The above three signals are popularly known as the three pillars of observability. The easier a tool makes it to get started with these three signals, the better. Grafana Labs provide multiple solutions to collect and monitor logs, metrics, and traces. You need to stitch together the following three tools for a full-stack observability solution:
- Loki for logs
- Prometheus - Grafana combo for metrics
- Tempo for traces
Elastic, on the other hand, provides Elastic APM, its observability solution meant for cloud-native applications. But the Elastic stack is mainly known for its log analytics solution.
SigNoz is a full-stack open-source observability tool that provides logs, metrics, and traces under a single pane of glass. It can serve as your one-stop solution for all observability needs. Even for log analytics, SigNoz can be a better choice when compared to Elasticsearch and Loki by Grafana. We found SigNoz to be 2.5x more efficient in ingestion when compared to ELK stack. Loki doesn’t perform well if you want to index and query high cardinality data.
SigNoz comes with out-of-box application metrics charts.

Using Flamegraphs and Gantt charts, you can see a complete breakdown of user request.

Getting started with SigNoz
SigNoz Cloud is the easiest way to run SigNoz. Sign up for a free account and get 30 days of unlimited access to all features.
You can also install and self-host SigNoz yourself since it is open-source. With 24,000+ GitHub stars, open-source SigNoz is loved by developers. Find the instructions to self-host SigNoz.
Key Takeaways
- Kibana specializes in log analysis within the Elastic Stack ecosystem, offering powerful search and visualization capabilities for log data.
- Grafana provides broader data source support and excels in metrics visualization, making it ideal for diverse monitoring needs.
- Both tools offer strong visualization capabilities but differ in query languages, setup processes, and primary use cases.
- Consider your project requirements, existing infrastructure, and team skills when choosing between Kibana and Grafana.
- SigNoz offers an alternative solution with integrated tracing, metrics, and logs, providing a comprehensive observability platform.
FAQs
Is Kibana open-source?
No, Kibana is not open-source. Elastic, the company behind Kibana, now calls it open code, having shifted Kibana from the popular open-source license Apache 2.0 to a dual license scheme - Elastic License and Server Side Public License (SSPL). Under this license, cloud service providers can not provide Elasticsearch and Kibana as a service. You can read more about this license here.
Is Kibana free?
Kibana is free to use under the Elastic license or SSPL with certain features.
What is the main difference between Kibana and Grafana?
While Kibana was built on top of the Elasticsearch stack, famous for log analysis and management, Grafana was created mainly for metrics monitoring, supporting visualization for time-series databases.
Is Grafana a fork of Kibana?
Yes, Grafana started out as a fork of Kibana to expand its visualization capabilities for time-series databases.
Can Kibana work with data sources other than Elasticsearch?
While Kibana is optimized for Elasticsearch, it can work with other data sources through Elasticsearch's ingest nodes or by using Logstash to transform and index data from various sources into Elasticsearch.
Is Grafana suitable for log analysis?
Grafana supports log analysis through its Loki integration and log panel features. However, it may not offer the same depth of log exploration and full-text search capabilities as Kibana, which is specifically designed for log analysis.
How do the pricing models of Kibana and Grafana compare?
Both Kibana and Grafana offer open-source versions with core functionality. Kibana's advanced features are available through Elastic's paid subscriptions, while Grafana provides additional capabilities through Grafana Enterprise and Grafana Cloud offerings. Pricing structures vary, so it's best to check their respective websites for current details.
Can SigNoz replace both Kibana and Grafana in a monitoring setup?
SigNoz can potentially replace both Kibana and Grafana for many use cases, as it provides integrated tracing, metrics, and log management capabilities. However, the suitability depends on your specific requirements and existing infrastructure. SigNoz offers a comprehensive observability solution that may simplify your monitoring stack.
Further Reading
