DataDog vs Cloudwatch - Which tool to choose?
DataDog is a paid SaaS tool that provides a range of products for monitoring applications and tech infrastructure. While CloudWatch is an Amazon Web Services product that monitors applications running on AWS infrastructure, or using AWS services.

Datadog vs Cloudwatch: Use-Case Based Decision Guide
CloudWatch is AWS-native and deeply integrated but AWS-only, while Datadog is a third-party platform that monitors AWS alongside other clouds and services. The choice often comes down to whether you are all-in on AWS or running a broader, multi-cloud estate.
Which tool to use for the following use-cases:
- Cloudwatch for Basic cloud monitoring and management in AWS
- Datadog for Advanced analytics and log management
- Datadog for Multi-cloud and hybrid cloud environments
- Datadog for Real-time application performance monitoring (APM)
- Cloudwatch for Cost management for AWS services
- Datadog for Third-party integrations
Before we take a deep dive into key differences between each tool, let's have a brief overview of each tool.
What is CloudWatch?
CloudWatch is an Amazon Web Services product that enables users to track, collect and analyze their performance and operational application data running on AWS services.
You can use CloudWatch to collect and store logs, monitor application and infrastructure metrics. It also provides unified dashboards, alarm systems, and logs & metrics correlation for actionable insights.
What is DataDog?
DataDog is a propriety SaaS tool that provides a range of products for application performance monitoring. Once you have signed up for a DataDog account, you can install DataDog agents to start sending performance data (logs, metrics, and traces) to DataDog Cloud for storage and analysis.
DataDog offers a range of products like log management, infrastructure monitoring, APM, and security monitoring which are available based on the pricing plan you choose.
DataDog vs CloudWatch - Key Differences
Both DataDog and CloudWatch are monitoring tools that help improve application and system performance. But CloudWatch only monitors AWS resources and the applications that run on them. On the other hand, using DataDog, you can monitor applications using multiple cloud services.
Differences between DataDog and CloudWatch can be summarized below:
-
Multi-Cloud support
DataDog supports multi-cloud monitoring like AWS, Azure, and Google cloud services. CloudWatch is used to monitor AWS resources and applications that run on it. -
Getting started
If you are using AWS services, then CloudWatch already offers a default console to monitor the services you use in your AWS account.For using DataDog, you first need to sign up for a DataDog account. Once you sign up, you can install DataDog agents on your hosts. The DataDog agent reports metrics and events from your host to DataDog.
-
Feature set
DataDog is an enterprise-level monitoring tool that offers a gamut of products to take care of monitoring use-cases. As such, it has some features that are not available in CloudWatch. For example, continuous code profiler. DataDog provides Continuous Code Profiling to identify code snippets and methods inefficient under production load.
-
Pricing
Both DataDog and CloudWatch are paid tools.CloudWatch pricing details:
CloudWatch provides a free tier that you can explore. CloudWatch's paid tier called EC2 detailed monitoring starts at $2.10 per instance per month(assuming 7 metrics per instance). The cost also depends on the number of metrics sent and is divided into multiple tiers. The first 10k metrics are charged at $0.30 per metric per month.DataDog pricing details:
DataDog is an expensive enterprise monitoring tool with many different pricing tiers that vary on your use cases. For example, infrastructure enterprise monitoring starts at $23 per host per month while its APM and continuous profiler starts at $40 per host per month.
For additional context on how these tools compare across the broader ecosystem, Datadog vs Dynatrace and Datadog vs New Relic put Datadog head-to-head with other enterprise monitoring platforms, while CloudWatch vs CloudTrail unpacks the native AWS monitoring pair.
Key Features of DataDog
DataDog is an enterprise SaaS tool that offers an array of services in the monitoring domain. Some of the key features of the DataDog monitoring platform includes:
-
Log Management
DataDog offers scalable log ingestion and analytics through its log management product. You can search, filter, and analyze log data through its dashboard. You can route all your logs from one central control panel. -
Application performance monitoring
DataDog's APM tool provides end-to-end distributed tracing from frontend devices to databases. You can connect the collected traces to infrastructure metrics, network calls, and live processes. -
Security monitoring
Using DataDog security monitoring, you can analyze operational and security logs in real-time. It provides built-in threshold and anomaly detection rules to detect threats quickly. -
Network monitoring
With DataDog network monitoring, you can analyze traffic as it flows across applications, containers, availability zones, and on-premise servers. You can track key network metrics like TCP retransmits, latency, and connection churn. -
Real user monitoring
With DataDog's real user Monitoring, you can have end-to-end visibility into user journeys for web and mobile applications.
DataDog is a great tool if you need a little bit of everything in one tool. The challenge with such a tool is that you get locked in with a particular vendor and it's usually too resource-intensive to shift to any other platform. DataDog is an expensive tool with node-based pricing which is not suited to modern-day microservices architecture.
Key Features of CloudWatch
CloudWatch is a monitoring tool provided by Amazon Web Services. It provides monitoring for applications running on the AWS infrastructure.
Some of the key features of CloudWatch includes:
-
Easy collection of logs and metrics
Using CloudWatch, you can collect logs and metrics from your application, infrastructure, and services. Some of the types of logs that can be collected:- Logs published by AWS services Currently, over 30 AWS services publish logs to CloudWatch
- Custom logs Using a CloudWatch agent, you can push logs from your own application and on-premises resources.
CloudWatch allows you to collect default metrics from more than 70 AWS services such as Amazon EC2, Amazon DynamoDB, Amazon S3, Amazon ECS, AWS Lambda, etc.
-
Unified visualization and composite alarms
Amazon CloudWatch provides dashboards that unify data from multiple sources for actionable insights. Some of the key visualization features include:- Graph metrics and log data side by side
- Graphs for cloud resources and applications in a unified view
-
Logs and metrics correlation
Using CloudWatch, you can correlate log patterns to a specific metric and set alarms on it. -
Container monitoring, lambda monitoring, and anomaly detection
CloudWatch provides automatic dashboards for container and lambda insights. Using anomaly detection, you can create alarms to auto-adjust thresholds based on metrics patterns.
The challenge with CloudWatch is that you can only monitor AWS services with it. So if your entire application architecture and infrastructure is using AWS services, then it is a great tool for monitoring. But in today's distributed systems, that is not the case. You might be using multiple cloud vendors and third-party services.
So you need a tool that is platform-independent. You also need a universal way of generating telemetry data(logs, metrics, and traces). A single set of rules and standards to generate and collect telemetry data is the first step in creating a robust monitoring framework.
And that's where SigNoz comes into the picture - an open-source APM tool.
If you are only using AWS services, then you can go with CloudWatch, but if you are using multiple cloud vendors and third-party services, DataDog might be a better option.
Cut Your Observability Spend by 80%—Here's How
Switch from Datadog seamlessly with our automated migration tool, comparable features and up to 80% cost savings.
An alternative to DataDog and CloudWatch - SigNoz
SigNoz is a full-stack open-source application performance monitoring and observability tool which can be used in place of DataDog and Grafana. It can act as your one-stop observability solution. You can monitor logs, metrics, and traces and correlate signals for better insights into application performance.
With SigNoz, you can do the following:
- Visualise Traces, Metrics, and Logs in a single pane of glass
- Monitor application metrics like p99 latency, error rates for your services, external API calls, and individual endpoints.
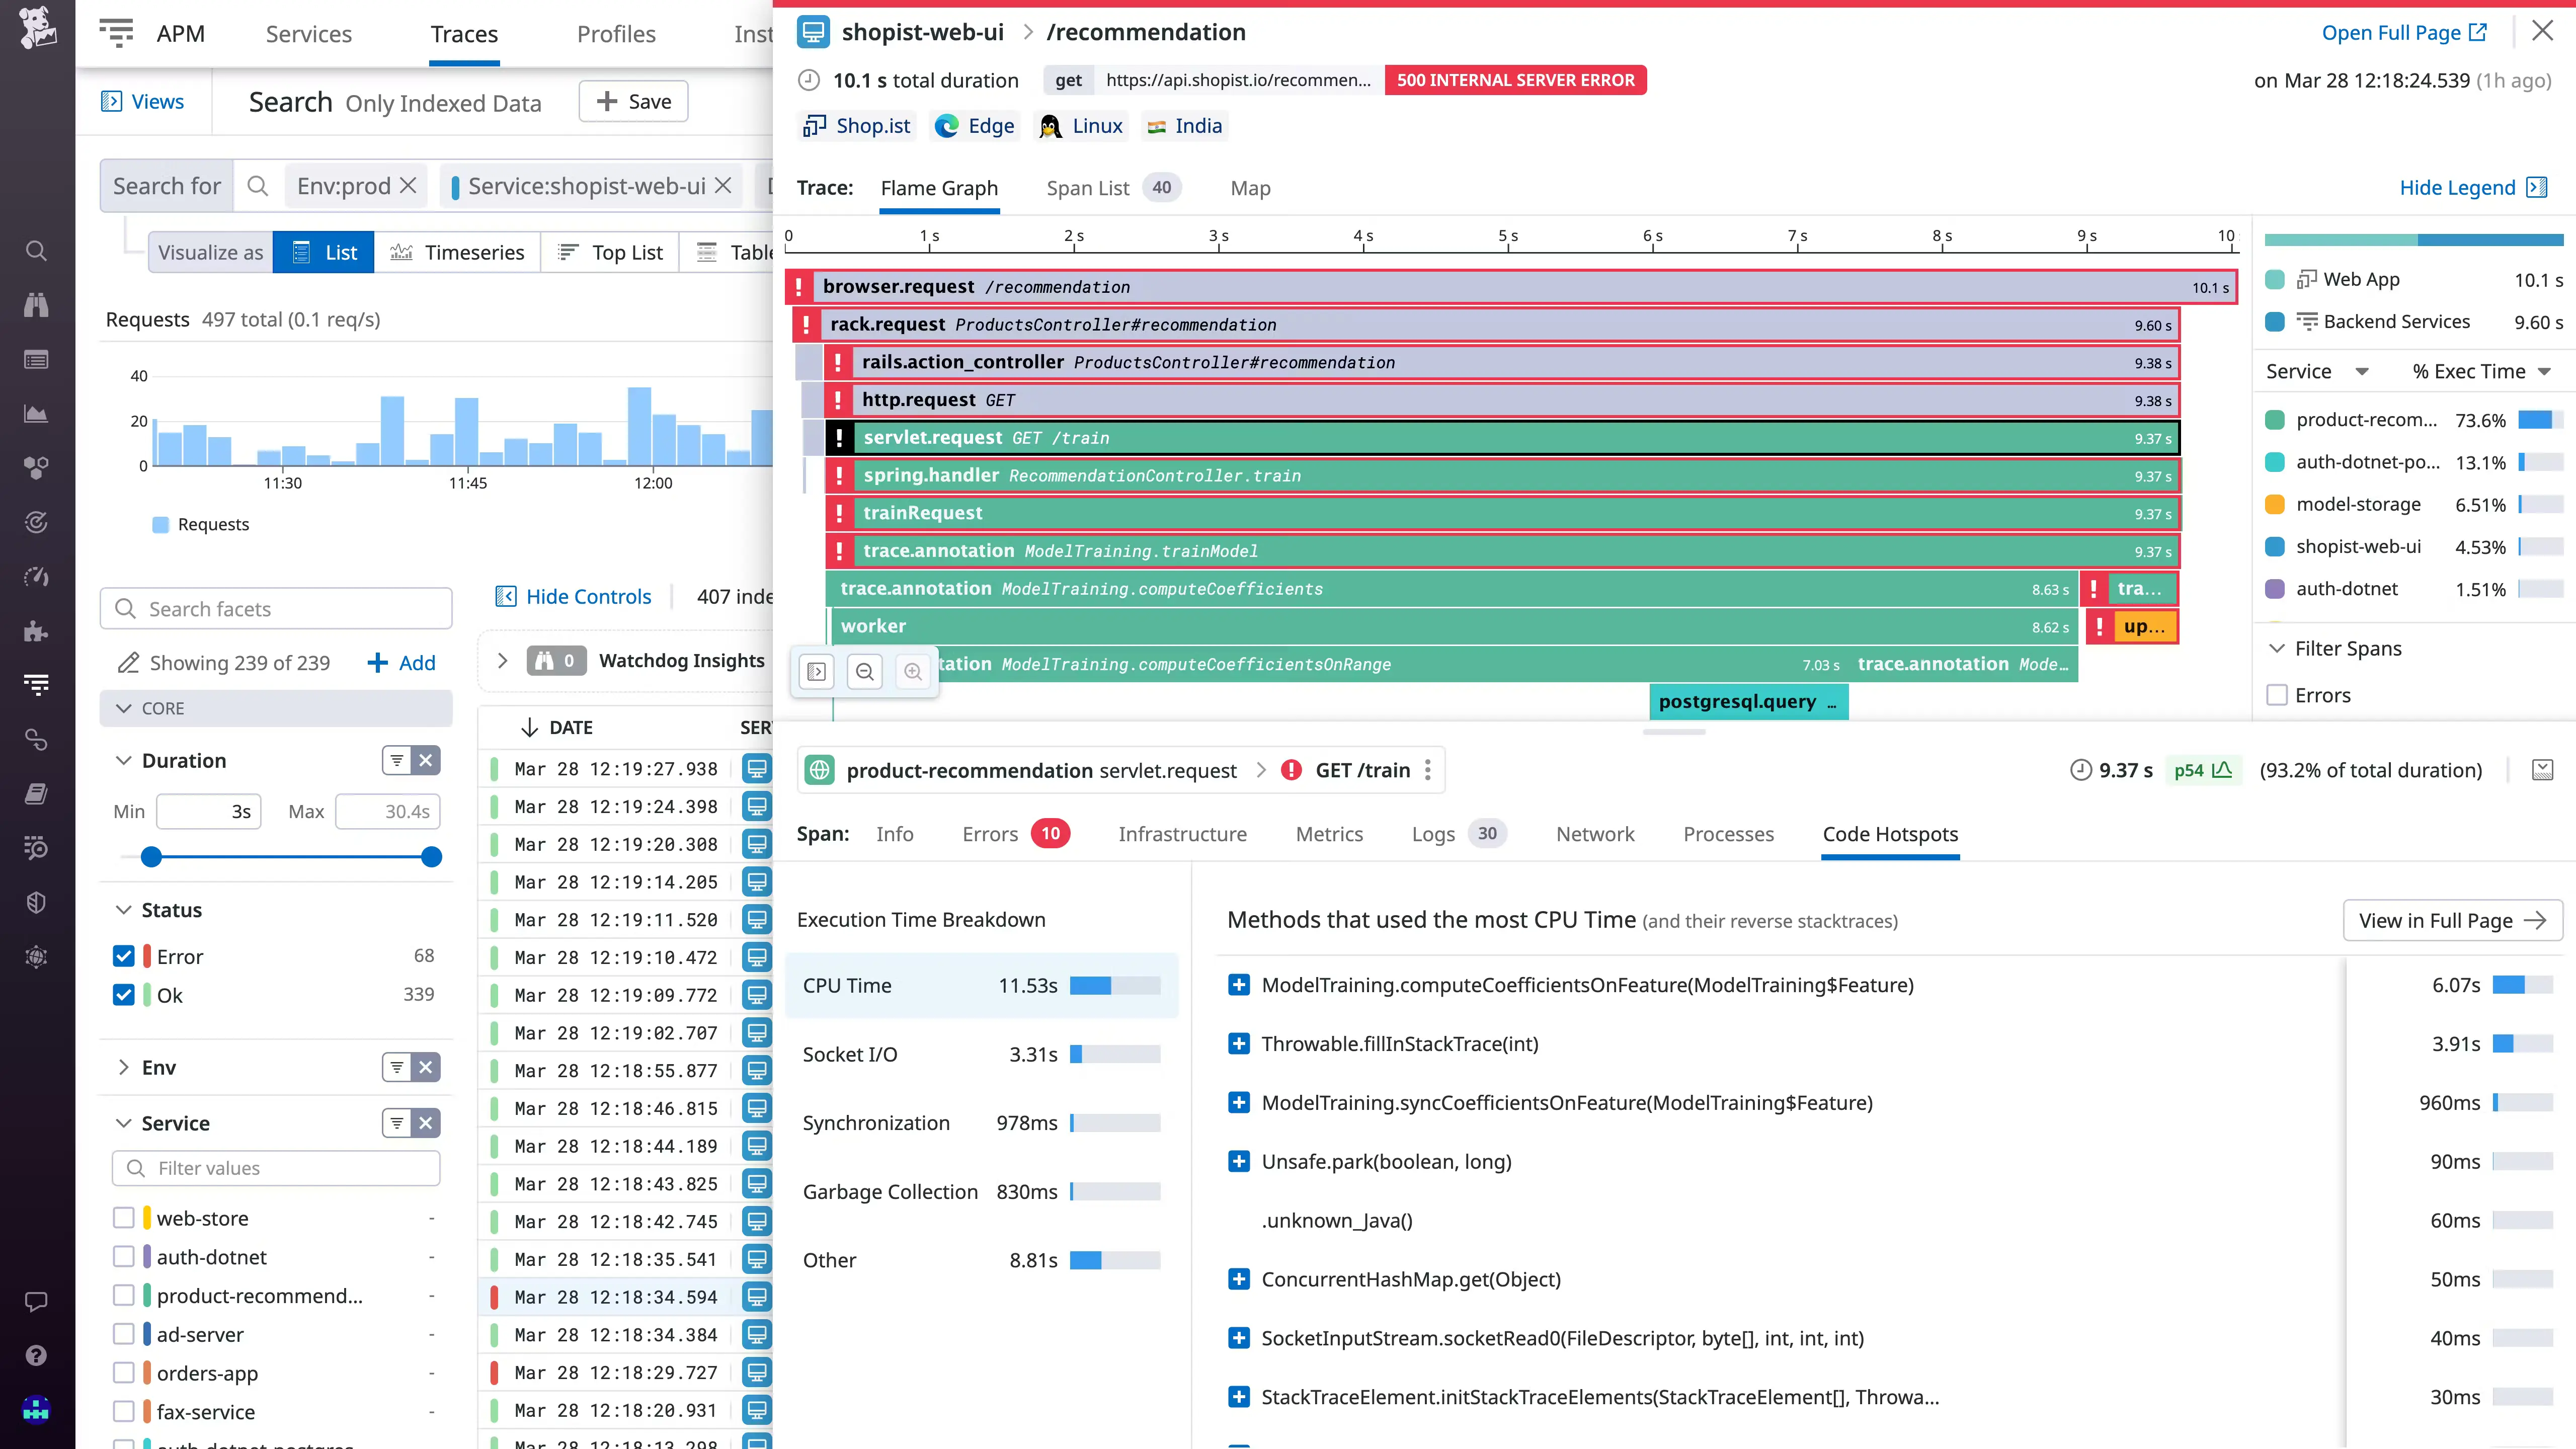
- Find the root cause of the problem by going to the exact traces which are causing the problem and see detailed flamegraphs of individual request traces.
- Run aggregates on trace data to get business-relevant metrics
- Filter and query logs, build dashboards and alerts based on attributes in logs
- Monitor infrastructure metrics such as CPU utilization or memory usage
- Record exceptions automatically in Python, Java, Ruby, and Javascript
- Easy to set alerts with DIY query builder
SigNoz comes with out of box visualization of things like RED metrics.

SigNoz UI showing application overview metrics like RPS, 50th/90th/99th Percentile latencies, and Error Rate
You can also use flamegraphs to visualize spans from your trace data. All of this comes out of the box with SigNoz.

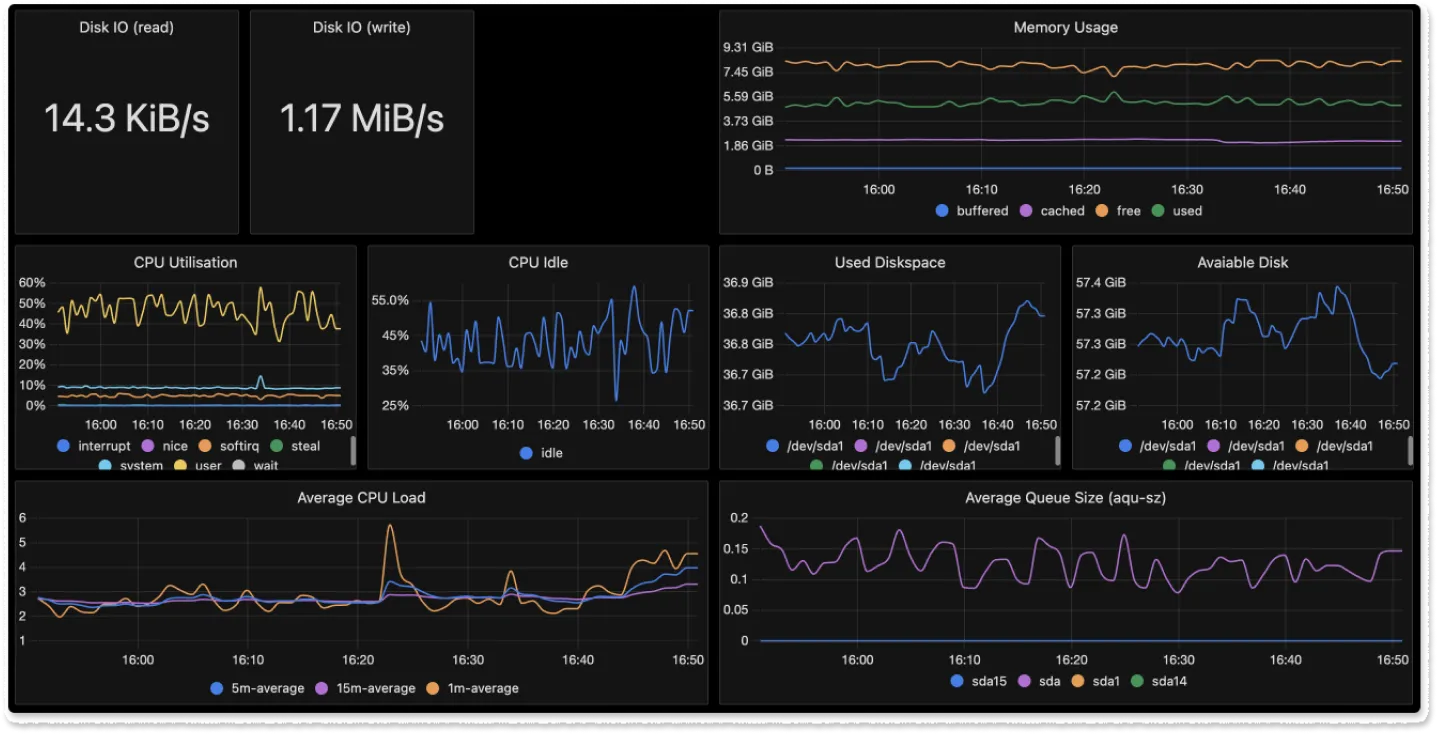
You can also build custom metrics dashboard for your infrastructure.
If you're still evaluating your options, the Datadog alternatives guide covers the wider landscape. CloudWatch vs Azure Monitor is useful if you're running on multiple cloud providers, and Datadog vs Splunk covers another common enterprise alternative.
Getting started with SigNoz
SigNoz Cloud is the easiest way to run SigNoz. Sign up for a free account and get 30 days of unlimited access to all features.

You can also install and self-host SigNoz yourself since it is open-source. With 24,000+ GitHub stars, open-source SigNoz is loved by developers. Find the instructions to self-host SigNoz.
Related Content
