Top 9 Datadog Alternatives and Competitors in 2026
The rising costs and complexities of monitoring cloud infrastructure are pushing many organizations to explore alternatives to Datadog. If you're making that move, you need simpler billing without losing the ability to investigate an issue across logs, metrics, and traces. SigNoz Cloud brings these signals together in one OpenTelemetry-native product with usage-based pricing. In this article, we'll look at nine Datadog alternatives and what each offers for your monitoring needs.
Simple usage-based pricing — no per-host fees, no custom metrics surcharge. Start with SigNoz Cloud, self-host anytime with the same open-source codebase.
Get Started - FreeWhy Organizations Look for Datadog Alternatives
In one of the earning calls of Datadog, it was revealed that they charged a cryptocurrency company a bill of $65 million USD. A Hacker News thread discussing the report went viral, and there was an outpouring of user stories around Datadog's unpredictable billing practices.
A lot of users also pointed out how the sales team of Datadog relentlessly pursues engineers for signing up for their services.
Here are the three main caveats of Datadog's pricing:
-
Per-Host, High-Water Mark Billing: On Datadog's high-watermark plan, you're billed based on peak usage after the top 1% of hourly readings are excluded, not your average. This model can make common scaling events like handling peak-season traffic expensive.
-
Expensive Custom Metrics: You're charged a premium for custom metrics based on unique combinations of metric names and tag values (cardinality), so costs can explode unexpectedly. OpenTelemetry metrics outside supported integration allowances are billed as custom metrics.
-
Dual-Cost Log Management: You pay to ingest logs and separately to index them for searching, with indexing costs based on event count and retention. This dual-charge model can make comprehensive logging expensive, forcing a choice between visibility and cost.
In this article we will go through the best DataDog alternatives which you can consider.
List of top DataDog alternatives:
SigNoz Cloud
SigNoz Cloud is an excellent alternative to Datadog for APM, distributed tracing, log management, and metrics monitoring. It brings these signals into one product built on OpenTelemetry, with usage-based pricing instead of separate host and user charges. If you're tired of complex and unpredictable billing practices, or if you want to use OpenTelemetry, then SigNoz Cloud is the right choice. Here are some top reasons to choose SigNoz Cloud over Datadog.
OpenTelemetry Native - No vendor lock-in in your code
SigNoz Cloud is built from the ground up to be OpenTelemetry native. You can filter by resource and span attributes, inspect span events and links, and follow a trace ID to the related logs. Instrumentation scope and metric metadata stay available when you need to understand where data came from. For example, you can start with a slow request, find the span responsible, and check its logs and host metrics without starting a separate investigation. We don't charge you extra for "custom metrics" when you're using OpenTelemetry.
The same visual query builder works across logs, metrics, and traces, so you don't need to learn a different query language for each signal. Quick filters, autocomplete, and saved views help you return to an investigation. You can also scrape Prometheus endpoints with the OpenTelemetry Collector and use PromQL when you prefer it.
We've also recently launched features that double down on our OTel-native approach, including:
- LLM Observability: Monitor your LLM applications (OpenAI, Anthropic, LangChain) with out-of-the-box dashboards.
- Trace Funnels: Measure completion rates and delays between steps in a request flow.
- External API Monitoring: Gain visibility into the performance of third-party APIs your application depends on.
- Out-of-the-box Messaging Queue Monitoring: Effortlessly monitor popular queuing systems.
Flexible Hosting Options for Every Stage of Growth
We believe you shouldn't be locked into a single deployment model. You can choose managed SigNoz Cloud or self-hosted SigNoz to meet your needs as you scale:
- SigNoz Cloud: A fully-managed, scalable solution for teams that want to focus on their core business without the overhead of managing an observability platform.
- SigNoz Cloud: Dedicated Enterprise: A dedicated environment managed by SigNoz, with enterprise support and security options.
- SigNoz Cloud: Managed BYOC: SigNoz runs the platform in your cloud account, so you can meet data residency requirements without operating it yourself.
- Self-hosted SigNoz Enterprise: Your team runs the platform in your own cloud or on-premise, including storage, scaling, upgrades, and backups, with enterprise support.
- Self-hosted SigNoz Community Edition: The MIT-licensed, open-source option for teams that want to manage their own infrastructure.
Simple, Transparent, Usage-Based Pricing
The SigNoz Cloud pricing model is designed to be straightforward and predictable. Plans start at $49/month, including $49 of usage. Logs and traces cost $0.30 per ingested GB with 15-day retention; metrics cost $0.10 per million samples with one-month retention. You pay for usage above the included amount at these rates.
There are no "weird" pricing levers like per-host charges that force you to alter your architecture. Our goal is a simple, scalable model that grows with you.
With SigNoz Cloud, you get:
- No surprise bills: Our pricing is easy to understand and forecast.
- Cost-effective at scale: As your data volume grows, our pricing remains competitive.
- Freedom to architect your systems as you see fit: We don't penalize you for using modern, dynamic infrastructure.
Here's a feature overview of SigNoz Cloud:
Application Performance Monitoring
Out-of-the-box service charts for latency, throughput, error rates, ApDex, and top endpoints.

Distributed Tracing
Follow requests across services with flamegraphs, span filters, and trace analytics.

Log Management
Centralize, query, and correlate logs with traces and metrics to debug faster.

Infrastructure Monitoring
Track Kubernetes and host health with detailed CPU, memory, and network visibility.

LLM Observability
Trace LLM applications with prompt-level visibility, cost tracking, and agent analytics.

Metrics & Dashboards
Build PromQL-powered dashboards and visualize business and SRE metrics in one place.

Exceptions Monitoring
Group and triage exceptions with stack traces, trends, and ownership context.

Alerts Management
Define alerts on metrics, logs, traces, and anomalies with multi-channel notifications.

External API Monitoring
Monitor third-party API latency, throughput, and error rates alongside internal services.

Cut Your Observability Spend by 80%—Here's How
Switch from Datadog seamlessly with our automated migration tool, comparable features and up to 80% cost savings.
New Relic
New Relic is one of the oldest companies in this domain and can be a good DataDog alternative. If you opt for a full user plan, you can get access to all the tools New Relic provides in its observability stack.
Key Features
- Application Performance Monitoring: End-to-end visibility into application performance
- Browser & Mobile Monitoring: Track frontend and mobile app performance
- Infrastructure Monitoring: Monitor hosts, containers and cloud services
- Log Management: Centralized log aggregation and analysis
- Synthetic Monitoring: Proactive monitoring of user journeys
- Serverless Monitoring: Monitor AWS Lambda and other serverless platforms
- AIOps & Analytics: AI-powered insights and anomaly detection

New Relic's pricing includes 100 GB of free data ingest each month. Beyond that, Original Data costs $0.40/GB and Data Plus costs $0.60/GB. It offers data-plus-users or data-plus-compute pricing; the Standard user-based edition supports up to five full-platform users. On the user-based model, adding engineers can increase the bill alongside data ingestion.
If you're leaving Datadog with a production workload above the free allowance, compare the paid bill, not just the free tier. SigNoz Cloud has no per-user fees, so more engineers can investigate issues without adding seat costs. Use the same telemetry volume, team size, and retention in our pricing comparison and calculator to check the saving for your workload.
Pros
- Comprehensive full-stack observability platform
- Strong APM capabilities with detailed transaction tracing
- Generous free tier with 100GB data ingestion
- AI-powered analytics and troubleshooting
- Extensive integrations ecosystem
- Proven enterprise-grade platform
Cons
- Separate data and user or compute charges to budget for
- Adding full-platform users increases costs on the user-based model
- Learning curve for new users
- Limited customization options
Best For
- Enterprise organizations needing comprehensive observability
- Teams wanting proven, mature monitoring solutions
- Organizations with dedicated observability budgets
- Companies needing strong APM capabilities
- Teams requiring extensive integration options
Moving from Datadog does not have to mean rebuilding every dashboard by hand. The migration guide and dashboard converter help you move to SigNoz Cloud in stages; dashboard migration support is available for spends above $999. For a detailed comparison of the two vendors, read DataDog vs New Relic.
Dynatrace
Dynatrace is another strong contender among Datadog competitors, providing a broad spectrum of monitoring services aimed at large-scale enterprises. Its standard host-monitoring setup uses OneAgent to collect application and infrastructure telemetry. Dynatrace also supports OpenTelemetry ingestion. It can serve the following use-cases for monitoring:
Key Features
- Application Performance Monitoring: End-to-end visibility with OneAgent technology
- Infrastructure Monitoring: Monitor hosts, cloud services and virtual machines
- Container Monitoring: Support for Docker, Kubernetes environments
- Network Monitoring: Deep network visibility and analysis
- Root Cause Analysis: AI-powered problem detection and analysis
- User Experience Monitoring: Track and analyze user interactions
- Cloud Automation: Automated deployment and configuration
Full-stack monitoring, the Dynatrace product aimed to provide observability for apps, is priced at $0.01 per memory-GiB-hour. An 8 GiB host running for 730 hours would cost about $58.40 for full-stack monitoring. Logs and other separately metered services add to that bill.

Pros
- Single agent (OneAgent) deployment model
- Strong AI-powered analytics and automation
- Comprehensive infrastructure monitoring
- Enterprise-grade security features
- Detailed root cause analysis
- Extensive cloud platform support
Cons
- Full-stack costs scale with host memory and running hours
- Complex pricing structure
- Steep learning curve
- Enterprise focus may not suit smaller teams
- Resource-intensive agent
Best For
- Large enterprise organizations
- Teams needing AI-powered analytics
- Organizations with complex infrastructure
- Companies requiring detailed root cause analysis
- Teams wanting unified agent deployment
For detailed comparison, please read DataDog vs Dynatrace.
Grafana
Grafana is an open-source data visualization tool that you can use as part of a Datadog alternative. Grafana Cloud is its managed service for logs, metrics, traces, APM, and infrastructure monitoring, so you do not have to operate the backends yourself.
If you're looking to self-host a Grafana-based Datadog alternative, you'll typically use the core LGTM stack. It is particularly popular in cloud-native environments, covering logs, metrics, traces, and visualization. Grafana can also query external data sources.
The LGTM Stack Components
Grafana's observability platform is built on the LGTM stack:
- Loki: An efficient log aggregation system that indexes log metadata, enabling cost-effective storage and fast querying, integrated seamlessly with Grafana.
- Grafana: A versatile visualization tool offering customizable dashboards to display and analyze data from various sources, including metrics, logs, and traces.
- Tempo: A distributed tracing backend focused on scalability, storing and querying trace data, with easy integration into Grafana for visualization.
- Mimir: A long-term, scalable storage system for Prometheus metrics, ensuring high performance and availability for large-scale metric data.
For teams using OpenTelemetry, the difference is also in how you explore the data. Grafana's backends use PromQL, LogQL, and TraceQL for metrics, logs, and traces. SigNoz Cloud gives you one visual query builder across all three, with resource attributes, span events, and span links available during an investigation. Grafana Cloud accepts OTLP but maps OpenTelemetry metrics to its Prometheus representation. SigNoz Cloud supports native OpenTelemetry metrics as well as Prometheus scraping through the Collector, with PromQL available when you need it.
Key Features
- Visualization & Dashboarding: Create customizable dashboards to analyze and display data from multiple sources
- LGTM Stack Integration: Core observability components working together seamlessly
- Cloud-Native Support: Designed for modern containerized and microservices architectures
- Open Source Foundation: Built on open-source technologies with strong community support
- Multi-Backend Support: Connect to various data sources and backends

Pros
- Open-source foundation with enterprise features
- Highly customizable dashboards
- Support for multiple data sources
- Strong community and ecosystem
- Cost-effective compared to proprietary solutions
Cons
- Managing multiple backend components can be complex when self-hosting
- Steeper learning curve for advanced features
- Self-hosted deployment requires operational expertise
- Enterprise features require paid subscription
Grafana Cloud's free tier can cover small workloads, but a production workload moving from Datadog may exceed those limits. Compare paid plans at the same telemetry volume and retention, including the engineers who need access. SigNoz Cloud's usage-based pricing makes it a cost-effective option to evaluate at that scale. Our pricing comparison shows the assumptions, and the Grafana migration guide covers the move. Read more about Grafana vs Datadog.
LogicMonitor
LogicMonitor is a SaaS-based hybrid observability platform powered by AI that helps organizations monitor and optimize their IT infrastructure and applications.
It can be used as a DataDog alternative if you're looking for infrastructure monitoring. It also provides AIOps features, including root cause analysis, anomaly detection, and forecasting.
Key Features
- Unified Platform: Single platform for infrastructure, cloud, and application monitoring
- AIOps Capabilities: AI-powered anomaly detection, root cause analysis, and forecasting
- Dynamic Topology Mapping: Automated discovery and visualization of infrastructure dependencies
- Extensive Integrations: Over 3000 pre-built integrations and monitoring templates
- Automated Deployment: Quick setup with automatic discovery and configuration

LogicMonitor's dynamic topology mapping is a feature that distinguishes it from other Datadog competitors.
With dynamic topology mapping, you can have an overview of your network devices and their inter-dependency. Some of the key monitoring capabilities provided by LogicMonitor are:
- Infrastructure Monitoring
- Cloud Monitoring (AWS, Azure, GCP)
- Application Performance Monitoring
- Log Analytics
- Distributed Tracing
- Configuration Monitoring
- Service Insights
Pros
- Comprehensive hybrid observability solution
- LogicMonitor reports 90% less alert noise
- LogicMonitor reports a 46% reduction in mean time to resolution (MTTR)
- Easy deployment and automation
- Strong AIOps capabilities
Cons
- Can be complex for small organizations
- Pricing may be higher for extensive deployments
- Some advanced features require additional configuration
AppDynamics
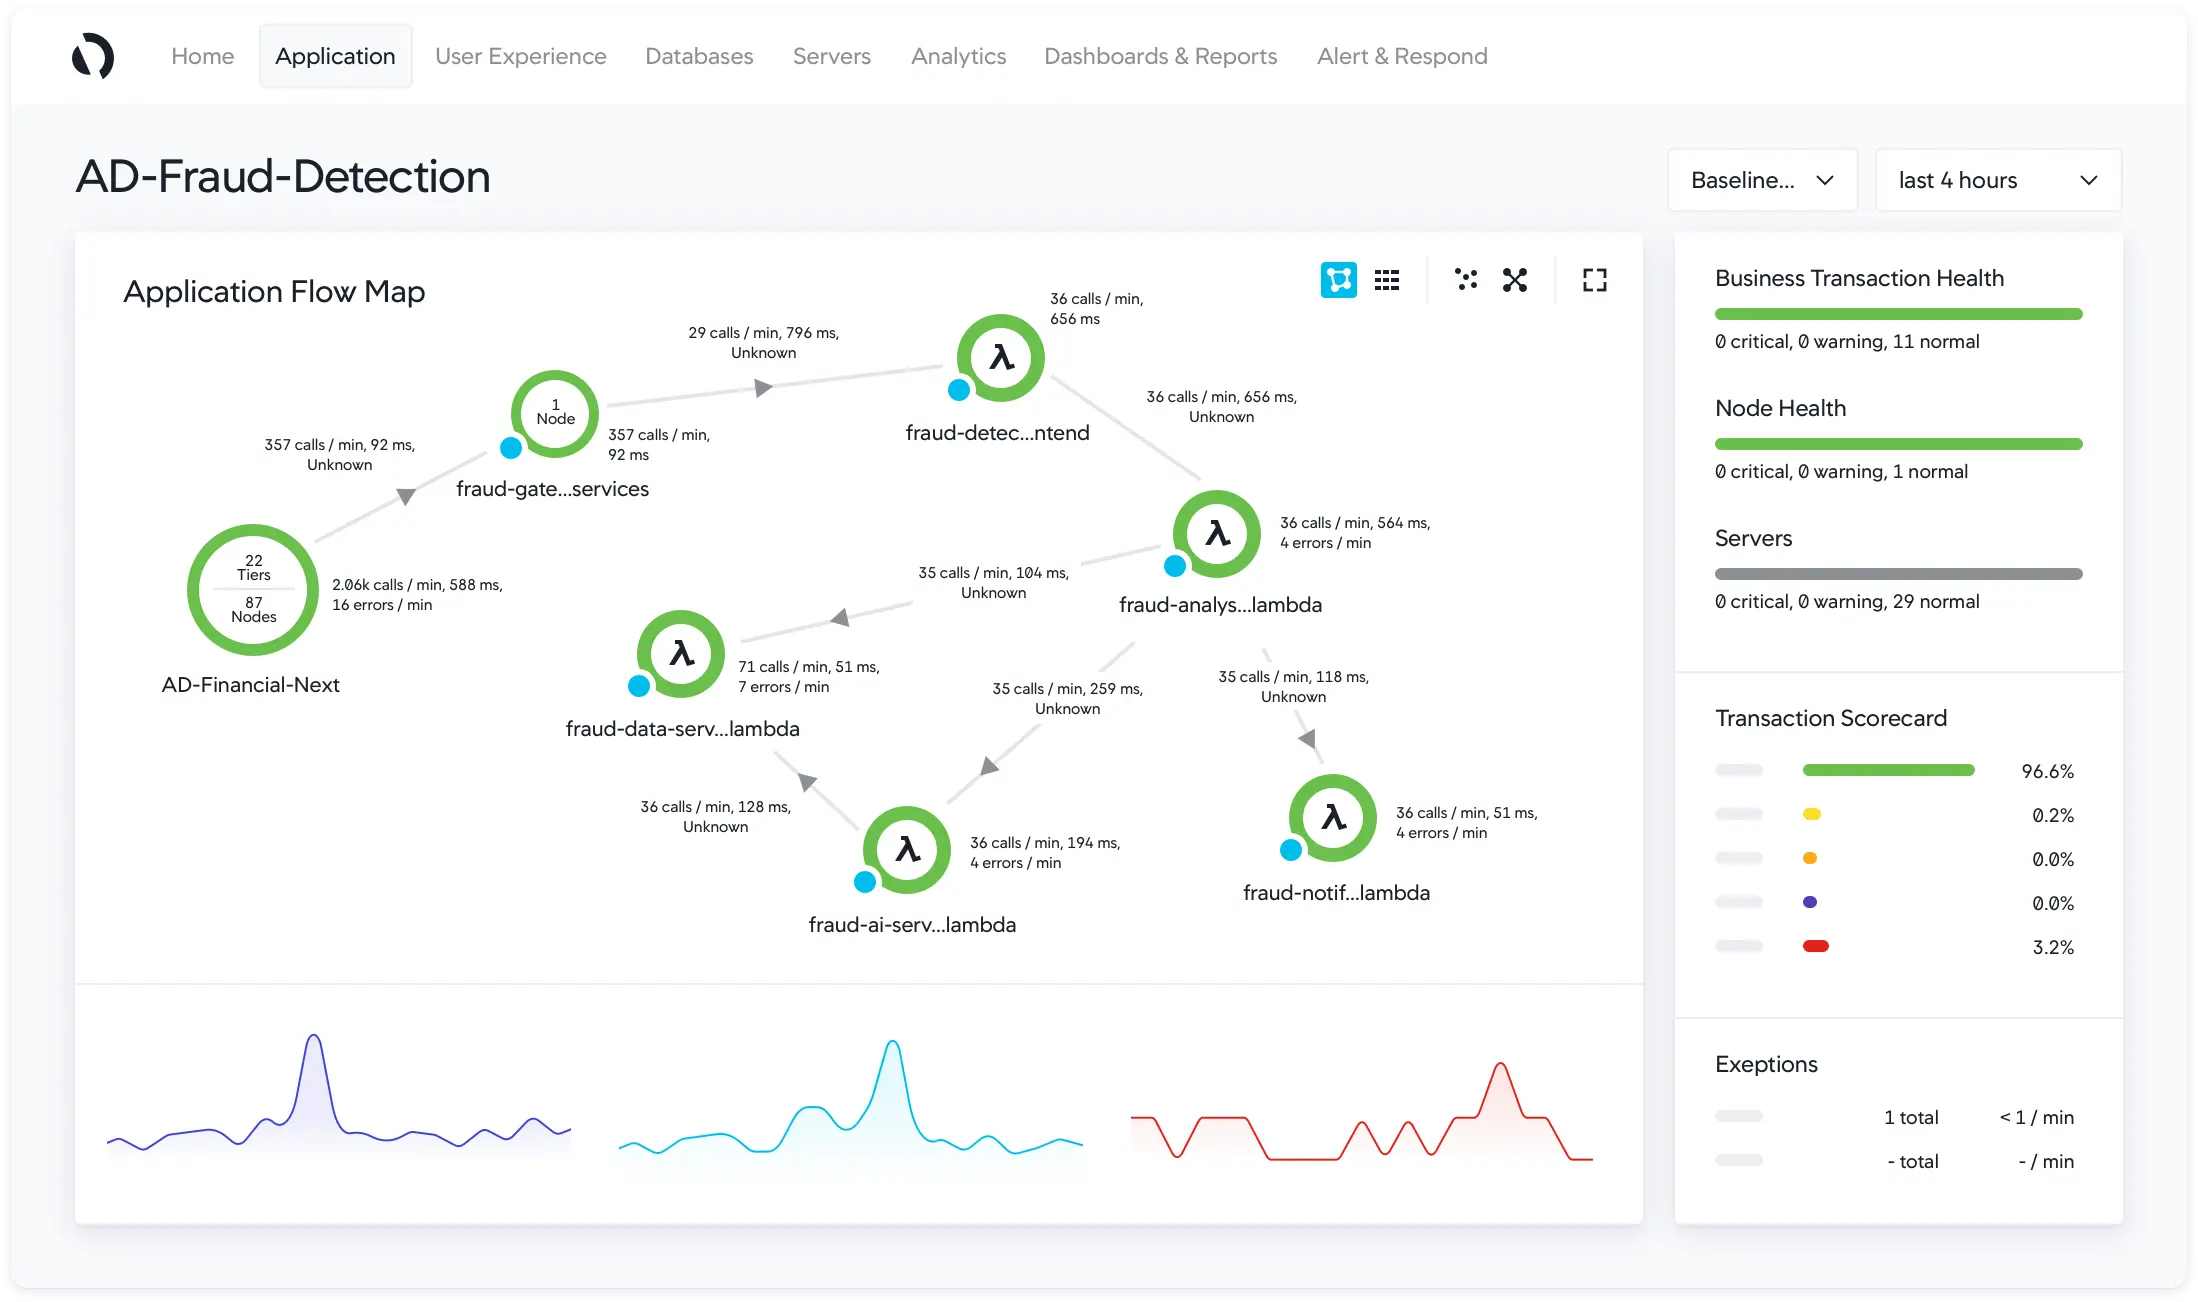
AppDynamics is an extensive SaaS tool and a significant player among Datadog competitors, that promises to correlate business metrics and application performance metrics. It can be used as a good DataDog alternative. Its platform includes an APM tool that provides code-level observability.
Key Features
- Full-Stack Observability: End-to-end visibility across applications, infrastructure and business context
- Business iQ: Correlates technical performance with business metrics
- AI/ML Capabilities: Automated anomaly detection and root cause analysis
- Code-Level Diagnostics: Deep application performance insights
- Multi-Cloud Support: Monitoring for cloud, hybrid and on-premise environment
Pros
- Deep code-level visibility
- Strong business metrics correlation
- Enterprise-grade security
- Extensive language support
- Powerful analytics capabilities
Cons
- Complex initial setup
- Higher price point
- Steep learning curve
- Resource intensive agents
Splunk
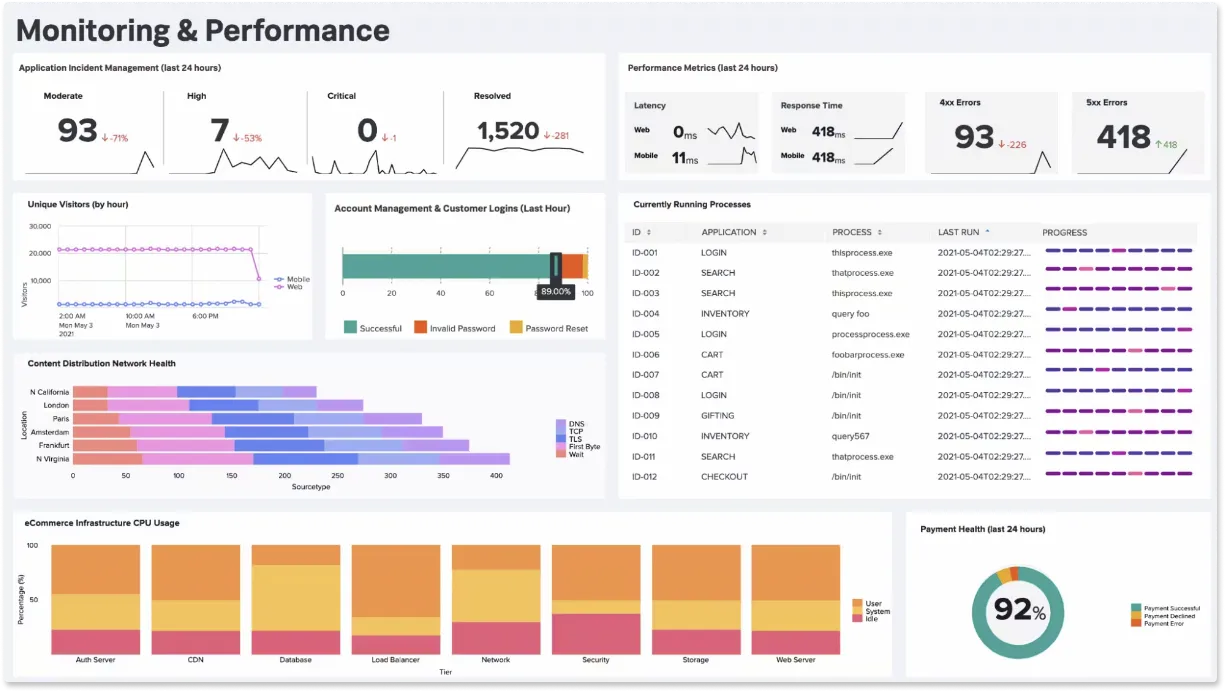
Splunk is a software platform designed for searching, monitoring, and analyzing machine-generated data. It's primarily used for log and event data analysis, but its capabilities extend to various types of data, including metrics, security information, and more. Splunk provides a centralized platform where you can collect, index, and visualize data from a wide range of sources, such as servers, applications, network devices, sensors, and websites.
Key Features
- Log Management: Splunk can ingest, index, and store log data from various sources.
- Security Information and Event Management (SIEM): It can be used for security monitoring and threat detection.
- Monitoring and alerting: Splunk can set up real-time alerts based on predefined conditions, helping organizations respond to issues as they occur.
- Unified Data Platform: Centralized collection and analysis of logs, metrics, traces and more
- Advanced Analytics: Powerful search and visualization capabilities
- Security Intelligence: Built-in SIEM functionality and threat detection
- Machine Learning: Automated anomaly detection and predictive analytics
- Real-time Monitoring: Live data ingestion and alerting capabilities
It offers both on-premises and cloud-based solutions, and it has a wide range of apps and integrations to support specific use cases and industries.
Pros
- Powerful search capabilities
- Extensive integration options
- Strong security features
- Flexible deployment options
- Large ecosystem of apps
Cons
- Complex pricing model
- Resource intensive
- Steep learning curve
- Can be expensive at scale
Sematext
Sematext is a monitoring tool that specializes in providing monitoring, logging, and observability solutions for modern software applications and infrastructure. The company offers a range of tools and services designed to help organizations gain insights into their systems, troubleshoot issues, and improve overall performance.
Key Features
- Metrics Monitoring: Sematext offers monitoring solutions that allow organizations to collect and visualize metrics from various sources, including servers, applications, containers, and cloud services.
- Log Management: Sematext provides log management capabilities comparable to those found in open source logging tools, enabling the collection, aggregation, and analysis of log data from different components of an organization’s technology stack.
- Tracing and APM: Sematext offers application performance monitoring and tracing capabilities, allowing organizations to trace requests and transactions through their applications.
- Infrastructure Monitoring: Sematext's solutions cover infrastructure monitoring, allowing organizations to monitor server health, resource utilization, and network performance.

Pros
- Easy to set up and use
- Good documentation
- Flexible deployment options
- Competitive pricing
- Built-in alerting
Cons
- Limited third-party integrations
- Basic reporting capabilities
- UI can be improved
- Some features lack depth
Sumo Logic
Sumo Logic is a cloud-based log management and analytics platform that helps organizations collect, manage, and analyze data generated by their applications, systems, and infrastructure. It is designed to provide real-time insights into the performance, security, and operational aspects of an organization's IT environment.

Key Features
- Log Management: Sumo Logic allows organizations to centralize the collection and storage of log data from various sources, including servers, applications, cloud services, and network devices.
- Real-Time Monitoring: Sumo Logic provides real-time monitoring and alerting capabilities, enabling organizations to proactively detect and respond to issues as they occur.
- Log Analysis: Users can perform advanced log analysis using Sumo Logic's query language and search capabilities. This allows for the identification of patterns, anomalies, and trends within log data.
- Security Information and Event Management (SIEM): Sumo Logic can be used as a SIEM solution, helping organizations detect and investigate security threats by correlating and analyzing security-related data from logs and other sources.
Pros
- Scalable cloud-based solution
- Real-time monitoring and alerting
- Advanced log analysis capabilities
- Integrated SIEM functionality
Cons
- Can be complex to set up and configure
- Pricing can be high for smaller organizations
- Limited offline capabilities
Choosing the Right Datadog Alternative
If you're looking for a Datadog alternative, start with the problems you want to solve: a bill that is hard to forecast, a complex interface, or too much work connecting logs, metrics, and traces. SigNoz Cloud addresses these with usage-based pricing and a shared query builder in one OpenTelemetry-native product.
The above DataDog alternatives can be a good option to meet your monitoring needs. If one of those tools stands out, it might be worth checking out the more focused guides on Dynatrace alternatives, Grafana alternatives, and Splunk alternatives for pricing, strengths, and migration tradeoffs.
For an OpenTelemetry backend, SigNoz Cloud is a great choice. You can keep instrumentation based on open standards and use the resulting context to investigate issues across signals. Start a trial with one service, follow the Datadog migration guide, and compare the workflow and cost with your current setup.
Getting started with SigNoz Cloud
SigNoz Cloud is the easiest way to run SigNoz. Sign up for a free account and get 30 days of unlimited access to all features.

You can also install and self-host SigNoz yourself since it is open-source. With 24,000+ GitHub stars, open-source SigNoz is loved by developers. Find the instructions to self-host SigNoz.
FAQs
Who is Datadog's biggest competitor?
Datadog's biggest competitors include SigNoz Cloud, New Relic, Dynatrace and Grafana. In all of these, the best choice depends on your specific needs. For APM, logs, metrics, and traces with OpenTelemetry-native workflows and usage-based pricing, SigNoz Cloud is a great choice. New Relic and Dynatrace also provide broad observability platforms. Grafana can be used with self-hosted backends or through the managed Grafana Cloud service.
Is Datadog better than Splunk?
Datadog and Splunk serve different purposes with some overlap. Datadog excels in cloud infrastructure monitoring and APM, while Splunk is renowned for log management and SIEM. The choice depends on your specific needs. For a comprehensive open-source alternative that integrates metrics, logs, and traces, consider self-hosted SigNoz.
How to replace Datadog?
You can replace Datadog in stages with SigNoz Cloud. Instrument one service with OpenTelemetry SDKs or auto-instrumentation, then configure the Collector to send its telemetry to SigNoz Cloud. The dashboard migration tool converts Datadog dashboard JSON into SigNoz Cloud dashboards; review the converted queries and widgets against your data. Validate the signals, dashboards, and alerts before turning off the matching Datadog collection. Follow the migration guide for the full process. Dashboard migration support is available for spends above $999.
What makes Datadog so good?
Datadog is popular due to its comprehensive monitoring capabilities, ease of use, and numerous integrations. Its powerful dashboards and alerting system also contribute to its appeal. However, its complex and unpredictable pricing can be a drawback. For a managed alternative with usage-based pricing, consider SigNoz Cloud.
What is the weakness of Datadog?
The primary weakness of Datadog is its complex SKU-based pricing, which can lead to unpredictable and often high costs, especially for smaller organizations.
Can Grafana replace Datadog?
Grafana can replace Datadog for many monitoring and visualization needs when paired with backends such as Loki, Tempo, and Mimir. Self-hosting that stack requires configuration and ongoing operations; Grafana Cloud manages the backends for you. SigNoz Cloud is another managed option, with one query builder and connected logs, metrics, and traces in one product.
Is Datadog SaaS only?
Yes, Datadog is a SaaS-only platform, offering its services via the cloud, which simplifies deployment and scaling for users. For an open-source alternative that you can deploy on-premise or in your own cloud, consider self-hosted SigNoz.
Is Sentry better than Datadog?
Sentry and Datadog serve different purposes. Sentry focuses on error tracking and performance monitoring for applications, while Datadog offers a broader range of monitoring and observability features. The choice depends on specific needs.
Is Datadog like Grafana?
Datadog and Grafana both provide monitoring and visualization capabilities. Datadog is an all-in-one SaaS platform, while Grafana is a visualization tool used with data backends. You can operate a Grafana-based stack yourself or use the managed Grafana Cloud service.
Tired of Unpredictable Pricing with DataDog?
SigNoz offers up to 9X ROI compared to DataDog with simple, transparent pricing:
- No user-based pricing
- No host (container or nodes) based pricing
- Simple usage-based pricing
- No special pricing for custom metrics

Read More:


